 Open Access Article
Creative Commons Attribution 3.0 Unported Licence
Emergent collective behavior of active Brownian particles with visual perception†
Rajendra Singh
Negi
 ,
Roland G.
Winkler
 and
Gerhard
Gompper
 *
*
Theoretical Physics of Living Matter, Institute of Biological Information Processing and Institute for Advanced Simulation, Forschungszentrum Jülich, 52428 Jülich, Germany. E-mail: g.gomper@fz-juelich.de
First published on 20th July 2022
Abstract
Systems comprised of self-steering active Brownian particles are studied via simulations for a minimal cognitive flocking model. The dynamics of the active Brownian particles is extended by an orientational response with limited maneuverability to an instantaneous visual input of the positions of neighbors within a vision cone and a cut-off radius. The system exhibits large-scale self-organized structures, which depend on selected parameter values, and, in particular, the presence of excluded-volume interactions. The emergent structures in two dimensions, such as worms, worm-aggregate coexistence, and hexagonally close-packed structures, are analysed and phase diagrams are constructed. The analysis of the particle's mean-square displacement shows ABP-like dynamics for dilute systems and the worm phase. In the limit of densely packed structures, the active diffusion coefficient is significantly smaller and depends on the number of particles in the cluster. Our analysis of the cluster-growth dynamics shows distinct differences to processes in systems of short-range attractive colloids in equilibrium. Specifically, the characteristic time for the growth and decay of clusters of a particular size is longer than that of isotropically attractive colloids, which we attribute to the non-reciprocal nature of the directed visual perception. Our simulations reveal a strong interplay between ABP-characteristic interactions, such as volume exclusion and rotational diffusion, and cognitive-based interactions and navigation.
1 Introduction
Group formation and collective motion in form of swarms or flocks is a hallmark of living systems on length scales from bacteria and sperm to school of fish, flocks of birds, and animal herds.1–6 This behavior often emerges without central control and is rather governed by the response of individuals to the action of other group members or agents. Arising patters and structures not only depend on the physical interactions between the various agents of an ensemble, but are often governed by a nonreciprocal information input, e.g., by visual perception in case of birds and animals, processing of this information, and active response. Unravelling the underlying mechanisms and principles not only sheds light onto the behavior of biological systems, but provides concepts to design functional synthetic active systems, which are able to adopt to environmental conditions and perform complex tasks autonomously.7In dry active matter systems—absence of hydrodynamic interactions—self-propulsion and volume-exclusion lead to motility-induced phase separation (MIPS), as demonstrated in simulations of systems of active Brownian particles (ABPs)4,8–15 and in experiments.14,16–19 The presence of an embedding fluid, implying long-range hydrodynamic interactions, can suppress MIPS,20,21 but can also give rise to large scale collective effects22–26—which depend on the presence or absence of thermal fluctuations21—and swarming motility.27
Vision is the primary sensor for birds, and, as is established by now, a bird in a flock responds mainly to positions and motion of its seven nearest neighbors.1,28–30 The Vicsek model for flocking accounts for such interactions in a coarse-grained manner by a velocity alignment mechanism between nearby neighbors.31 By varying the mean density, the strength of the reorientational noise, and the interaction radius, a wide spectrum of structures is obtained, such as global polar order or flocks.32–34 This suffices to build up long-range orientational order in two dimensions35,36 and giant density fluctuations.2
Alternative approaches for emergent collective behaviors without velocity alignment have been proposed, relaying on repulsion-attraction interactions,37 elasticity-based interactions,38 visual interactions with30 and without coalignment,39,40 and aggregation based on chemical gradients.41 Not all models yield necessarily flocking, but particular phases and collective motion emerge, which are absent in “dumb” ABP-type systems, such as “vision”-based aggregation and cluster formation, and worm-like structures as in ref. 39.
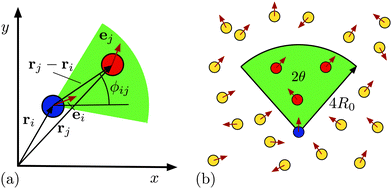
In this article, we study structure formation in systems of self-steering particles by applying the minimal cognitive flocking model proposed in ref. 39. Here, ABPs are additionally equipped with vision-based sensing, which allows them to detect the instantaneous positions of neighboring ABPs within a vision cone (VC) and a short-distances cutoff radius. The relaxation of their propulsion directions is governed by a redirection force of limited magnitude, implying a limited maneuverability, toward the centre of mass of the detected particles, which is in competition with rotational noise. Since the particles are able to sense and respond to their neighbors, we denote them as intelligent active Brownian particles (iABPs). The iABPs possess no memory and lack the velocity alignment of the Vicsek model. As an extension to previous studies,39 we take into account excluded-volume interactions between the iABPs and solve the underdamped equations of motion in the presence of thermal noise for their translational motion.
Our simulations reveal various additional phases compared to those already presented in ref. 39, which originate from excluded-volume interactions, such as hexagonally close-packed aggregates, fluid-like aggregates, worms, worm-aggregate coexistence, and dilute and diffuse clusters at different parameters sets. The strength of the response to the visual signal, the vision angle, packing fraction, cutoff range, and active propulsion determine the location and extent of these phases in the phase diagram.
Moreover, our analysis of the cluster-growth process from a dilute isotropic state via nucleation and merging of smaller clusters into larger ones exhibits distinct difference to the process for systems of short-range attractive passive colloids.42 Specifically, the critical exponent of the dependence of the characteristic time for cluster growth on the number of particles in the cluster is larger than that of the passive colloidal system. The implemented perception rule slows down clustering and cohesion, which is attributed to the nonreciprocal visual interactions and the resulting directed motion.
2 Model and simulation approach
We consider a two-dimensional systems of N perceptive and responsive “intelligent” active Brownian particles (iABPs) at positions ri(t) (i = 1,…, N) at time t, which are propelled by the active force Fai(t) = γv0ei(t) with the velocity v0 along the direction ei(t). Their equations of motion are given by43m![[r with combining umlaut]](https://www.rsc.org/images/entities/b_i_char_0072_0308.gif) i = −γṙi + γv0ei + Fi + Γi(t), i = −γṙi + γv0ei + Fi + Γi(t), | (1) |
 | (2) |
![[thin space (1/6-em)]](https://www.rsc.org/images/entities/char_2009.gif) φi, sin
φi, sin![[thin space (1/6-em)]](https://www.rsc.org/images/entities/char_2009.gif) φi)T, yields the equations of motion for the angles φi
φi)T, yields the equations of motion for the angles φi | (3) |
 | (4) |
![[thin space (1/6-em)]](https://www.rsc.org/images/entities/char_2009.gif) ϕij, sin
ϕij, sin![[thin space (1/6-em)]](https://www.rsc.org/images/entities/char_2009.gif) ϕij)T between particle i and j.30,39 The condition for particles j to lie within the vision cone of particle i is
ϕij)T between particle i and j.30,39 The condition for particles j to lie within the vision cone of particle i is | (5) |
3 Parameters
In the simulation, we measure energies in units of the thermal energy kBT, lengths in units of σ, and time in units of . The activity of the iABPs is characterized by the Péclet number
 | (6) |
 and the rotational diffusion coefficient DR = 8 × 10⁻²/τ, which yields the relation DT/(σ2DR) = 1/8. We set ε/kBT = (1 + Pe) to ensure a nearly constant iABP overlapping even at high activities. The iABP density is measured in terms of the global packing fraction Φ = πσ2N/(4L2), with L the length of the quadratic simulation cell. Periodic boundary conditions are applied and the equations of motion (1) are solved with a Velocity-Verlet-type algorithm suitable for stochastic systems,44 with the time step Δt = 10−3τ. We perform 106 equilibration time steps and collect data for additional 107 steps. For certain averages, up to 10 independent realizations are considered.
For ABPs, the above choice of the friction and rotational diffusion coefficients ensures that inertia does not affect MIPS. As shown in ref. 45, for the ratio M = mDR/γ = 8 × 10⁻⁴ and the considered Péclet numbers, we do not expect MIPS. In case of emerging dense clusters, the position of phase boundaries seems to depend slightly on the presence of inertia. This aspect deserves a more detailed analysis.
If not indicated otherwise, the number of particles is N = 625, the characteristic radius R0 = 1.5σ, Ω/DR = 62.5, and the opening of the vision cone π/24 ≤ θ ≤ π/2.
Initially, the iABPs are typically arranged on a square lattice, with iABPs distances equal to their diameter σ in the center of the periodic simulation square.
4 Structural and dynamical properties
4.1 Low packing fraction
 | ||
| Fig. 2 Snapshot of iABP structures for various vision angles: (a) hexagonal-closed packed structure, θ = π/2, (b) worm-aggregate coexistence, θ = π/4, (c) worms, θ = π/5, and (d) dilute fluid, θ = π/12. The Péclet number is Pe = 200, the strength of the perceptive interaction Ω/DR = 62.5, and the packing fraction Φ = 7.85 × 10⁻³. The various colors represent different clusters or worms. See movies M1 and M2 (ESI†). | ||
To characterize the various phases, we calculate the cluster-size distribution function46,47
 | (7) |
 , which determines NN. The distribution function
  (n) is sometimes referred to as weighted cluster-size distribution function due to the factor n.48 We use a distance criterion to define a cluster, where an iABP belongs to a cluster when its distance to another iABP of the cluster is within a radius σ0. Since we mainly focus here on dilute systems and worms, we set σ0 = 2σ.
Fig. 3 presents cluster-size distribution functions for various vision angles. They are fitted by
 | (8) |
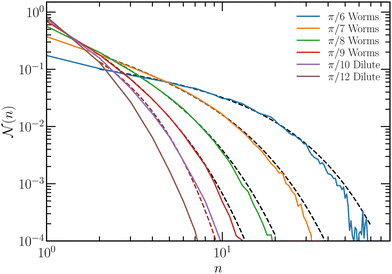 | ||
Fig. 3 Cluster-size distribution function  as a function of the cluster size n at Pe = 200, Ω/DR = 62.5, and packing fraction Φ = 7.85 × 10⁻³. The dashed lines are fits of the function as a function of the cluster size n at Pe = 200, Ω/DR = 62.5, and packing fraction Φ = 7.85 × 10⁻³. The dashed lines are fits of the function  of eqn (8) with the parameters of Table 1. of eqn (8) with the parameters of Table 1. | ||
| θ | π/6 | π/7 | π/8 | π/9 | π/10 |
|---|---|---|---|---|---|
| μ | 0.34 | 0.8 | 1.1 | 1.4 | 0 |
| n 0 | 13.4 | 7.1 | 3.8 | 2.3 | 1 |
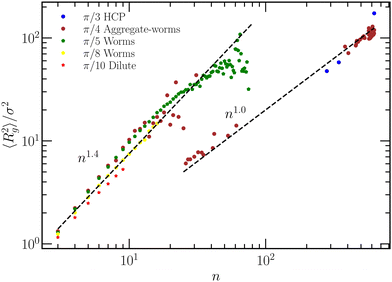
To classify the various phases of Fig. 2, we calculate the radius of gyration,
 | (9) |
For a disc-like dense packing of n iABPs, its radius, r, increases as r2 ∼ n. Hence, the linear increase of 〈Rg2〉 is consistent with a dense aggregate of iABPs. Thus, we expect dense clusters of iABPs for θ = π/3 and π/4 for larger n, which is confirmed by visual inspection (Fig. 2(a)). Larger exponents correspond to more open structures. In particular, a linear arrangement of iABPs in a rod-like manner would correspond to 〈Rg2〉 ∼ n2. Visual inspection indeed shows the presence of wormlike structures, which, however, are not rodlike, but rather curvilinear, hence, 〈Rg2〉 ∼ nα with α < 2 (Fig. 2(c)). In the system with θ = π/4, wormlike structures and dense aggregates coexist (Fig. 2(b)).
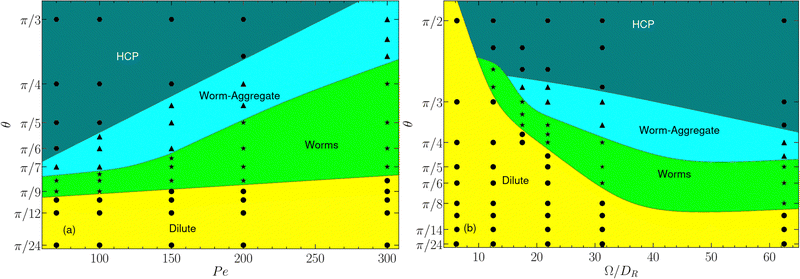
Based on the radius-of-gyration results and the cluster-size distributions, we construct the phase diagram of Fig. 5 for various Pe and Ω. Four phases can be clearly identified: (i) a dilute phase (θ ⪅ π/10 in Fig. 5(a)), (ii) a phase of mobile worms for a narrow range of somewhat larger θ, (iii) a coexistence of worms and aggregates, denoted as worm-aggregate phase, and (iv) a phase with hexagonally closed-packed aggregates, denoted as HCP phase, at large θ.
In the dilute phase, θ ⪅ π/10, the system is homogeneous and isotropic. The vision angle and range are too small to allow for persistent sensing of neighboring particles, and the noise dominates over maneuverability. For the parameters of Fig. 5(a), this behavior depends only weakly on Pe, with an extension of the dilute phase toward somewhat larger θ at larger Péclet numbers. As θ increases, worms appear, where an iABP is trailed by several others. Similar structures have previously been observed in ref. 39 for pointlike particles. As indicated in Fig. 2 and 4, the worms can be quite long, comprising up to 80 iABPs. Here, the truncated perception cone is sufficiently large to allow for a persistent tracking and chain formation. The directional dynamics of the worm is determined by the leading iABP, since it does not see other iABP and the orientational dynamics is governed by its rotational noise. The stretch of the worm phase depends on the Péclet number and extents to larger θ at higher Pe. Even wider vision cones lead to formation of aggregates, which coexist with worms—the worm-aggregate phase. The presence of a wider vision cone implies a preferred motion of more particles toward each other, and the emergent locally higher density stabilizes the clusters. Again, the extent of this phase depends on Pe. Finally, a densely packed aggregate is obtained for large θ, comprising essentially all iABPs. Our analysis shows that the local structure in the aggregate is hexagonally closed packed (Fig. S4, ESI†). iABPs always discern sufficiently many neighbors to stay close to them. Only for large Pe, iABPs are able to escape, trailing other particles, and form worms.
To investigate possible finite-size effects, we consider also a larger system of N = 103 iABPs at the same density, for Pe = 200 and θ = π/4, where worm-aggregate coexistence is observed in Fig. 5. As displayed in Fig. S7 (ESI†), we obtain the same structures, with the sizes of aggregates and worms increasing proportionally with the overall particle number N. This indicates that finite-size effects are small. A calculation of the full phase diagram at the higher N is very demanding in terms of computational time, and thus has not been attempted here.
Here, a comment on the stationary-state properties of the observed structures is in order. The identified worm-aggregate, worm, and dilute phase are stationary, and do not depend on the initial arrangement of the ABPs. These structures are very dynamic, they form, break apart, and reform. The situation is less clear for the HCP phase. Here, the initial arrangement never breaks apart, and it is not clear whether it is stable or not. However, when starting from a dilute-phase as initial condition, clusters are formed, which slowly merge into larger ones as described in more detail in Section 5, but the possible final state of a single large cluster cannot be observed in simulations in general due to the very slow merging process.
The extension of the various phases in the phase diagram depends on the maneuverability strength Ω, as displayed in Fig. 5(b). At very small value of Ω, noise dominates the orientational dynamics, and the iABPs are not able to persistently move toward sensed other iABPs—the system is in the dilute phase. For larger Ω, the maneuverability begins to dominate over rotational noise, iABPs can move into the sensed direction, and, depending upon the vision angle, can form HCP, worm-aggregate, worm phases.
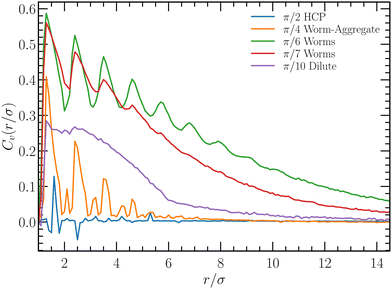
 | (10) |
 . Fig. 6 presents Cv(r) for various vision angles. At the angle θ = π/2, in the HCP phase, there is no significant spatial velocity correlation. The propulsion directions are independent, because iABPs inside a cluster see the same environment in any direction. The non-zero value of Cv for θ =π/10, and its extent over several iABP diameters, indicates significant velocity correlations already in the dilute phase. Hence, the dilute phase is different from the fluid phase of a passive system, as is also reflected in the spatial pair distribution function (Fig. S4, ESI†). Long-range correlations are inherent in worms. Naturally, the trailing of iABPs in worms is only possible with strong velocity correlations. The maxima in Cv correspond to preferred distances between iAPBs at multiples of 1.25σ, as also displayed by the pair distribution function. Minima appear approximately at multiples of σ. The distance 1.25σ is consistent with visual inspection, and suggest that the distance between subsequent iABPs in a worm is larger than their diameter, i.e., the typically do not touch. Worms are often nonlinear assemblies, with touching particles forming clusters moving together. The velocities of such additional iABPs are not necessarily fully aligned along the main worm direction, giving raise to smaller values of the velocity correlation function. This explains the oscillations of Cv for θ = π/6 and π/7.
 | (11) |
 | (12) |
 , determined by the fraction of iABPs in aggregates. The dynamics of the ABPs in the aggregates are slower than free ABPs, but ABPs are able to split off, move like independent ABPs, and rejoin dynamical clusters. In average, we obtain an ABP dynamics with a reduced effective Péclet number.
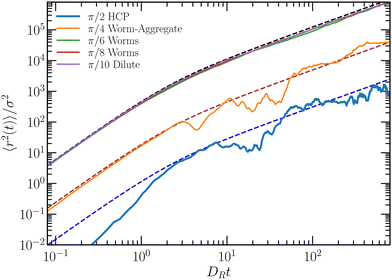 | ||
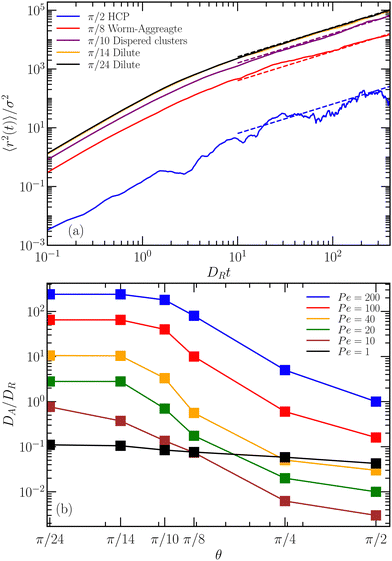
| Fig. 7 Mean-square displacement of iABPs as a function of time at Pe = 200, Ω/DR = 62.5, vision range R0 = 1.5σ, and the packing fraction Φ = 7.85 × 10⁻³. The dashed lines are fits of eqn (12), without the passive diffusion term 4DTt. | ||
In the HPC phase for θ ≤ π/2, we still observe long-time active diffusion for DRt > 1, with the active velocity  , i.e., a 20 times smaller active Péclet number. Here, the aggregate moves as a whole. Calculations for N bound active Brownian particles yield an active diffusion coefficient proportional to 1/N,52 which corresponds to an effective active velocity
  . With about 650 particle in a cluster, the reduction by the factor 20 of v0 is consistent with the picture of a cluster moving actively as a whole.
4.2 Higher packing fraction
 | ||
| Fig. 8 Snapshot of iABP structures for various vision angles: (a) hexagonal-closed packed (HPC) structure, θ =π/2, (b) hexagonal-closed packed (HPC) structure, θ = π/3, (c) worm-aggregate coexistence, θ = π/5, (d) dispersed cluster (DC) phase, θ = π/10, for the P'eclet number Pe = 200, and (e) aggregate phase, θ = π/12, for Pe = 10. The strength of the perceptive interaction is Ω/DR = 62.5, and the packing fraction Φ = 0.0785. The various colors represent different cluster. See movies M3, M4, and M5 (ESI†). | ||
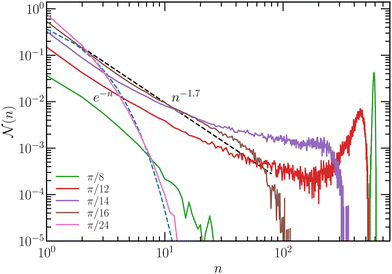
The cluster-size distribution function of Fig. 9 shows the crossover from a fluid-like phase with an exponentially decaying N for θ < π/16 to an bimodal distribution characteristic for a phase separated system.27 The angle θ = π/16 is close to the boundary separating the two phases. Note that we use σ0 = 1.2σ in this case to identify iABPs belonging to a particular cluster.
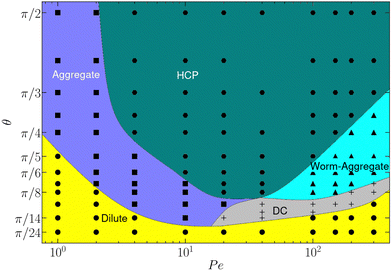
Based on the cluster-size distribution function, visual inspection, and the hexagonal order parameter q6 (Fig. S3, ESI†)9,46,53—specifically for separating the aggregate and HCP phase—, we obtain the phase diagram in Fig. 10. Again, we find a HCP, worm-aggregate, and a dilute phase, however no worm phase. Evidently, higher densities enhance the preference of cluster and aggregate formation, because more particles appear in the vision cone. At smaller Pe < 50, in the aggregate phase, the iABPs form smaller cohesive clusters, which remain close to each other, but are highly dynamic by resolving and reforming while in contact with a dilute phase (Fig. 8(e)). At low Pe, this phase extends up to θ = π/2. With increasing Pe, and for θ > π/8, a HCP phase is present. The more persistent motion implies stronger cohesion and formation of a denser aggregate. Even larger Pe lead to melting of the HPC aggregates and a worm-aggregate phase appears as long as Pe ⪆ 50 and π/9 < θ < 3π/2 (Fig. 8(c)). Compared to the worm-aggregate phase at the lower density, the worms are typically shorter in length and shorter lived (Section 4.1.1). For smaller vision angle, the second new phase, the dispersed cluster phase, appears at high Péclet numbers, with small and short-lived clusters (Fig. 8(d)).
The various phases not only depend on Pe, but also on the vision range R0 and the maneuverability Ω. Fig. S2 (ESI†) presents the dependence on R0 and Ω for Pe = 10. The three phases, dilute, aggregate, and HCP, as in Fig. 10, are present for the range of considered values R0 and Ω. With increasing vision range and maneuverability strength, the transition to the aggregate and HCP phase shifts to smaller vision angels. This is to be expected, because by a large R0, more iABPs are present in the vision cone, enhancing the tendency of clustering, and thus, cohesion. Similarly, at a larger Ω, orientational noise is less important compared the maneuverability, which also enhances cohesion.
 | (13) |
 | (14) |
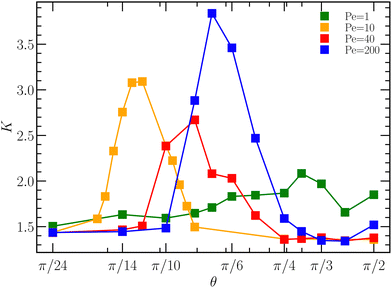
Fig. 11 shows the kurtosis for various Pe. At very low vision angles, in the dilute phase, the ABPs are homogeneously distributed and K ≈ 1.4 for all Pe, in agreement with the theoretical prediction K = 7/5. For Pe = 1, the K are close to the isotropic value at small θ, but increase with increasing θ, indicating formation of inhomogeneities, consistent with the formation of rather mobile clusters.
Similarly, for Pe = 10 and θ ⪅ π/20 the system is isotropic and homogeneous. At θ ≈ π/18, K increases sharply and reaches the value K ≈ 3.2 corresponding to a symmetric Gaussian distribution of iABPs (Fig. 10). The value K suggests that the shape of the aggregate is flexible and the iABPs are mobile, which agrees with the visual impression of a very dynamic, fluid-like cluster. Between θ = π/8 and θ = π/2, the phase transition from the aggregate phase to the HCP phase occurs, and K approaches the value K ≈ 3/4. Here, the iABPs are densely packed and uniformly distributed in a circular area much smaller than the simulation cell (Fig. 8(b)).
The broad peak at Pe = 40 for π/14 < θ < π/4 comprises configurations in the distributed cluster, worm-aggregate, and HCP phase. The values 7/4 ⪅ K ⪅ 2.5 point toward large variations in density or/and shapes of clusters.
For Pe = 200, K increases as distributed clusters appear (θ ⪅ π/10), reaches a maximum at θ ≈ π/7 in the worm-aggregate phase (Fig. 8(c)). In the latter case, the structures are rather non-uniform, specifically the worms, which yields the higher value K ≈ 3.8. The K value of a dense, uniform, and symmetric cluster is reached for θ ≈ π/3 ((Fig. 8(b)). The larger K value at π/2 is caused by the shape asymmetry of the cluster in in the HCP phase (Fig. 8(a)). From the kurtosis it is clear that the dilute phase and closed packed hexagonal structure phases are more uniformly distributed and the value is close to the theoretical expectation. Hence, the kurtosis allows for a distinction of the dilute, aggregate (or worm-aggregate), and HCP phase and shape asymmetry within a phase.
5 Cluster growth
In the HCP phase, clusters form from an initial uniform distribution of iABPs, which then merge and grow in time. We analyze the cluster-growth process as a function of time by calculate the number p(n, t) of clusters of size n at time t and determine the time-dependent average cluster size42 | (15) |
Fig. 13(a) shows the time-dependence of the average cluster size for various Pe. Evidently, cluster growth depends on Pe, and C(t) exhibits two power-law regimes, C(t) ∼ tzk (k = 1,2). The short-time regime, 1 < DRt < 10, starts approximately after the iABPs reach the active diffusive time regime (Fig. 12). The exponent of the power-law growth, z1, depends on Pe. As displayed in Fig. 13(b), it can be well described by z1 ∼ Pe4/5. Even more, the exponent depends on the vision angle (Fig. S5, ESI†) for which we find z1 ∼ θ1/5, hence,
| z1 ∼ Pe4/5θ1/5. | (16) |
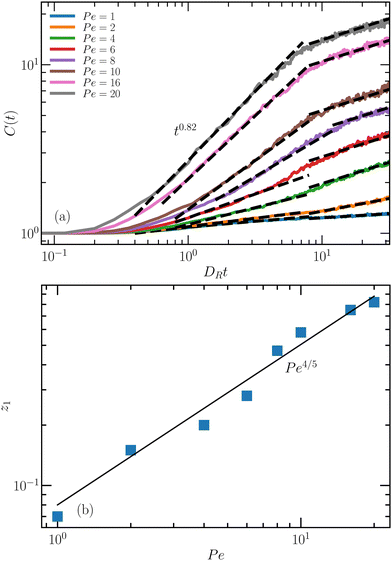 | ||
| Fig. 13 (a) Average cluster size as a function of time for various Pe, the vision angle θ = π/2, and the packing fraction Φ = 1.57 × 10⁻¹. (b) Growth exponent z1 as a function of Pe. See movie M6 (ESI†). | ||
The system-size dependence of C(t) is analyzed by increasing the number of iABPs by a factor of two and four at the constant packing fraction Φ = 1.57 × 10⁻¹. Within the accuracy of the simulations, the various C(t) curves agree very well with each other, and we could not detect a finite-size dependence (see Fig. S6 of ESI†).
To further characterize cluster formation, we consider the concentration Pn(t) = p(n, t)/A (eqn (7)) of clusters containing n iABPs at time t within the area A of the simulation box. Initially the iABP concentration is P0 = 0.2. The temporal evolution of the relative concentration of clusters is presented in Fig. 14(a) for various clusters sizes. The concentration P1 of individual iABPs decrease with increasing time as particles merge. At the same time, clusters emerge, first dimers, then trimers, etc., into larger clusters, which causes an initial growth of Pn(t) (n > 1), reaching a maximum, and a decrease with increasing time.
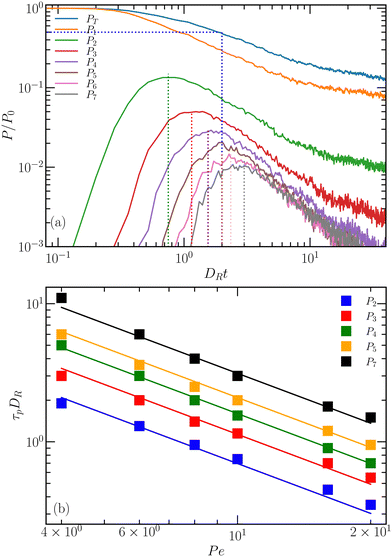 | ||
| Fig. 14 (a) Temporal evolution of the cluster concentrations Pi as a function of time for the vision angle θ = π/2 and activity Pe = 10. PT is the total concentration. (b) Characteristic times of the maxima of Pi(t) as a function of Pe. The fitted line corresponds to eqn (17), whereas the squares represents simulation results. | ||
The characteristic time τp(n), where Pn(t) assumes its maximum, is presented in Fig. 14(b) for various cluster sizes and Pe. The time τp increase with increasing n and decreases with increasing Pe, where the data sets are well described by the relation τpDR ∼ (n/Pe)κ, with κ = 6/5. In addition, τp depends on and vision angle θ (ESI†). Overall, the maximum time is well described by the expression
| τp(n)DR = 5.5(n/Pe)κθ−κ/4. | (17) |
Theoretical calculations for short-range attractive passive colloids based on the Smoluchowski equation with a constant kernel (cluster-size-independent rate constant) predict the asymptotic behavior P(n, t) ∼ 1/t2 for t → ∞.42 Moreover, the time at the maximum of P(n, t = τp), τp ∼ n, increases linearly with n. This is distinct from our simulations, with P(n, t) ∼ 1/t over a certain time regime, at least for n > 2, and the super-linear increase of τp with n (eqn (17)). Hence, the clustering dynamics with activity differs strongly from that of passive short-range attractive colloids.
Our simulation results for the cluster growth can be interpreted as follows. First, at short times and small cluster sizes, the rate of cluster formation is strongly increased by visual perception and self-propulsion compared to passive aggregating particles, as directed motion is obviously much faster than random-walk-like diffusion. The dominance of active ballistic motion in the time regime 1 < DRt < 10 can be inferred from the Pe dependence of τp in eqn (17); for κ ≃ 1, τp(n)DR ∼ (n/Pe) ∼ (nDT/σv0), so that τp(n)v0/σ ∼ n (note that DT/(σ2DR) = 1/8 = const. in our model). Thus, the relevant time scale for the peak times for cluster of size n is not the diffusion coefficient 1/DR, but the time σ/v0 by active motion. Second, the peak times τp(n) decrease with increasing vision angle (eqn (17)), because particles can find and join existing (small) clusters the easier the more particles are within the vision cone. Third, this behavior changes at longer times, DRt > 10, as particles at the cluster boundary are pointing toward the cluster center, thereby stabilizing clusters, and also cluster distances increase, so that their separation becomes larger than the vision range. Fourth, it seems likely that in this long-time regime, cluster collisions are diffusion limited, similarly as for passive colloidal systems, however with an active diffusion coefficient. Our simulations result in Fig. 12(b) show that this long-time translational diffusion coefficient DA scales as 1/n with the cluster size n. Finally, the scaling behavior of cluster growth can be obtained from a description by an effective Smoluchowski equation. For any kernel K, which is a homogeneous function of the form K(qi, qj) = qλK(i, j), the asymptotic behavior can be derived from a scaling ansatz;54,55 for λ <1, this implies that the average cluster size grows with a power law tz, with z = 1/(1 − λ). This kernel is the product of cluster diffusion and the merging rate upon cluster collision, where the diffusion coefficient is proportional to 1/n. More difficult to estimate is the size dependence of the collision and merging process; this can either increase with n (because larger clusters have a larger scattering cross section) or decrease with n (because particle reorientation at the collision interface, which initiates merging, might occur less frequently for larger clusters). For a growth process with diffusion and size-independent cluster collisions and mergers, λ = −1 and thus z = 1/2, which clearly overestimates the long-time average cluster growth compared to the numerical results in Fig. 13(a). On the other hand, the simulation result z = 1/4 requires λ = −3, which corresponds to a merging process which scales as 1/n2, i.e., which becomes less efficient for larger n. Thus, it will be important to study and unravel the collision and merging process in more detail in the future, specifically for long times.
6 Summary and conclusions
We have studied structure formation in systems of intelligent active Brownian particles, adopting the cognitive flocking model of ref. 39. We have systematically varied the maneuverability strength, the vision angle and vision cutoff radius, and the ABP activity. We find distinct phases, such as a dilute fluid, aggregates, worms, worm-aggregate coexistence, hexagonally closed packed structures (HCP), and a diffuse clusters phase, depending upon the above parameters. We established phase diagrams for various packing fractions, illustrating the emergent phases.Larger vision angles, θ, lead to a larger number of sensed particles and a stronger response. Correspondingly, the system is in a dilute, fluid-like phase at lower θ, and at large angles dense, hexagonally close-packed structures appear. In-between, dependent on the maneuverability strength, additional phases emerge, which have not been found in previous studies, specifically the coexistence of worms and aggregates.
The analysis of the iABP dynamics shows, in the dilute and worm phase, mean-square displacements identical with those of an individual ABP for the considered packing fractions Φ ≤ 0.16. The long-time active diffusion coefficient, DA, decreases with increasing vision angle, and in the HCP phase, DA ∼ 1/N, where N is the number of particles in the cluster. Here, the iABP move together in a diffusive manner.
Starting from a homogeneous and isotropic system for the (large) vision angle θ = π/2, the iABPs begin to nucleate and to form clusters, which merge in the course of time. Our analysis of the temporal evolution of the average cluster size, C(t) ∼ tzk, reveals two power-law regimes with characteristic short-, z1, and long-time, z2, exponents. The exponent z1 ∼ Pe4/5θ1/5 strongly depends on activity and the vision angle, whereas z2 = 1/4 is independent of Pe. The analysis of the temporal evolution of the cluster concentration, Pn, yields the power-law dependence τp(n)DR = 5.5(n/Pe)κθ−κ/4, with κ = 6/5 for the characteristic time, where Pn assumes a maximum. The exponent κ is larger than that obtain in calculations of short-range attractive passive colloids, where τp ∼ n, or κ = 1.42 Hence, the implemented perception rule slows down clustering and cohesion at large clusters. Our considerations show that active processes can lead to an aggregation process, which is distinct from that of passive systems.
Moreover, aggregation depends on the underlying active process. The considerations in ref. 56 for ballistic and diffusive active motion of clusters yield the time dependencies t1 and t1/2, respectively, for cluster growth in two dimensions at long times. Compared to these, the exponent z2 = 1/4 suggests a much slower cluster growth for the considered vision-based active system.
Inertia effects can play a significant role in the structure formation of active systems.57,58 This is also reflected in our simulations with “slightly” underdamped equations of motion. Despite a large friction coefficient and a crossover in the mean-square displacement from the short-time passive ballistic motion to the over-damped diffusive motion at 〈r2〉/σ2 ≈ 10−3, a fraction of a colloid diameter, the phase boundary are somewhat shifted, compared to a fully overdamped dynamics.
We have considered a minimal model of iABPs, with vision-based input and limited maneuverability, which serves as a basis for various possible future extensions to more specific or advanced cognitive processes. In particular, multiple input channels complemented by a complex decision process and response can be designed, for which we expect other collective dynamical features and means to control the emerging structures and collective dynamics.
Conflicts of interest
There is no conflict of interest.Notes and references
- M. Ballerini, N. Cabibbo, R. Candelier, A. Cavagna, E. Cisbani, I. Giardina, V. Lecomte, A. Orlandi, G. Parisi, A. Procaccini, M. Viale and V. Zdravkovic, Proc. Natl. Acad. Sci. U. S. A., 2008, 105, 1232 CrossRef CAS PubMed.
- S. Ramaswamy, Annu. Rev. Cond. Mat. Phys., 2010, 1, 323 CrossRef.
- E. Lauga and T. R. Powers, Rep. Prog. Phys., 2009, 72, 096601 CrossRef.
- J. Elgeti, R. G. Winkler and G. Gompper, Rep. Prog. Phys., 2015, 78, 056601 CrossRef CAS PubMed.
- M. R. Shaebani, A. Wysocki, R. G. Winkler, G. Gompper and H. Rieger, Nat. Rev. Phys., 2020, 2, 181 CrossRef.
- G. Gompper, R. G. Winkler, T. Speck, A. Solon, C. Nardini, F. Peruani, H. Löwen, R. Golestanian, U. B. Kaupp, L. Alvarez, T. Kiørboe, E. Lauga, W. C. K. Poon, A. DeSimone, S. Muiños-Landin, A. Fischer, N. A. Söker, F. Cichos, R. Kapral, P. Gaspard, M. Ripoll, F. Sagues, A. Doostmohammadi, J. M. Yeomans, I. S. Aranson, C. Bechinger, H. Stark, C. K. Hemelrijk, F. J. Nedelec, T. Sarkar, T. Aryaksama, M. Lacroix, G. Duclos, V. Yashunsky, P. Silberzan, M. Arroyo and S. Kale, J. Phys: Condens. Matter, 2020, 32, 193001 CrossRef CAS PubMed.
- A. C. Tsang, E. Demir, Y. Ding and O. S. Pak, Advanced Intelligent Systems, 2020, 2, 1900137 CrossRef.
- Y. Fily and M. C. Marchetti, Phys. Rev. Lett., 2012, 108, 235702 CrossRef PubMed.
- J. Bialké, T. Speck and H. Löwen, Phys. Rev. Lett., 2012, 108, 168301 CrossRef PubMed.
- G. S. Redner, M. F. Hagan and A. Baskaran, Phys. Rev. Lett., 2013, 110, 055701 CrossRef PubMed.
- A. Wysocki, R. G. Winkler and G. Gompper, EPL, 2014, 105, 48004 CrossRef.
- M. E. Cates and J. Tailleur, Annu. Rev. Condens. Matter Phys., 2015, 6, 219 CrossRef CAS.
- M. C. Marchetti, Y. Fily, S. Henkes, A. Patch and D. Yllanes, Curr. Opin. Colloid Interface Sci., 2016, 21, 34 CrossRef CAS.
- C. Bechinger, R. Di Leonardo, H. Löwen, C. Reichhardt, G. Volpe and G. Volpe, Rev. Mod. Phys., 2016, 88, 045006 CrossRef.
- P. Digregorio, D. Levis, A. Suma, L. F. Cugliandolo, G. Gonnella and I. Pagonabarraga, Phys. Rev. Lett., 2018, 121, 098003 CrossRef CAS PubMed.
- I. Theurkauff, C. Cottin-Bizonne, J. Palacci, C. Ybert and L. Bocquet, Phys. Rev. Lett., 2012, 108, 268303 CrossRef CAS PubMed.
- S. Thutupalli, R. Seemann and S. Herminghaus, New J. Phys., 2011, 13, 073021 CrossRef.
- J. Palacci, S. Sacanna, A. P. Steinberg, D. J. Pine and P. M. Chaikin, Science, 2013, 339, 936 CrossRef CAS PubMed.
- I. Buttinoni, J. Bialké, F. Kümmel, H. Löwen, C. Bechinger and T. Speck, Phys. Rev. Lett., 2013, 110, 238301 CrossRef PubMed.
- R. Matas-Navarro, R. Golestanian, T. B. Liverpool and S. M. Fielding, Phys. Rev. E, 2014, 90, 032304 CrossRef PubMed.
- M. Theers, E. Westphal, K. Qi, R. G. Winkler and G. Gompper, Soft Matter, 2018, 14, 8590 RSC.
- T. Ishikawa and T. J. Pedley, Phys. Rev. Lett., 2008, 100, 088103 CrossRef PubMed.
- F. Alarcón and I. Pagonabarraga, J. Mol. Liq., 2013, 185, 56 CrossRef.
- K. Kyoya, D. Matsunaga, Y. Imai, T. Omori and T. Ishikawa, Phys. Rev. E, 2015, 92, 063027 CrossRef CAS PubMed.
- F. Alarcón, C. Valeriani and I. Pagonabarraga, Soft Matter, 2017, 13, 814 RSC.
- N. Yoshinaga and T. B. Liverpool, Phys. Rev. E, 2017, 96, 020603 CrossRef.
- K. Qi, E. Westphal, G. Gompper and R. G. Winkler, Commun. Phys., 2022, 5, 49 CrossRef.
- M. Ballerini, N. Cabibbo, R. Candelier, A. Cavagna, E. Cisbani, I. Giardina, A. Orlandi, G. Parisi, A. Procaccini, M. Viale and V. Zdravkovic, Anim. Behav., 2008, 76, 201–215 CrossRef.
- A. Cavagna and I. Giardina, Annu. Rev. Condens. Matter Phys., 2014, 5, 183 CrossRef CAS.
- D. Pearce, A. M. Miller, G. Rowlands and M. S. Turner, Proc. Natl. Acad. Sci. U. S. A., 2014, 111, 10422 CrossRef CAS PubMed.
- T. Vicsek, A. Czirók, E. Ben-Jacob, I. Cohen and O. Shochet, Phys. Rev. Lett., 1995, 75, 1226 CrossRef CAS PubMed.
- F. Ginelli, F. Peruani, M. Bär and H. Chaté, Phys. Rev. Lett., 2010, 104, 184502 CrossRef PubMed.
- F. Ginelli, Eur. Phys. J. Spec. Top., 2016, 225, 2099 CrossRef.
- H. Chaté, Annu. Rev. Condens. Matter Phys., 2020, 11, 189 CrossRef.
- J. Toner and Y. Tu, Phys. Rev. Lett., 1995, 75, 4326 CrossRef CAS PubMed.
- J. Toner and Y. Tu, Phys. Rev. E, 1998, 58, 4828 CrossRef CAS.
- P. Romanczuk, I. D. Couzin and L. Schimansky-Geier, Phys. Rev. Lett., 2009, 102, 010602 CrossRef PubMed.
- E. Ferrante, A. E. Turgut, M. Dorigo and C. Huepe, Phys. Rev. Lett., 2013, 111, 268302 CrossRef PubMed.
- L. Barberis and F. Peruani, Phys. Rev. Lett., 2016, 117, 248001 CrossRef PubMed.
- R. Bastien and P. Romanczuk, Sci. Adv., 2020, 6, eaay0792 CrossRef PubMed.
- R. Soto and R. Golestanian, Phys. Rev. Lett., 2014, 112, 068301 CrossRef PubMed.
- D. F. Evans and H. Wennerström, The colloidal domain: where physics, chemistry, biology, and technology meet, Wiley-Vch, New York, 1999 Search PubMed.
- S. Das, G. Gompper and R. G. Winkler, New Journal of Physics, 2018, 20, 015001 CrossRef.
- N. Grønbech-Jensen and O. Farago, Molecular Physics, 2013, 111, 983–991 CrossRef.
- S. Mandal, B. Liebchen and H. Löwen, Phys. Rev. Lett., 2019, 123, 228001 CrossRef CAS PubMed.
- M. Theers, E. Westphal, K. Qi, R. G. Winkler and G. Gompper, Soft Matter, 2018, 14, 8590–8603 RSC.
- M. P. Allen and D. J. Tildesley, Computer simulation of liquids, Oxford university press, 2017 Search PubMed.
- F. Peruani, A. Deutsch and M. Bär, Phys. Rev. E, 2006, 74, 030904 CrossRef PubMed.
- D. Levis and L. Berthier, Phys. Rev. E, 2014, 89, 062301 CrossRef PubMed.
- A. Wysocki, R. G. Winkler and G. Gompper, EPL (Europhysics Letters), 2014, 105, 48004 CrossRef.
- J. R. Howse, R. A. L. Jones, A. J. Ryan, T. Gough, R. Vafabakhsh and R. Golestanian, Phys. Rev. Lett., 2007, 99, 048102 CrossRef PubMed.
- T. Eisenstecken, G. Gompper and R. G. Winkler, Polymers, 2016, 8, 304 CrossRef PubMed.
- P. J. Steinhardt, D. R. Nelson and M. Ronchetti, Phys. Rev. B, 1983, 28, 784 CrossRef CAS.
- P. G. J. van Dongen and M. H. Ernst, Phys. Rev. Lett., 1985, 54, 1396–1399 CrossRef CAS PubMed.
- S. Rode, J. Elgeti and G. Gompper, Soft Matter, 2020, 16, 10548–10557 RSC.
- P. Cremer and H. Löwen, Phys. Rev. E, 2014, 89, 022307 CrossRef PubMed.
- S. Das, G. Gompper and R. G. Winkler, Sci. Rep., 2019, 9, 6608 CrossRef PubMed.
- H. Löwen, J. Chem. Phys., 2020, 152, 040901 CrossRef PubMed.
Footnote |
| † Electronic supplementary information (ESI) available. See DOI: https://doi.org/10.1039/d2sm00736c |
| This journal is © The Royal Society of Chemistry 2022 |

