 Open Access Article
A hydro-thermophoretic trap for microparticles near a gold-coated substrate†
Gokul
Nalupurackal
a,
M.
Gunaseelan
 a,
Srestha
Roy
a,
Muruga
Lokesh
a,
Sumeet
Kumar
a,
Rahul
Vaippully
a,
Rajesh
Singh
a,
Srestha
Roy
a,
Muruga
Lokesh
a,
Sumeet
Kumar
a,
Rahul
Vaippully
a,
Rajesh
Singh
 *b and
Basudev
Roy
 *a
*a
aDepartment of Physics, Quantum Centres in Diamond and Emergent Materials (QuCenDiEM)-group, Micro Nano and Bio-Fluidics (MNBF)-Group, IIT Madras, Chennai 600036, India. E-mail: basudev@iitm.ac.in
bDepartment of Physics, IIT Madras, Chennai 600036, India. E-mail: rsingh@iitm.ac.in
First published on 30th August 2022
Abstract
Optical tweezers have revolutionised micromanipulation from physics and biology to material science. However, the high laser power involved in optical trapping can damage biological samples. In this context, indirect trapping of microparticles and objects using fluid flow fields has assumed great importance. It has recently been shown that cells and particles can be turned in the pitch sense by opto-plasmonic heating of a gold surface constituting one side of a sample chamber. We extend that work to place two such hotspots in close proximity to each other to form a very unique configuration of flow fields forming an effective quasi-three-dimensional ‘trap’, assisted by thermophoresis. This is effectively a harmonic trap confining particles in all three dimensions without relying on other factors to confine the particles close to the surface. We use this to show indirect trapping of different types of upconverting particles and cells, and also show that we can approach a trap stiffness of 40 fN μm−1 indicating a weak confinement regime without relying on feedback.
I. Introduction
The manipulation of micrometer-sized particles, particularly their high-precision positioning and confinement, remains an active area of research with many applications in physics, biology and materials sciences. Examples of the strategies utilised to confine microparticles are optical,1–5 magnetic,6–8 electrokinetic,9,10 acoustic,11 thermophoretic,12 and thermocapillary.13 However, some of these techniques are limited by the necessity of special material properties of the confined objects or the environment. To overcome this limitation, hydrodynamic trapping has been successfully utilized, and is becoming particularly attractive for the life sciences, but the optical control remains limited. Current hydrodynamic trapping strategies can be categorized into contact-based methods,14,15 where dissolved particles are immobilized against either walls, wells, posts or other obstacles by fluid flow, and non-contact based methods, where particles can be confined in stagnation-point flows,16,17 microvortices18 or microeddies.19Even though current hydrodynamic trapping methods pose reduced constraints on the material properties of the confined particle,20 high-precision manipulation of particles requires the use of extremely precise and stable microfluidic pumps and accessories. Moreover, these methods cannot be used to generate flows locally in closed chambers, being global, typically ranging between pumps and outlets rendering the spatial resolution of such techniques much lower than many optical technologies. Active feedback-based techniques have also been used to confine locally, for example with thermo-viscous flows.16,17 However, such methods can only confine microparticles in two-dimensions.
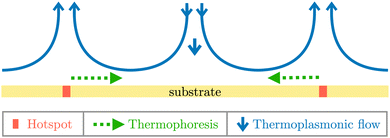
In this paper, we present a new method to create a quasi three-dimensional (3D) trap for microparticles from the combined effects of thermophoresis21–23 and hydrodynamics (thermoplasmonic flows24–26 generated by two heated spots on a gold-coated substrate). The hotspots are heated by illumination with infra-red lasers, which induce thermoplasmonic convection currents. When two such hotspots are placed close to each other, the advection of a particle by thermoplasmonic flow confines it near the substrate and along the line joining the hotspots. See Fig. 1 for a schematic and Section 3.3 for a detailed description. The confinement along the line joining the traps is by opposing thermophoretic forces due to each hotspot. These two effects combine to form a quasi-3D hydro-thermophoretic trap. We show that this trap can confine upconverting particles of various sizes and Dictyostelium cells in quasi-3D. We also find that these particles continue to rotate in the out-of-plane sense, thereby implying that these are not resting on the substrate. We can move the set of hotspots which then moves the trap and relocates the confined particle. We also show that we can control the location of the confinement along the line joining the two hotspots by tuning the power of the two lasers. This hydro-thermophoretic trap confines in full three dimensions without relying on any global fluid flows through microfluidic pumps, etc. Our strategy is different from that employed in some thermophoretic trapping schemes,23,27–31 which have much thinner sample chambers, and the actual confinement is only two-dimensional.
The thermoplasmonic flow that develops as a consequence of heating of a gold substrate, as shown in Fig. 1, is well-known.24–26,32 It can also be envisaged that these flows generate a saddle point in the middle of two such hotspots. However, we show how to obtain a three-dimensional stable fixed point with assistance from thermophoresis and thermoplasmonic flows. Such an indirect quasi-3D confinement has never been observed before. We describe this in detail below.
The organization of the rest of the paper is as follows. In Section 2, we describe the experimental set-up used to create a quasi-3D trap for microparticles. Section 3 contains details of our experimental and theoretical results. This section also rationalizes the mechanism for quasi-3D trapping upconverting particles of various sizes and Dictyostelium cells. We conclude in Section 4 by summarising our results and suggesting directions for future work (Fig. 2).
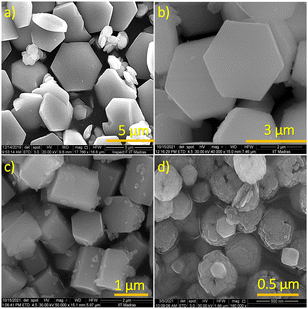 | ||
| Fig. 2 FESEM images of upconverting particles with diagonal lengths (a) 5 μm, (b) 3 μm, (c) 1.5 μm and (d) 500 nm. | ||
II. Experimental system
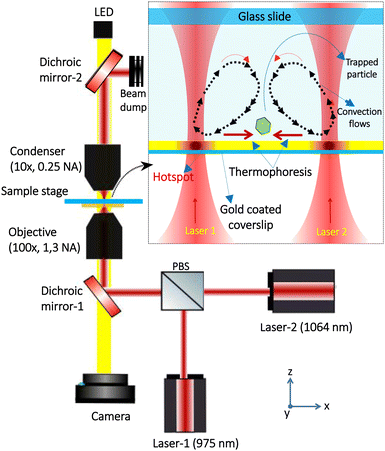
The experiments were carried out using an optical tweezers setup (OTKB/M, Thorlabs, USA) in an inverted-microscope configuration, as shown in Fig. 3. The objective lens is a 100×, oil-immersion type with 1.3 Numerical Aperture (N.A.) from Olympus while the condenser is E plan 10× with 0.25 N.A. (air-immersion) from Nikon. A diode laser with a wavelength of 1064 nm (Lasever, 1.5 W maximum power) and a butterfly laser with a wavelength of 975 nm (Thorlabs, USA, 300 mW maximum power) were employed for the experiments. The power readings were made at the sample chamber in the experiment by using a power meter (PM100D, Thorlabs). The lasers are directed into the sample chamber through the Dichroic Mirror 1, after passing via a polarizing beam splitter. An LED is used to illuminate the sample chamber through Dichroic mirror 2 and eventually the visible light is collected by a CMOS camera through dichroic mirror 2 (Thorlabs, USA). The sample is prepared by dispersing the particles or cells in water, 20 μl of which is transferred to the sample chamber using a micro-pipette. The sample chamber consists of a glass slide of size 75 mm × 25 mm × 1.1 mm (Blue star, number 1 size, English glass), on the top of which, the sample is mounted with a gold-coated glass coverslip (Blue star, number 1 size, English glass). A thin film of gold having a thickness of 30 μm is coated on the glass coverslip of thickness 170 μm. The whole system is then inverted and put on the sample stage (Thorlabs Nanomax 300 – piezoelectric stage) so that the gold layer comes in direct contact with the sample, as shown in Fig. 3.A. Preparation of gold coating
For making the gold film layer, the glass substrate was cleansed in an ultrasonic bath with acetone, IPA, and de-ionized water for 5 minutes each, and dried with nitrogen. To improve the adhesion of the gold, 5 nm of chromium was first evaporated onto the substrate at a rate of 0.05 nm s−1, followed by 30 nm gold evaporation at 0.1 nm s−1. A quartz crystal monitor was used to check the thickness of the deposition while the pressure in the evaporation chamber was maintained at 1 nbar throughout the process.B. Preparation of upconverting particles
The upconverting particles used in the experiment are all prepared by the basic hydrothermal method. Preparation of 5 μm particles is already reported in ref. 33. The particles with diagonal lengths 3 μm, 1.5 μm and 500 nm are iron co-doped upconverting particles.34In order to prepare the hexagonal particles with diagonal length of 3 μm (NaYF4:Er,Tb, 15 at% of Fe), 0.126 M yttrium nitrate (Y(NO3)3, 63 at% of Y) and 0.3 M of sodium citrate (Na3C6H5O7) were mixed with 14 ml of water and stirred vigorously for 15 minutes. To this solution, 40 mM ytterbium nitrate (Yb(NO3)3, 20 at% of Yb), 4 mM erbium nitrate (Er(NO3)3, 2 at% of Er) and 30 mM ferric nitrate (Fe(NO3) 3, 15 at% Fe) in 21 ml of water were added, resulting in a milky white solution. This solution is then turned into transparent by adding 0.5 M of Sodium Fluoride (NaF) in 67 ml water. Magnetic stirring is continued for 1 hour. The transparent solution is then transferred into a 200 ml autoclave (Teflon lined) and sealed tightly. This is then heated in a muffle furnace at 200 °C for 12 hours. After allowing to cool down to room temperature, this solution is then washed with water and ethanol four times and dried at 100 °C. The sample in powdery form is obtained after the drying process.
The particles of diagonal length 1.5 μm (NaYF4:Er,Tb, 30 at% of Fe) were also prepared by the same protocol, except with optimisations in the concentrations of Ferric Nitrate and Yttrium Nitrate to 0.06 M and 0.096 M, respectively.
C. Preparation of Dictyostelium cells
The Dictyostelium cells (wild type D. Discoideum AX2) were prepared by inoculating the spores in 90 mm tissue culture plates containing axenic HL5 growth medium (HLG01XX – Formedium, Norfolk, UK, pH 6.4) supplemented with penicillin (100 units per ml) and streptomycin sulphate (100 mg ml−1). The cultures were then incubated at 22 °C until semi-confluent plates were obtained. The mid-log cells were collected in ice cold KK2 buffer (2.2 g l−1 KH2PO4 and 0.7 g l−1 K2HPO4, pH 6.4), washed twice and stored on ice for further experiments.D. Estimation of temperature at the hotspots
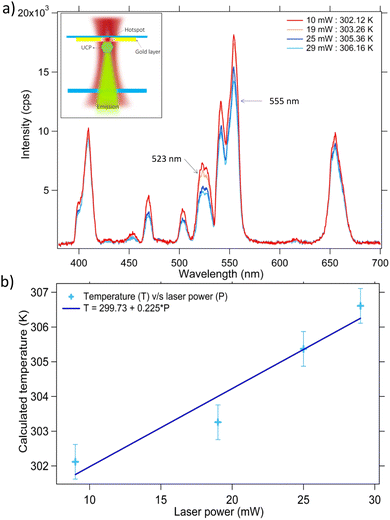
The temperature measurements at the hotspots on gold are carried out by high-sensitivity upconversion luminescence thermometry.35–39 Here, we exploit the temperature dependent fluorescence properties of the upconversion particles when excited with NIR radiation (975 nm in our case). We use NaYF4:Er3+,Yb3+ upconversion particles as contactless nano-thermometers. These particles are well-known for their broad working-temperature range38 (298–393 K) coupled with a decent sensitivity. The particles exhibit the characteristic transitions in Er ions as 2H11/2 → 4I15/2 (517–527 nm, green), 4S3/2 → 4I15/2 (535–560 nm, green), and 4F9/2 → 4I15/2 (640–680 nm, red) prominent fluorescence bands.37 Such an upconversion particle is illuminated with a laser of wavelength 975 nm just below the gold surface, as shown in Fig. 4(a), and the emission from the particle in the back-scattered direction is collected using a spectrometer (Research India).Since the particle is held close to the gold surface, the area on which the laser falls serves as the hotspot in this configuration. The localized surface plasmonic heating on the gold substrate caused by the laser irradiation significantly increases the temperature of its surroundings which in turn induces the convection flows. This temperature change is being sensed by the particle in its emission spectra, as shown in Fig. 4(a). We exploit the strong temperature dependence of spectral lines centered at 523 nm and 555 nm for the approximate estimation of the local temperature. The fluorescence intensity ratio (FIR) of the particle is given by,36
 | (1) |
 | (2) |
 | (3) |
The temperature sensitivity of NaYF4:Er3+,Yb3+ particles that we used is calculated to be 4.97% K−1. The temperature at the hotspot at any incident laser power can be found from the linear relationship between them, as shown in Fig. 4(b).
E. The experiment
The laser beams (namely, laser-1 (975 nm) and laser-2 (1064 nm)) are focused on this gold film at optimum powers to generate the two hotspots (H1 and H2, respectively). The hotspots are displaced in the x-direction by a separation of 14 μm to create the hydro-thermophoretic trap for a hexagonal shaped upconverting particle of diagonal length 5 μm. The laser power at both the hotspots is optimised until the particle gets confined at the middle region. The separation between the hotspots is reduced to 9 μm and 6 μm to trap smaller hexagonal shaped upconverting particles having diagonal lengths of 3 μm and 1.5 μm, respectively. The powers of both lasers were adjusted simultaneously to observe the dynamics of the particles in the generated hydro-thermophoretic trap. Furthermore, the hotspots H1 and H2 are moved 20 μm apart to trap Dictyostelium cells and the subsequent spores. We use the MTrack plug-in of ImageJ software to determine the position of the centroid of the trapped particle as a function of time.III. Results and discussion
In this section, we describe our main experimental and theoretical results.A. Quasi-3D trapping upconverting particles
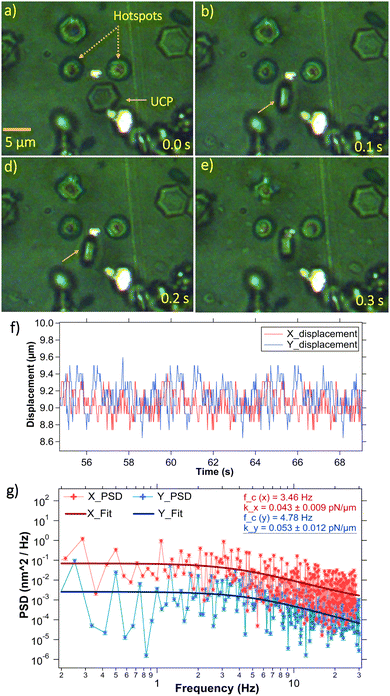
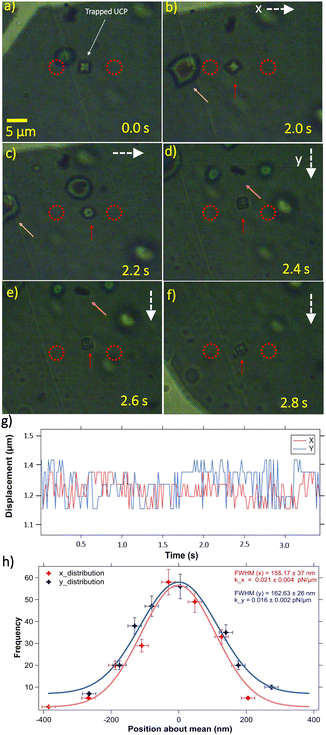
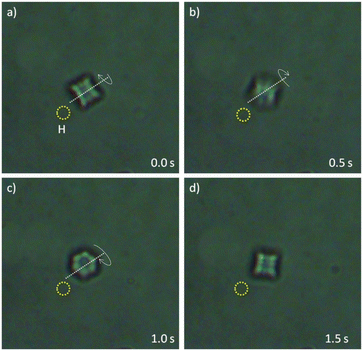
We find that particles and cells having different structural morphologies and sizes get confined three dimensionally at an equilibrium position between the two hotspots. A hexagonal shaped upconverting particle of diagonal length 5 μm is trapped at a distance of 6 μm from each hotspot, as shown in Fig. 5(a). The powers of the laser beams at hotspots H1 and H2 were recorded to be 9 mW and 8.7 mW, respectively, and the estimated temperature at each hotspot is 302.6 K (ΔT = 4.6 K).The particle is spatially confined in all three dimensions but also observed to be executing different out-of-plane rotations, namely roll34 and pitch40–43 due to the thermoplasmonic fluid flow. It is not exactly clear why the particle executes this rotation but it could arise from minor differences in fluid velocities in the local neighborhood of the equilibrium location. We use the M-track plug-in of ImageJ software to generate the x and y – displacement time series, as shown in Fig. 5(f).
The power spectrum obtained from the same time-series is fitted with a Lorentzian curve and calibrated.44 The trap-stiffnesses are calculated in both the x and y directions (see Fig. 5(g)). Hence, it is observable that our indirect hydro-thermophoretic trap behaves remarkably similar to a conventional harmonic optical trap,45 without relying on particle's refractive index and size.
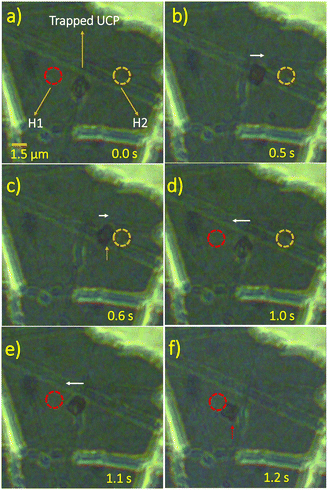
We also trap 3 μm and 1.5 μm sized hexagonal shaped upconverting particles to test the applicability of our trap on smaller particles. Both 3 μm and 1.5 μm sized particles get confined in three dimensions, between the hotspots, as shown in Fig. 6(a) and 8(a), respectively. We observe that a 3 μm sized trapped particle follows the trap when we displace the set of hotspots on the gold substrate at a speed of 2.2 μm s−1 in the x-direction as well as at 1.8 μm s−1 in the y-direction (see Fig. 6(b)–(f)). The laser powers were set to be 11 mW and 10 mW at hotspots H1 and H2 respectively. And from Fig. 4(b), the estimated temperature at the hotspots is 303.6 K (ΔT = 5.6 K). The yellow arrows marked in the figures are taken as references to illustrate the effect.
The centroid position of the trapped particle is then tracked to generate a displacement time series. The spatial distributions of the particle in the x and y directions obtained from the time series are fitted with a Gaussian curve, as shown in Fig. 6(g)–(h). The trap stiffness is calculated from the same Gaussian fit (Fig. 6(h)).
B. Tunability of the center of the quasi-3D trap
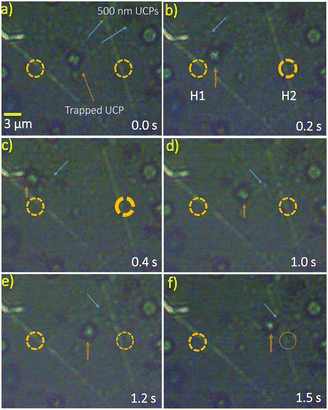
We also observe that a 1.5 μm sized confined particle follows the same trap properties. In order to illustrate the effect of confinement by the set of hotspots, we turn off one of the lasers. The particle displaces close to the on hotspot when we turn off the other laser, as shown in Fig. 8(b), (c) and (e), (f). It can be seen that the particle executes pitch rotational motion near individual hotspots H1 and H2 as already reported (Fig. 7).46 It is brought back to the initial hydro-thermophoretic trap by turning the laser (laser-1) at the hotspot (H1) on, as shown in Fig. 8(d).We then direct our attention to the spatial tunability of the hydro-thermophoretic trap along the line joining the hotspots. We trap a 3 μm particle and a cluster of 500 nm sized upconverting particles, as shown in Fig. 9(a). We observe that the trapped particles move towards the hotspot H1, when the laser power at the hotspot H2 is increased from 6 mW to 9 mW, that is, from T = 300.2 K to 302.6 K (see Fig. 9(b) and (c)). These regain their initial positions when the power is brought back to 6 mW after a finite time interval. The trapped particles also show a similar response in the opposite direction when the laser power at hotspot H1 is increased, keeping the power at H2 constant or when the laser power at H2 is reduced further to 1 mW.
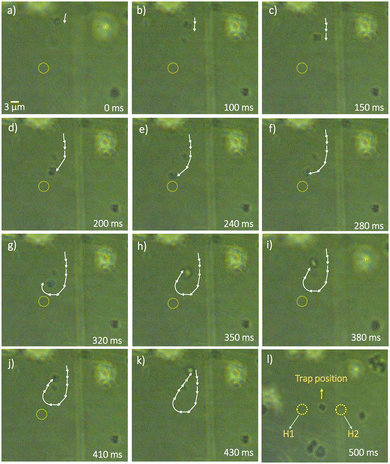 | ||
| Fig. 10 The strong planar convection flows that are being followed by a 3 μm sized particle near to the laser hotspot. The particle comes to the trap position when the laser powers are matched as shown in (l). The position of the particle is tracked and shown in Fig. 11(c). | ||
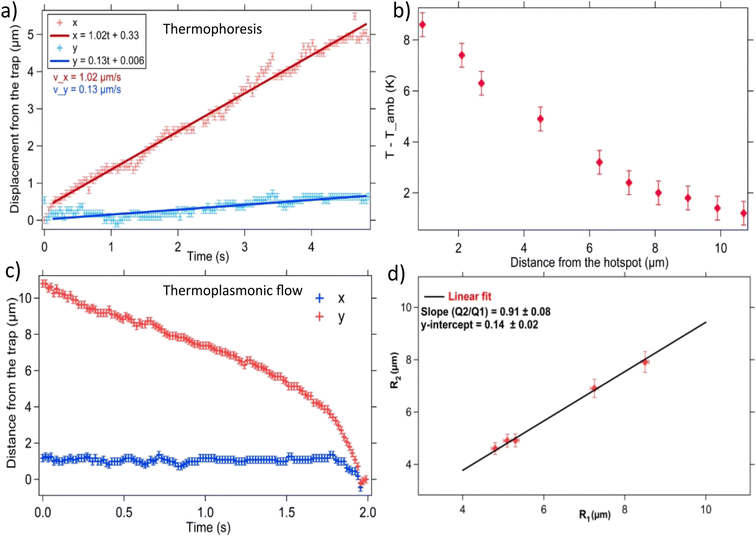 | ||
Fig. 11 (a) The thermophoretic migration of a 3 μm sized upconversion particle shown in Fig. 9. The thermophoretic velocities are found to be, vx = 1.02 ± 0.21 μm s−1 and vy = 0.13 ± 0.04 μm s−1. (b). The temperature sensed by a 3 μm sized upconversion particle as a function of distance from the hotspot is plotted. (c) The displacement-time graph of an upconversion particle which follows the thermoplasmonic fluid flow near the hotspot is shown (see Fig. 10). In (d), the graph plotted between the distances R1 and R2 (obtained by varying the laser powers at the hotspots H1 and H2), along with the best linear fit. The slope gives the ratio of the square root of the laser power,  (kept at 0.86 ± 0.09 in experiments). This is in excellent agreement with eqn (9). (kept at 0.86 ± 0.09 in experiments). This is in excellent agreement with eqn (9). | ||
C. Mechanism of hydro-thermophoretic trapping
We now present the theory describing the formation of a quasi-3D hydro-thermophoretic trap for microparticles. We show that it is possible to trap microparticles through a combination of thermophoresis and hydrodynamics (thermoplasmonic fluid flows). Both these effects are caused by the laser heating of the gold-coated substrate, as we describe below. We first describe the “hydro” part of the mechanism by studying the thermoplasmonic fluid flows.| −∇p + η∇2v + fT = 0 | (4) |
| v = 0 at the walls. | (5) |
The fluid flow is driven by the plasmonic heating of the gold substrate through laser radiations of source densities qi.24–26,32 We need to obtain the force density in the fluid to obtain the fluid flow from the solution of the above equations. The force density fT = αδTẑ = α(T − T0)ẑ in the fluid is obtained from the Boussinesq approximation for buoyancy-driven natural convection24,48,49 Here α = ρβg is a material dependent constant, while ρ is fluid density, β is the thermal expansion coefficient, g is the acceleration due to gravity, T0 is the temperature of the undisturbed fluid and ẑ is the unit vector along the z-direction, away from the surface. The force density driving the fluid flow depends on the temperature profile. The temperature field, at any point on the substrate, is given by the solution of the following equation25,32
 | (6) |
 . The temperature and heat flux are continuous at the gold-coated substrate. There is a reduction of mass density around the gold-coated substrate because of heating by the laser, which yields the upward convection of the fluid driven by the force density fT, defined above. In the following, we obtain an expression for the temperature field and present a numerical computation of the flow field in the system.
| vT = −DT∇T, | (7) |
 is positive in our system, where
  is the diffusion constant. See Fig. 1 for a schematic diagram. Such thermophoretic motion of microparticles away from a hotspot was used in ref. 29 to create a two-dimensional trap on a gold substrate using a rotating temperature field. This was achieved by laser heating on the circumference of a circle. The sample chamber was very thin and ensured confinement in the third direction. In the following, we explain the mechanism to create a quasi-3D trap using the thermophoretic motion from two fixed lasers and thermoplasmonic flows created by them.
To proceed further, we need to obtain an explicit form of the temperature field T (r, t) at a point r in the bulk fluid. The explicit form of the temperature field will then be used in eqn (7) to obtain the thermophoretic velocity of a particle along the line joining the hotspots. A balance of thermophoretic velocities from the two hotspots gives the location of the center of the trap. The plasmonic excitation from laser heating gets thermalized at a time-scale of milliseconds, and thus, the temperature follows the laser field almost instantaneously. The leading order instantaneous and isotropic form of the temperature field at a point r, due to heating of the two hotspots, is given as
 | (8) |
The thermoplasmonic flow ensures that the particle finds itself along the line joining the hotspots, as described in detail below. A balance of the thermophoretic velocities due to the two hotspots gives the location of the trap center since its magnitude is higher than the fluid velocity along this direction. Here we have used the fact that the thermophoretic velocity of a particle due to the two hotspots is along the line joining the hotspots but in opposite directions (see also Fig. 1). It then follows that the ratio of the distance of the trap center from the location of the two hotspots can be given as
 | (9) |
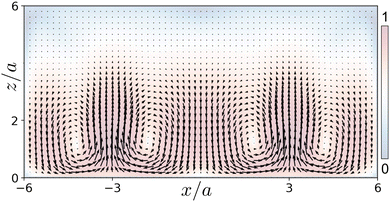
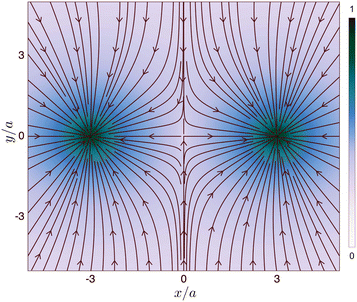
We now describe the combined effect of thermophoresis and thermoplasmonic flows using the equations given in Section 3.3.1. We consider that the gold-coated surface is in the xy-plane, such that two hotspots are along the x-axis. We then need to solve for the Stokes equation to obtain the fluid flow. This is done by using the expression for the force density in the fluid defined in Section 3.3.1, such that α = ρβg, where β = 10−4 K−1 is the thermal expansion coefficient,48 while ρ = 103 kg m−3 is the density of the fluid, and g = 9.8 m s−2 is the acceleration due to gravity. Values for the other relevant parameters are: T0 = 298 K, cp = 100 J kg−1 K−1. Using these parameters, the equations are solved using the finite element method to obtain the thermoplasmonic fluid flow. Fig. 11 contains the resulting streamlines of the fluid flow, overlaid on a pseudo color map of the flow speed, in the xz-plane due to the two hotspots along the x-axis on the gold-coated substrate. It can be seen that the heating of the gold substrate by the laser causes temperature gradients, which lead to convection flows away from the heated spot. The corresponding flow in the xy-plane, near the gold-coated surface, has been plotted in Fig. 13. From the two figures, it is clear that the flow will advect any particle in such a way that it will get pushed back to the bottom surface from the bulk due to flow in the z-direction. The flow in the y-direction will also pull the particle along the line joining the two hotspots along the x-axis. We see in our experiments that particles are trapped along this line. A particle is trapped along the line joining the hotspots due to opposing thermophoretic forces acting on it from the two hotspots (as described above). To summarise, in this section, we have shown that a combination of thermophoretic and thermoplasmonic effects can confine microparticles in quasi-3D. This is the essence of the mechanism shown in the schematic diagram of Fig. 1. The location of the trap center is determined by the competition between opposing thermophoretic forces in the plane of the substrate (see eqn (9)). We note that our comparison for the numerically computed fluid flow and dynamics observed in the experiments is only qualitative. A detailed quantitative comparison of the theoretical fluid flow and experimentally measured velocity of particles will be presented in a future work (Fig. 14).
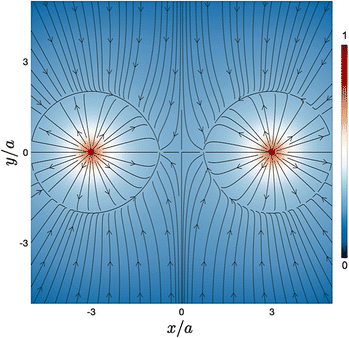 | ||
| Fig. 14 Vector plot of the velocity field experienced by a particle due to the combined effects of thermophoretic drift as well as advection by the thermoplasmonic fluid flow in the xy-plane, overlaid on the color map of flow speed normalised by its maximum, due to laser heating of the gold substrate at x = ±3a, where a is the size of the particle. The dynamics along the x-direction are dominated by thermophoresis away from the hotspot, while the dynamics in the y- and z-directions are controlled by the fluid flow (see Fig. 12). | ||
D. Quasi-3D trapping of biological samples
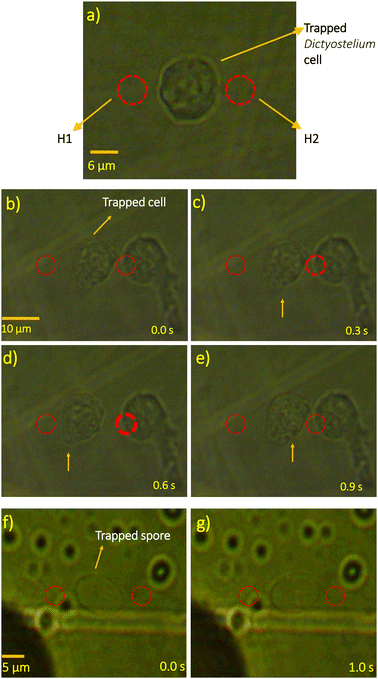
Next, we focus our attention onto trapping biological samples. We find that a 10 μm sized Dictyostelium cell also gets confined for 1 minute, as shown in Fig. 15(a). To trap the cell, we have used higher laser powers at the hotspots, 35 mW at H1 and 29 mW at H2 (ΔT ≈ 6.9 K). We also find that the trap does not cause any damage to the trapped living cell over experimental timescales (this is because the change in temperature at the location of the confined Dictyostelium cell is only about 1 °C, as shown in Fig. 11(b)) which extends the applications of our system to biological specimens. The observation of the tunability of the trap's position is also performed with the Dictyostelium cell (see Fig. 15(b)–(e)). Here, the laser power at hotspot H2 is increased and then decreased to ascertain the positional changes of the cell. Moreover, it is also possible to trap elongated biological structures with a length of 12 μm, such as spores of Dictyostelium, in quasi-3D, as shown in Fig. 15(f)–(g).IV. Conclusions and perspectives
In conclusion, we have developed a novel method that allows for the efficient quasi-three dimensional trapping of microscopic particles and living cells. We have studied the fundamental physics behind this indirect thermoplasmonic trap by exploiting the first principles of fluid mechanics. We find that the quasi-three-dimensional confinement of particles and cells between the hotspots on gold is induced by the combined effects of thermophoresis and thermoplasmonic fluid flow. The trap that we generated is well in agreement with a fundamental harmonic trap by observation, and the forces are in the order of 50 fN for a displacement of 1 μm. The size regime of the trappable particles is determined by the laser powers and the horizontal separation between them on gold. However, we have trapped particles with sizes varying from 500 nm to 5 μm and cells having a size more than 10 μm. We observe that the indirect hydro-thermophoretic trap causes considerably less damage to the living cells (the change in temperature at the location of the confined Dictyostelium cell is only about 1 °C, see Fig. 11(b), and thus, no damage occurs over experimental timescales) as compared to an optical trap, while allowing us to apply forces in the order of pico newtons to the trapped particle. The control over the thermophoretic velocities of the particles with the laser powers enables us to achieve the precise positioning of the trapped particle. Moreover, in this way, controlled roll out-of-plane rotation of the particle can also be performed. Exciting future directions include studying dynamics of synthetic and biological microparticles, which cannot be trapped using conventional methods, utilizing the hydro-thermophoretic trap introduced here.Conflicts of interest
There are no conflicts of interest to declare.Acknowledgements
We thank the Indian Institute of Technology, Madras, India for their seed and initiation grants. This work was also supported by the DBT/Wellcome Trust India Alliance Fellowship IA/I/20/1/504900 awarded to Basudev Roy.References
- A. Ashkin, J. M. Dziedzic, J. E. Bjorkholm and S. Chu, Observation of a single-beam gradient force optical trap for dielectric particles, Opt. Lett., 1986, 11, 288 CrossRef CAS PubMed.
- A. E. Wallin, H. Ojala, E. Hæggström and R. Tuma, Stiffer optical tweezers through real-time feedback control, Appl. Phys. Lett., 2008, 92, 224104 CrossRef.
- M. J. Guffey and N. F. Scherer, All-optical patterning of au nanoparticles on surfaces using optical traps, Nano Lett., 2010, 10, 4302 CrossRef CAS PubMed.
- P. Polimeno, A. Magazzu, M. A. Iati, F. Patti, R. Saija, C. D. E. Boschi, M. G. Donato, P. G. Gucciardi, P. H. Jones and G. Volpe, et al., Optical tweezers and their applications, J. Quant. Spectrosc. Radiat. Transfer, 2018, 218, 131 CrossRef CAS.
- K. C. Neuman and S. M. Block, Optical trapping, Rev. Sci. Instrum., 2004, 75, 2787 CrossRef CAS PubMed.
- T. R. Strick, J.-F. Allemand, D. Bensimon, A. Bensimon and V. Croquette, The elasticity of a single supercoiled dna molecule, Science, 1996, 271, 1835 CrossRef CAS PubMed.
- C. Gosse and V. Croquette, Magnetic tweezers: Micromanipulation and force measurement at the molecular level, Biophys. J., 2002, 82, 3314 CrossRef CAS PubMed.
- R. Sarkar and V. V. Rybenkov, A guide to magnetic tweezers and their applications, Front. Phys., 2016, 4, 48 Search PubMed.
- A. E. Cohen and W. Moerner, Method for trapping and manipulating nanoscale objects in solution, Appl. Phys. Lett., 2005, 86, 093109 CrossRef.
- M. D. Armani, S. V. Chaudhary, R. Probst and B. Shapiro, Using feedback control of microflows to independently steer multiple particles, J. Microelectromech. Syst., 2006, 15, 945 CrossRef.
- H. Hertz, Standing-wave acoustic trap for nonintrusive positioning of microparticles, J. Appl. Phys., 1995, 78, 4845 CrossRef CAS.
- M. Fränzl, T. Thalheim, J. Adler, D. Huster, J. Posseckardt, M. Mertig and F. Cichos, Thermophoretic trap for single amyloid fibril and protein aggregation studies, Nat. Methods, 2019, 16, 611 CrossRef PubMed.
- A. T. Ohta, A. Jamshidi, J. K. Valley, H.-Y. Hsu and M. C. Wu, Optically actuated thermocapillary movement of gas bubbles on an absorbing substrate, Appl. Phys. Lett., 2007, 91, 074103 CrossRef PubMed.
- D. Di Carlo, L. Y. Wu and L. P. Lee, Dynamic single cell culture array, Lab Chip, 2006, 6, 1445 RSC.
- Q. Luan, C. Macaraniag, J. Zhou and I. Papautsky, Microfluidic systems for hydrodynamic trapping of cells and clusters, Biomicrofluidics, 2020, 14, 031502 CrossRef CAS PubMed.
- M. Tanyeri, E. M. Johnson-Chavarria and C. M. Schroeder, Hydrodynamic trap for single particles and cells, Appl. Phys. Lett., 2010, 96, 224101 CrossRef PubMed.
- A. Shenoy, C. V. Rao and C. M. Schroeder, Stokes trap for multiplexed particle manipulation and assembly using fluidics, Proc. Natl. Acad. Sci. U. S. A., 2016, 113, 3976 CrossRef CAS PubMed.
- C. M. Lin, Y. S. Lai, H. P. Liu, C. Y. Chen and A. M. Wo, Trapping of bioparticles via microvortices in a microfluidic device for bioassay applications, Anal. Chem., 2008, 80, 8937 CrossRef CAS PubMed.
- B. R. Lutz, J. Chen and D. T. Schwartz, Hydrodynamic tweezers: 1. noncontact trapping of single cells using steady streaming microeddies, Anal. Chem., 2006, 78, 5429 CrossRef CAS PubMed.
- D. Kumar, A. Shenoy, J. Deutsch and C. M. Schroeder, Automation and flow control for particle manipulation, Curr. Opin. Chem. Eng., 2020, 29, 1 CrossRef.
- J. L. Anderson, Colloid transport by interfacial forces, Annu. Rev. Fluid Mech., 1989, 21, 61 CrossRef.
- A. Würger, Thermal non-equilibrium transport in colloids, Rep. Prog. Phys., 2010, 73, 126601 CrossRef.
- M. Fränzl and F. Cichos, Hydrodynamic manipulation of nano-objects by optically induced thermo-osmotic flows, Nat. Commun., 2022, 13, 1 Search PubMed.
- B. J. Roxworthy, A. M. Bhuiya, S. P. Vanka and K. C. Toussaint, Understanding and controlling plasmoninduced convection, Nat. Commun., 2014, 5, 1 Search PubMed.
- A. O. Govorov and H. H. Richardson, Generating heat with metal nanoparticles, Nano Today, 2007, 2, 30 CrossRef.
- G. Baffou, R. Quidant and F. J. García de Abajo, Nanoscale control of optical heating in complex plasmonic systems, ACS Nano, 2010, 4, 709 CrossRef CAS PubMed.
- I. D. Stoev, B. Seelbinder, E. Erben, N. Maghelli and M. Kreysing, Highly sensitive force measurements in an optically generated, harmonic hydrodynamic trap, eLight, 2021, 1, 1 CrossRef.
- U. G. Būtaitė, G. M. Gibson, Y.-L. D. Ho, M. Taverne, J. M. Taylor and D. B. Phillips, Indirect optical trapping using light driven micro-rotors for reconfigurable hydrodynamic manipulation, Nat. Commun., 2019, 10, 1 CrossRef PubMed.
- M. Braun, A. Würger and F. Cichos, Trapping of single nano-objects in dynamic temperature fields, Phys. Chem. Chem. Phys., 2014, 16, 15207 RSC.
- K. Namura, K. Nakajima and M. Suzuki, Quasi-stokeslet induced by thermoplasmonic marangoni effect around a water vapor microbubble, Sci. Rep., 2017, 7, 1 CrossRef PubMed.
- Y. T. Maeda, T. Tlusty and A. Libchaber, Effects of long dna folding and small rna stem–loop in thermophoresis, Proc. Natl. Acad. Sci. U. S. A., 2012, 109, 17972 CrossRef CAS PubMed.
- G. Baffou and R. Quidant, Thermo-plasmonics: Using metallic nanostructures as nano-sources of heat, Laser Photonics Rev., 2013, 7, 171 CrossRef CAS.
- S. Kumar, A. Kumar, M. Gunaseelan, R. Vaippully, D. Chakraborty, J. Senthilselvan and B. Roy, Trapped in out-of-equilibrium stationary state: Hot brownian motion in optically trapped upconverting nanoparticles, Front. Phys., 2020, 8, 429 Search PubMed.
- G. Nalupurackal, M. Gunaseelan, M. Lokesh, R. Vaippully, A. Chauhan, B. R. K. Nanda, C. Sudakar, H. C. Kotamarthi, A. Jannasch, E. Schffer, J. Senthilselvan and B. Roy, Simultaneous optical trapping and magnetic micromanipulation of ferromagnetic irondoped upconversion microparticles in six degrees of freedom, 2022, arXiv:2203.02152 DOI:10.48550/arXiv.2203.02152.
- K. Saidi, M. Dammak, K. Soler-Carracedo and I. R. Martín, Optical thermometry based on upconversion emissions in na3gd (vo4)2: Yb3+–Er3+/Ho3+ micro crystals, J. Alloys Compd., 2022, 891, 161993 CrossRef CAS.
- M. Runowski, S. Goderski, D. Przybylska, T. Grzyb, S. Lis and I. R. Martín, Sr2luf7: Yb3+–Ho3+–Er3+ upconverting nanoparticles as luminescent thermometers in the first, second, and third biological windows, ACS Appl. Nano Mater., 2020, 3, 6406 CrossRef CAS.
- C. D. Brites, S. Balabhadra and L. D. Carlos, Lanthanide-based thermometers: At the cutting-edge of luminescence thermometry, Adv. Opt. Mater., 2019, 7, 1801239 CrossRef.
- C. D. Brites, P. P. Lima, N. J. Silva, A. Millán, V. S. Amaral, F. Palacio and L. D. Carlos, Thermometry at the nanoscale, Nanoscale, 2012, 4, 4799 RSC.
- P. S. Solanki, S. Balabhadra, M. F. Reid, V. B. Golovko and J.-P. R. Wells, Upconversion thermometry using Yb3+/Er3+ co-doped ky3f10 nanoparticles, ACS Appl. Nano Mater., 2021, 4, 5696 CrossRef CAS.
- M. Lokesh, R. Vaippully, V. P. Bhallamudi, A. Prabhakar and B. Roy, Realization of pitch-rotational torque wrench in two-beam optical tweezers, J. Phys. Commun., 2021, 5, 115016 CrossRef PubMed.
- M. Lokesh, R. Vaippully, G. Nalupurackal, S. Roy, V. P. Bhallamudi, A. Prabhakar and B. Roy, Estimation of rolling work of adhesion at the nanoscale with soft probing using optical tweezers, RSC Adv., 2021, 11, 34636 RSC.
- R. Vaippully, V. Ramanujan, M. Gopalakrishnan, S. Bajpai and B. Roy, Detection of sub-degree angular fluctuations of the local cell membrane slope using optical tweezers, Soft Matter, 2020, 16, 7606 RSC.
- B. Roy, A. Ramaiya and E. Schäffer, Determination of pitch rotation in a spherical birefringent microparticle, J. Opt., 2018, 20, 035603 CrossRef.
- E. Schäffer, S. F. Nørrelykke and J. Howard, Surface forces and drag coefficients of microspheres near a plane surface measured with optical tweezers, Langmuir, 2007, 23, 3654 CrossRef PubMed.
- B. Lukić, S. Jeney, Ž. Sviben, A. J. Kulik, E.-L. Florin and L. Forró, Motion of a colloidal particle in an optical trap, Phys. Rev. E: Stat., Nonlinear, Soft Matter Phys., 2007, 76, 011112 CrossRef PubMed.
- S. Kumar, M. Gunaseelan, R. Vaippully, A. Kumar, M. Ajith, G. Vaidya, S. Dutta and B. Roy, Pitchrotational manipulation of single cells and particles using single-beam thermo-optical tweezers, Biomed. Opt. Express, 2020, 11, 3555 CrossRef CAS PubMed.
- L. D. Landau and E. M. Lifshitz, Fluid mechanics, Pergamon Press, New York, 1959, vol. 6 Search PubMed.
- J. S. Donner, G. Baffou, D. McCloskey and R. Quidant, Plasmon-assisted optofluidics, ACS Nano, 2011, 5, 5457 CrossRef CAS PubMed.
- J. C. Ndukaife, A. V. Kildishev, A. G. A. Nnanna, V. M. Shalaev, S. T. Wereley and A. Boltasseva, Long-range and rapid transport of individual nano-objects by a hybrid electrothermoplasmonic nanotweezer, Nat. Nanotechnol., 2016, 11, 53 CrossRef CAS PubMed.
- M. Braibanti, D. Vigolo and R. Piazza, Does thermophoretic mobility depend on particle size?, Phys. Rev. Lett., 2008, 100, 108303 CrossRef PubMed.
- R. Piazza, Thermophoresis: Moving particles with thermal gradients, Soft Matter, 2008, 4, 1740 RSC.
Footnote |
| † Electronic supplementary information (ESI) available. See DOI: https://doi.org/10.1039/d2sm00627h |
| This journal is © The Royal Society of Chemistry 2022 |

