 Open Access Article
Coupling the topological defect phase to the extrinsic curvature in nematic shells
D. J. G.
Pearce
 abcd
abcd
aDepartment of Biochemistry, University of Geneva, 1211 Geneva, Switzerland. E-mail: daniel.pearce@unige.ch
bDepartment of Theoretical Physics, University of Geneva, 1211 Geneva, Switzerland
cNCCR Chemical Biology, University of Geneva, 1211 Geneva, Switzerland
dDept. of Mathematics, Massachusetts Institute of Technology, Massachusetts, USA
First published on 6th June 2022
Abstract
In two dimensional nematics, topological defects are point like singularities with both a charge and a phase. We study the topological defects within curved nematic textures on the surface of a cylinder. This allows us to isolate the effect of extrinsic curvature on the structure of the topological defect. By minimizing the energy associated with distortions in the nematic director around the core of a defect, we show that the phase of the topological defect is coupled to the orientation of the cylinder. This coupling depends on the relative energetic cost associated with splay, bend and twist distortions of the nematic director. We identify a bistability in the phase of the defects when twist deformations dominate. Finally, we show a similar effect for integer charge topological defects.
I. Introduction
Liquid crystals are materials in which the components have a well defined orientation and are able to flow past each other like a fluid.1–3 There are many examples of liquid crystals, from technological displays to biological systems.The components of a liquid crystal are locally aligned leading to crystal-like ordering which is described by an orientation field.1–3 Topological defects are topologically protected singularities in this field in which the average orientation is not well defined.4,5 These topological defects are common in nematic phases of liquid crystals, in which the components of the liquid crystal are locally aligned but there is no macroscopic polarization.2–5 In a two dimensional liquid crystal, topological defects are point like disclinations with a typically half integer charge and a phase that is related to their orientation.6,7 The phase of neighboring defects is coupled by effective elastic torques and forces they exert on each other.6–8
When confined on a curved surface, there are additional topological and geometrical constraints on the nematic. The topology of the surface constrains the total topological charge of the defects within the nematic.9 The intrinsic curvature of the surface can raise or lower the core energy associated with a topological defect depending on its charge.10 Finally, the extrinsic curvature exerts a torque directly on the components of the liquid crystal.11,12 As a result of this, the extrinsic curvature can exert a force and a torque on topological defects within the nematic.13–15
The interactions between nematics, geometry and topology are increasingly important when considering nematics as a model for biological systems, which are rarely flat and often feature topological defects that correspond to specific geometrical features.16–21 Furthermore, living systems often feature the continuous injection of mechanical stress, which maintains the system out of equilibrium. Similar systems are referred to as active nematics, in which a defect dense state referred to as “active turbulence” is possible.22–25 By coupling the system to externally broken rotational symmetry, it is possible to observe some degree of defect ordering in active nematics.26–36
In this manuscript, we investigate how the relative strength of the elastic constants for splay, twist and bend distortions in a nematic leads to an interaction between topological defects and extrinsic curvature. We do this by studying a nematic patch on a cylindrical surface, which allows us to isolate the effects of the extrinsic curvature from the intrinsic curvature. We begin by reintroducing the general energy of a nematic on a curved surface. We show that, when the elastic constants are equal, the equilibrium shape of a topological defect changes to accommodate the extrinsic curvature without changing its phase. However, when the elastic constants are not equal, the phase of the defect becomes coupled to the extrinsic curvature of the surface. This results in topological defects with a fixed phase, which can lead to inter-defect frustration. We identify a region of bistability for ±1/2 charge defects that arises from the effect of twist deformations in the nematic which are identical under π/2 rotation on a cylinder. Finally, we show similar results for ±1 charge topological defects.
II. Frank free energy on a thin sheet
A liquid crystal can be described by the unitary director field which denotes the local average orientation of the anisotropic molecules. In the case of a nematic, the molecules are elongated and identical under reversal, thus any physics must be invariant under the transformation![[n with combining low line]](https://www.rsc.org/images/entities/i_char_006e_0332.gif) → −
→ −![[n with combining low line]](https://www.rsc.org/images/entities/i_char_006e_0332.gif) .
.
The energy of a nematic liquid crystal depends on variations of the director in space, which can take the form of splay, twist or bend. Thus, the total energy of a nematic texture is given by the Frank free energy1–4
 | (1) |
When considering a nematic confined to a thin sheet, it is convenient to reduce this equation to a surface energy. Thus, we consider a thin nematic layer with a uniform thickness h around a regular surface S. We assume that ![[n with combining low line]](https://www.rsc.org/images/entities/i_char_006e_0332.gif) lies tangential to the surface at all points and does not vary across the thickness of the sheet. In the limiting case where the sheet thickness is much smaller than the radius of curvature of the sheet, the energy can be written compactly as
lies tangential to the surface at all points and does not vary across the thickness of the sheet. In the limiting case where the sheet thickness is much smaller than the radius of curvature of the sheet, the energy can be written compactly as
 | (2) |
![[n with combining low line]](https://www.rsc.org/images/entities/i_char_006e_0332.gif) and its co-normal
and its co-normal ![[t with combining low line]](https://www.rsc.org/images/entities/i_char_0074_0332.gif) . These correspond to the in-plane bending and splay of the director field and are not affected by the extrinsic curvature of the surface. We will refer to these terms as the intrinsic energy terms; in curvilinear coordinates, they can be calculated as
. These correspond to the in-plane bending and splay of the director field and are not affected by the extrinsic curvature of the surface. We will refer to these terms as the intrinsic energy terms; in curvilinear coordinates, they can be calculated as| κn = ∇ini | (3) |
| κt = ∇iεijgjknk. | (4) |
The two additional terms, κn and cn, refer to the geodesic torsion and normal curvature, respectively. The geodesic torsion gives rise to twist deformations of the nematic, which arise from the fact that, on a curved surface, the curl of ![[n with combining low line]](https://www.rsc.org/images/entities/i_char_006e_0332.gif) can have a component tangential to the surface. To minimize this, the geodesic torsion penalizes deviations of
can have a component tangential to the surface. To minimize this, the geodesic torsion penalizes deviations of ![[n with combining low line]](https://www.rsc.org/images/entities/i_char_006e_0332.gif) from the lines of the curvature of the surface. The normal curvature gives rise to bending deformations of the nematic, as the director is confined to the surface which may not be flat. Thus, the normal curvature penalizes deviations of
from the lines of the curvature of the surface. The normal curvature gives rise to bending deformations of the nematic, as the director is confined to the surface which may not be flat. Thus, the normal curvature penalizes deviations of ![[n with combining low line]](https://www.rsc.org/images/entities/i_char_006e_0332.gif) from the principal direction of the minimal absolute curvature.
from the principal direction of the minimal absolute curvature.
The geodesic torsion and normal curvature couple the orientation of the nematic field to the extrinsic curvature of the surface; thus, we refer to them as the extrinsic twist and bending energy, respectively. They are given by
| τn = bijniεjkgklnl | (5) |
| cn = bijninj. | (6) |
III. Geometrical setup
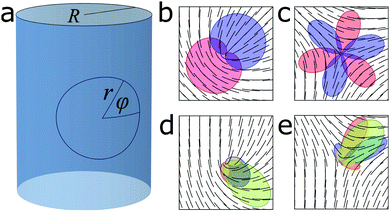
We will consider a small circular patch of the nematic with a radius r on the surface of a cylinder with the radius R. It is convenient to use polar coordinates around the center of the patch and we introduce the polar angle ϕ. We have chosen ϕ = 0 to coincide with the principal curvature of the cylinder, see Fig. 1a. This defines a natural orthogonal basis, [![[e with combining low line]](https://www.rsc.org/images/entities/i_char_0065_0332.gif) ϕ,
ϕ,![[e with combining low line]](https://www.rsc.org/images/entities/i_char_0065_0332.gif) r] in which we shall operate.
r] in which we shall operate.
We choose a cylinder here to isolate the effects of extrinsic curvature. Since the surface has no intrinsic curvature, the first fundamental form is identical to that of flat polar coordinates, gϕϕ = r2, grr = 1 and gϕr = grϕ = 0. The second fundamental form captures the extrinsic curvature and has the form
 | (7) |
 | (8) |
 | (9) |
Finally, we can write the unit nematic director as ![[n with combining low line]](https://www.rsc.org/images/entities/i_char_006e_0332.gif) = ni
= ni![[e with combining low line]](https://www.rsc.org/images/entities/i_char_0065_0332.gif) i with
i with
| nr = cos(θ) | (10) |
 | (11) |
![[e with combining low line]](https://www.rsc.org/images/entities/i_char_0065_0332.gif) r. Since we are concerned with the forces close to the core of a topological defect, we shall consider the case where θ is independent of the radial distance, r. This allows us to write the terms of the distortion energy as
r. Since we are concerned with the forces close to the core of a topological defect, we shall consider the case where θ is independent of the radial distance, r. This allows us to write the terms of the distortion energy as | (12) |
 | (13) |
 | (14) |
 | (15) |
Writing the terms in this way exposes their nature. The intrinsic bend and splay terms, eqn (12) and (13), penalize deviations in the director but are independent of the extrinsic curvature, whereas, the extrinsic twist and bend terms, eqn (14) and (15), penalize specific orientations of the director field proportional to the curvature.
Since we are not considering radial variations in the director field, we calculate this energy for a loop at r = 1, which we take as our length scale.
IV. Topological defects
Topological defects in two dimensional nematics are points, such that the director winds by a multiple of π on a closed path encircling them.2–4 If we place a topological defect at the center of our polar coordinate system, this implies where
where  is referred to as the topological charge of the defect.
In two dimensional nematics, the lowest energy topological defects have a charge ±1/2. For an isolated defect on a flat surface with equal elastic constants and charge k, the director field minimizing the Frank free energy is
| θ = (k − 1) ϕ + ψ. | (16) |
On a flat space, energy minimizing topological defects with k = ±1/2 and equal elastic constants are shown in Fig. 1b and c. The shaded regions highlight the magnitude of the bend and splay deformations at each polar angle. The number of alternating peaks of the bend and splay distortions around the core of the defect is the same as the order of rotational symmetry. If k1 = k3, the energy is equally distributed around the defect core as both bend and splay.
We minimize the energy around a defect core using a Monte-Carlo method that preserves the phase of the defect, see appendix for details. This allows us to find the energy minimizing configuration for a given defect phase. We use this method to find the shape of a defect with equal elastic constants on the surface of a cylinder, see Fig. 1d and e. On a curved surface, the defects have lost their symmetry and we see that the distortion energy is concentrated into a small angular region. The introduction of extrinsic bending and twisting energy is also visible, as the nematic texture around the defect must accommodate the curvature of the surface. While the curvature of the defects is associated with an increase in the energy, in all cases, the degree of intrinsic bend and splay remains balanced. This is because, when k1 = k3, the sum of the intrinsic bend and splay energies becomes independent of the phase, thus independent of the defect orientation relative to the principal curvature of the surface.
The loss of symmetry around the defect requires a new definition of the phase, which we now calculate as
| ψ = 〈θ + (1 − k)ϕ〉ϕ. | (17) |
V. Coupling between the defect phase and curvature
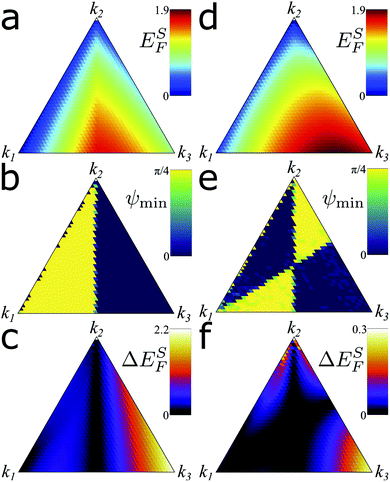
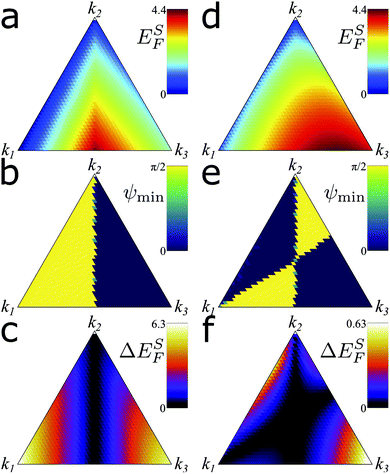
We now study the effect of the different elastic constants on defects on a curved surface. We restrict ourselves to the regime k1 + k2 + k3 = 1, since it is only the relative magnitude of the elastic constants that effects the shape of the defect. The energy associated with in-plane distortions depends only on k1 and k3; hence, as k2 is increased, we see a general reduction in the energy, Fig. 2a and d. This is because, as k1 and k3 decrease, the nematic has more freedom to deform in plane to accommodate the curvature. We also see that the energy increases more with k3 than that with k1, which is expected as k3 corresponds to both intrinsic and extrinsic bending effects.Interestingly, we see that, if the elastic constants are not equal, there is an energy associated with changes in the phase of the topological defect. This leads to a distinct energy minimizing phase which depends on the realtive magnitude of the elastic constants, Fig. 2b and e. In the case of a +1/2 defect, this effect is anti-symmetric around k1 = k3, Fig. 2b. Since the defect phase is associated with the defect orientation in ±1/2 defects, we can also measure an associated defect torque as the energy difference between defects with the phase that maximizes and minimizes the defect core energy, Fig. 2c. For +1/2 defects, the torque disappears at k1 = k3; hence, if k1 ≠ k3, defects will spontaneously align relative to the cylinder depending on whether the splay or bend coefficient is dominant.
For −1/2 defects, the energy minimizing phase is anti-symmetric around k1 = k3 and k2 = k3, leading to four distinct regions with two different phases, Fig. 2e. Again, the transitions between two regions are associated with zero torque on the defects, Fig. 2f. This implies that, if k1 ≠ k3 and k2 = k3, the phase of −1/2 is unaffected by the extrinsic curvature, whereas the +1/2 defects would experience a torque. This can lead to frustration between defects, as the relative position and phase of defects can also lead to torques on the defect cores.6–8 Finally, due to the symmetry of the cylinder, which is identical under π rotation, these results are identical under a π/2 change in the phase of the defect, which corresponds to a π rotation of the defect.6
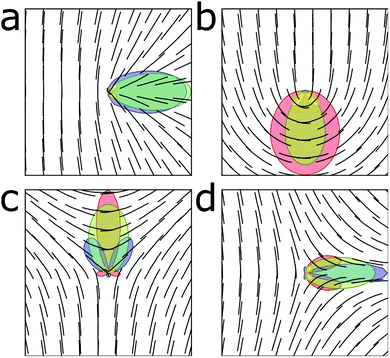
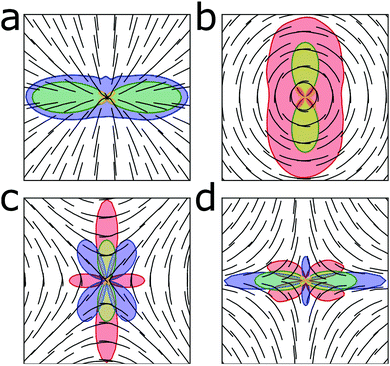
The source of the torques on the defects can be understood by looking at the distribution of energy around the defect core. An interesting property of +1/2 defects is that there exist configurations in which the bend (or splay) can be completely removed. These configurations introduce large regions of non-distorted nematic field around the defect core. The extrinsic curvature will cause these regions to align relative to the principal curvatures. This minimizes the extrinsic bend and twist deformations of these sections and results in the torque on the defect core. This is clearly apparent in Fig. 3a and b which show bend and splay minimizing configurations, respectively. In both cases, the defect re-orientates such as to minimize the extrinsic bend and twist associated with the parallel region of the nematic. This reorientation is associated with a phase change of the defect and hence the defect phase becomes coupled to the extrinsic curvature of the surface.
The case for −1/2 defects is more subtle as there is no bend or splay free configuration of the defect possible. In order to understand the phase-curvature coupling mechanism in −1/2 defects, we must first consider how the director changes around the core of the defect. As one follows a path around a ±1/2 defect core, the director occupies each orientation once. Since there is one orientation of the director that minimizes cn and two orientations that minimize τn, this implies that at minimum there is one region around the defect core that maximizes cn and two regions that maximize τn. More generally, the number of peaks in the extrinsic bend and twist energies will be 2|k| and 4|k|, respectively. This is observed in Fig. 3 where each defect features one green lobe and two yellow lobes corresponding to peaks in the extrinsic bend and twist energies, respectively. By rotating the −1/2 defect, it is possible to combine the various distortions in different combinations. When the bend distortions have an intermediate energetic cost (k1 < k3 < k2 or k2 < k3 < k1), the defect will re-orientate to combine the bend and extrinsic bend deformations into the same region, which implies combining splay and twist regions, which is only possible when ψ = π/4, Fig. 3c. However, if the bend distortions have either a high or a low cost (k3 < k1, k2 or k3 > k1, k2), the defect will re-orientate to separate bend and extrinsic bend, thus combining the extrinsic bend region with splay, and thus twist and bend regions. This is only possible when the defect has phase ψ = 0, Fig. 3d.
VI. Bistability of the defect phase
If we consider the energy of a defect free patch of the nematic on the surface of a cylinder, k = 0, the intrinsic bend and splay energies disappear since θ = −ϕ + ψ. Thus, the energy density of the patch is given by | (18) |
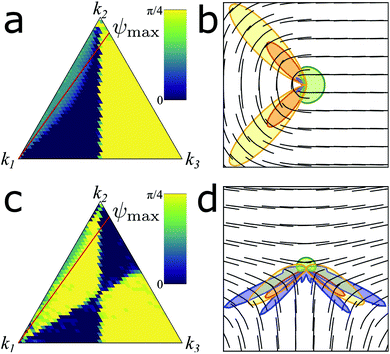
This bi-stability in the defect free nematic texture can lead to bi-stability in the defect phase. To examine this, we check for the phase with the highest energy for +1/2 topological defects, Fig. 4a. Largely this looks like the inverse of the energy minimizing phases shown earlier. However, when k3 is very small, we see an energy maximizing phase which is neither ψ = 0 or ψ = π/4. Since the energy must be symmetric around these values, this implies that there is a bistable state. The additional stable configuration for +1/2 defects is splay free and features two peaks in the bend energy coincident with regions of high twist, Fig. 4b. This allows for large regions of the defect to be aligned with orientations that minimize the twist distortion. We see similar evidence for bi-stability for −1/2 defects in a smaller region of the parameter space, Fig. 4c. Similar to the +1/2 defect, the −1/2 defect features two regions of the ordered nematic at orientations that minimize twist deformations seperated by regions of high splay, twist and bend, Fig. 4d.
VII. Integer charge topological defects
We now look at topological defects with an integer charge, k = ±1. This is of particular importance in the study of morphogenesis, where +1 topological defects have been shown to induce geometric changes depending on their phase.16 The energy, minimum phase and torque on the defect are very similar to that of the ±1/2 defect, Fig. 5. Again, we see a distinction between the positive and negative defects in the energy minimizing phase leading to possible frustration, Fig. 5b and e.The charge of a topological defect in a nematic can have any half integer number, k with rotational symmetry of the order n = 2|k − 1|. When n is odd, a phase change of Δψ = π/2 is equivalent to a reflection of the defect in the ϕ = ψ ± π/2 line. Since the cylinder is identical under this same reflection, this phase change is not associated with a change in energy. However, if n is even, the topological defect is identical under a reflection in the ϕ = ψ ± π/2 line. Thus, the system is invariant only under a full Δψ = π phase change. This effect is observed in Fig. 5b and e, which now show minima at ψ = 0 and ψ = π/2.
For an integer defect, the same mechanisms identified for ±1/2 defects are present here. For the ±1 defect, the director must occupy every orientation at least twice along a path around the defect core. Therefore, there are now two peaks of extrinsic bend and four peaks of twist energy expected around the defect core.
The +1 topological defect is similar to the +1/2 defect in that there exist bend or splay free configurations; however here they are coupled directly to the phase of the defect. For this reason, the +1 topological defect has the phase coupled to the elastic constants on the flat surface, where, for k1 < k3, we see aster like configurations and we see vortex configurations otherwise.2–4 On a curved surface, we see a similar coupling. When k1 < k3 (k1 > k3), the splay (bend) is focused into the two regions where the director aligns with the principal curvature where extrinsic bending is maximized. This allows for large regions to align with the direction of zero extrinsic curvature, Fig. 6a and b.
The −1 defect follows a similar mechanism to the −1/2 defect. Once again, the defect phase is coupled to the defect orientation. A change in the phase leads to a rotation of the defect, and this can be used to align the regions of bend or splay with regions of extrinsic bend or twist. Once again, we see that if k2 is intermediate, the defect will rotate to combine the bend and extrinsic bend into the same region of the defect. Otherwise, the defect will rotate to mix the bend with twist and splay with the extrinsic bend, Fig. 6c and d. For higher charge defects, we expect a reduced coupling between the defect phase and curvature. This is because the intrinsic energy of the defect scales with the topological charge k, whereas the extrinsic energy of the defect scales with the radius of curvature, R, which remains fixed. In addition, the increased number of alternating regions of the bend and splay distortions reduce the possibility of distortion-free regions which can align relative to the extrinsic curvature.
VIII. Concluding remarks
By studying the topological defects in thin cylindrical nematic sheets, we have been able to demonstrate a coupling between the topological defect phase and the extrinsic curvature of the surface which is mediated by the relative elastic constants of the nematic. This effect comes from the interplay between the various types of distortion possible in a nematic.When the elastic constants associated with splay, twist and bend distortions are not equal, the distribution of the energy within the defect loses symmetry. This loss of symmetry can interact with the broken symmetry of the cylindrical surface leading to a torque on the defect core. This process is independent of many previously discovered mechanisms such as sorting defect charge by the Gaussian curvature,35,36 breaking the symmetry of defect generation in active nematics,32 or re-orientating defects in the single constant approximation on the surface with the Gaussian curvature.13,14
This work has strong implications in the field of active matter, in particular the development of shape in living systems. Shape changes in living systems are driven by the filamentous cytoskeleton, which has a nematic characteristic and is not generally on a flat plane. Topological defects in the cytoskeleton have been shown to potentially drive morphological changes within growing organisms.16,20 Thus the placement of the defects is essential for the correct formation and function of the organism. For example, in the Hydra organism, charge +1 aster defects are localized at the mouth, foot and at the ends of each of the tentacles.20 This configuration would be stable for k1 < k3. If we consider the central body and tentacles to be roughly cylindrical in shape, the effect of extrinsic curvature in this instance would be to further stabilize these +1 aster defects.
Conflicts of interest
There are no conflicts to declare.Appendix
A. Monte Carlo method for minimizing the defect energy
We discretize ϕ and use a second order finite difference approach to approximate the derivatives in the energy. The defects are initialized with θ = (k − 1) ϕ + ψ. We perform our energy minimization in a manner that preserves k and ψ.To minimize the energy by the Monte-Carlo method, we define our perturbation as follows:
 | (A1) |
This gives a periodic bump with amplitude A, centered on B and width C, resulting from the sum of N Gaussians. The parameters are taken from a uniform distribution with limits of A ∈ [−π/4,π/4], B ∈ [0,2π] and C ∈ [0.2,2.2]. This ensures that the bump has a roughly continuous first derivative at B + π. We choose N = 1 to balance computational time against the smoothness of the first derivative.
This deformation does not have the ability to change the topological charge of the defect. In order to maintain a constant phase, we subtract the average integral of the bump.
 | (A2) |
The energy is minimized using a standard simulated annealing process with an exponentially decreasing temperature. ϕ is discretized at a resolution of dϕ = 2π/100. For the data presented in Fig. 2, 4a, c and 5, we discretize ψ at a resolution of dψ = π/32.
Acknowledgements
I am grateful to Karsten Kruse for insightful discussions. This work was funded by the SNSF through the NCCR for Chemical Biology.References
- F. C. Frank, Faraday Discuss., 1958, 25, 19 RSC.
- P. G. de Gennes and J. Prost, The Physics of Liquid Crystals, Clarendon Press, Oxford, 1995 Search PubMed.
- M. Kleman and O. D. Lavrentovich, Soft Matter Physics: An Introduction, Springer, New York, 2003 Search PubMed.
- P. Chaikin and T. C. Lubensky, Principles of condensed matter physics, Cambridge University Press, Cambridge, 1995 Search PubMed.
- O. D. Lavrentovich, P. Pasini, C. Zannoni and S. Zumer, Defects in liquid crystals: Computer simulations, theory and experiments, Springer Science & Business Media, 2001 Search PubMed.
- A. Vromans and L. Giomi, Soft Matter, 2016, 12, 6490 RSC.
- X. Tang and J. V. Selinger, Soft Matter, 2017, 13, 5481 RSC.
- D. J. G. Pearce and K. Kruse, Soft Matter, 2021, 17, 7408 RSC.
- H. Hopf, Differential geometry in the large: seminar lectures New York University 1946 and Stanford University 1956, Springer, 2003 Search PubMed.
- M. J. Bowick and L. Giomi, Adv. Phys., 2009, 58, 449 CrossRef CAS.
- G. Napoli and L. Vergori, Phys. Rev. E, 2018, 97, 052705 CrossRef PubMed.
- G. Napoli and L. Vergori, Phys. Rev. Lett., 2012, 108, 207803 CrossRef PubMed.
- M. Kralj, M. Kralj and S. Kralj, Phys. Status Solidi A, 2021, 218, 2000752 CrossRef CAS.
- L. Mesarec, W. Góźdź, A. Iglič and S. Kralj, J. Phys.: Conf. Ser., 2017, 780, 012015 CrossRef.
- D. Jesenek, S. Kralj, R. Rosso and E. G. Virga, Soft Matter, 2015, 11, 2434 RSC.
- D. J. G. Pearce, S. Gat, G. Livne, A. Bernheim-Groswasser and K. Kruse, arXiv, 2020 Search PubMed.
- A. Singer, L. Boucheron, S. H. Dietze, K. E. Jensen, D. Vine, I. McNulty, E. R. Dufresne, R. O. Prum, S. G. J. Mochrie and O. G. Shpyrko, Sci. Adv., 2016, 2, E1600149 CrossRef PubMed.
- T. B. Saw, A. Doostmohammadi, V. Nier, L. Kocgozlu, S. Thampi, Y. Toyama, P. Marcq, C. T. Lim, J. M. Yeomans and B. Ladoux, Nature, 2017, 544, 212 CrossRef CAS PubMed.
- K. Kawaguchi, R. Kageyama and M. Sano, Nature, 2017, 545, 327 CrossRef CAS PubMed.
- Y. Maroudas-Sacks, L. Garion, L. Shani-Zerbib, A. Livshits, E. Braun and K. Keren, Nat. Phys., 2021, 17, 251 Search PubMed.
- P. Guillamat, C. Blanch-Mercader, G. Pernollet, K. Kruse and A. Roux, Nat. Mater., 2022, 21, 588 CrossRef CAS PubMed.
- L. Giomi, Phys. Rev. X, 2015, 5, 031003 Search PubMed.
- S. Ramaswamy, Ann. Rev. Condens. Matter Phys., 2010, 1, 323 CrossRef.
- M. C. Marchetti, J. F. Joanny, S. Ramaswamy, T. B. Liverpool, J. Prost, M. Rao and R. A. Simha, Rev. Mod. Phys., 2013, 85, 1143 CrossRef CAS.
- T. Sanchez, D. N. Chen, S. J. DeCamp, M. Heymann and Z. Dogic, Nature, 2012, 491, 431 CrossRef CAS PubMed.
- S. J. DeCamp, G. S. Redner, A. Baskaran, M. F. Hagan and Z. Dogic, Nat. Mater., 2015, 14, 1110 CrossRef CAS PubMed.
- E. Putzig, G. S. Redner, A. Baskaran and A. Baskaran, Soft Matter, 2016, 12, 3854 RSC.
- A. Doostmohammadi, M. F. Adamer, S. P. Thampi and J. M. Yeomans, Nat. Commun., 2016, 7, 10557 CrossRef CAS PubMed.
- A. U. Oza and J. Dunkel, New J. Phys., 2016, 18, 093006 CrossRef.
- S. Shankar and M. C. Marchetti, Phys. Rev. X, 2019, 9, 041047 CAS.
- K. Thijssen, L. Metselaar, J. M. Yeomans and A. Doostmohammadi, Soft Matter, 2020, 16, 2065 RSC.
- D. J. G. Pearce, New J. Phys., 2020, 22, 063051 CrossRef CAS.
- D. J. G. Pearce, J. Nambisan, P. W. Ellis, A. Fernandez-Nieves and L. Giomi, arXiv preprint (2020).
- D. J. G. Pearce, Phys. Rev. Lett., 2019, 122, 227801 CrossRef CAS PubMed.
- D. J. G. Pearce, P. W. Ellis, A. Fernandez-Nieves and L. Giomi, Phys. Rev. Lett., 2019, 122, 168002 CrossRef CAS PubMed.
- D. J. G. Pearce, P. W. Ellis, A. Fernandez-Nieves and L. Giomi, Nat. Phys., 2018, 14, 85 Search PubMed.
| This journal is © The Royal Society of Chemistry 2022 |

