 Open Access Article
Creative Commons Attribution 3.0 Unported Licence
Interactions between conducting surfaces in salt solutions†
Samuel
Stenberg
 a,
Clifford E.
Woodward
 b and
Jan
Forsman
 *a
*a
aTheoretical Chemistry, Lund University, P. O. Box 124, 221 00 Lund, Sweden. E-mail: samuel.stenberg@teokem.lu.se; jan.forsman@teokem.lu.se
bUniversity College, University of New South Wales (ADFA), Canberra ACT 2600, Australia. E-mail: c.woodward@adfa.edu.au
First published on 28th January 2022
Abstract
In this work, we simulate interactions between two perfectly conducting surfaces, immersed in a salt solution. We demonstrate that these forces are quantitatively different from those between (equally charged) non-conducting surfaces. There is, for instance, a significant repulsion between net neutral surfaces. On the other hand, there are also qualitative similarities, with behaviours found with non-conducting surfaces. For instance, there is a non-monotonic dependence of the free energy barrier height, on the salt concentration, and the minimum essentially coincides with a flat profile of the apparent surface charge density (i.e. the effective net surface charge density, some distance away from the surface, when accounting for ion neutralization), outside the so-called Stern layer. These conditions can be described as “perfect surface charge neutralization”. Despite observed quantitative differences, we demonstrate that it might be possible to mimic a dispersion containing charged colloidal metal particles by a simpler model system with charged non-conducting particles, using modified particle–ion interactions.
1 Introduction
Interactions between particles and charged surfaces in aqueous salt solutions are important and ubiquitous in many areas of soft matter. They have been thoroughly investigated over decades and their theory is also well-established.1–16 If the particle surfaces are weakly charged, or if the salt is monovalent, these interactions can usually be approximated by the celebrated DLVO theory.17,18 At high electrostatic coupling strengths, e.g., in the presence of multivalent ions, numerous theoretical and experimental studies have illustrated that a simple Poisson–Boltzmann (PB) treatment, even at the non-linear level, may lead to predicted behaviours that are qualitatively wrong. The origin of this failure is the mean-field approximation upon which the PB theory is based. This amounts to a neglect of ion correlations, which are significant in the presence of strong electrostatic interactions. Of particular importance is the correlation between similarly charged ions, whereby “Coulomb holes” are effectively created, i.e., a volume around ions, from which other like-charged species are excluded.Ion correlations manifest themselves in various ways, and important phenomena that find their source in these mechanisms (and will not be captured by a PB treatment) include: overcharging (charge reversal) whereby multivalent counterions overcompensate the bare surface charge;19 attraction between like-charged particles,3,4,9 and repulsion between particles of opposite surface charge.11,20 These phenomena are related. It is well-established that ion correlations, when sufficiently strong, will generate a short-ranged attraction between like-charged surfaces. At larger separations, however, the same correlations will lead to a long-ranged double-layer repulsion, between effectively overcharged surfaces, for a high enough concentration of the multivalent salt. Below some threshold concentration, overcharging is absent and a double-layer repulsion at long range still results, but is due to the incomplete screening of the bare surface charges. Thus, at some intermediate critical concentration value, there is a “perfect surface neutralization” point, whereby the long-range repulsive barrier is negligible.12–16,21–24 Experimentally, this manifests itself as a specific salt concentration where the charged particle dispersion has minimal stability. The neutralization point can also be experimentally identified through a vanishing electrophoretic mobility. These observations, and their underlying causes, have been theoretically confirmed both via simulations as well as more approximate treatments.
The situation is less obvious when the particles are metallic, or otherwise conducting.1,25 In this case, the strong surface polarization will induce secondary effective interactions between particles, which is a scenario considerably more difficult to treat theoretically. Despite some progress that has been made on these systems,26–29 questions regarding the phenomena described above (for non-conducting particles), remain to be validated for the conducting case. For example, it is still unclear whether a threshold salt concentration exists, above which charge reversal takes place and, if it does, how strongly does the surface conduction affect its value. Furthermore, it would also be of interest to devise simplified approaches, wherein the computationally costly effects of surface polarization can be approximately taken into account. This would be especially useful when dealing with dispersions containing colloidal conducting particles, wherein multiple image interactions are exceptionally difficult to handle.
In this work, we will simulate the interaction between two perfectly conducting planar surfaces and investigate the role played by multivalent ions in determining a point of surface neutralization (or charge reversal). We also introduce a simple effective model that mimics the conducting case by mapping it onto a model of a charged non-conducting particle with an additional (suitably chosen) particle–ion interaction.
2 Model and methods
The salt solution is described by a soft-sphere version of the so-called primitive model, wherein the aqueous solvent only exerts its influence via the dielectric constant, εr = 78.3. The temperature is set to 298 K, whereby the Bjerrum length becomes about 7.16 Å. For the major part of this work, we will focus on 3![[thin space (1/6-em)]](https://www.rsc.org/images/entities/char_2009.gif) :
:![[thin space (1/6-em)]](https://www.rsc.org/images/entities/char_2009.gif) 1 salts. However, for completeness, we will also include a study of a 4
1 salts. However, for completeness, we will also include a study of a 4![[thin space (1/6-em)]](https://www.rsc.org/images/entities/char_2009.gif) :
:![[thin space (1/6-em)]](https://www.rsc.org/images/entities/char_2009.gif) 1 salt. The ions are modelled as softly repulsive spheres, carrying a central charge. This soft repulsion, ur, between two ions separated by r has the form,
1 salt. The ions are modelled as softly repulsive spheres, carrying a central charge. This soft repulsion, ur, between two ions separated by r has the form, | (1) |
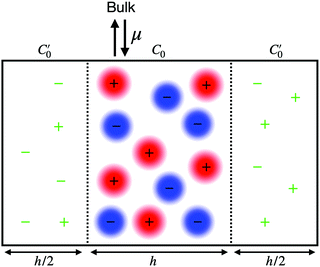
As described in previous work,31 and also illustrated in Fig. 1, a symmetric electroneutral “super-cell”,  , can be defined, consisting of the central cell C0, together with the nearest halves,
  , of the adjacent reflected (image) cells. An infinite 3-dimensional array of replicas of C reproduces the ensemble described above. An advantage of our current unit cell C definition, is that its dipole moment is zero. Placing
  fully to the left, or to the right, of C0 will lead to a spurious electric field of the unit cell (even at zero applied voltage), which needs to be accounted for.32–34 Thus the ensemble can be straightforwardly treated using 3-D Ewald methods. One of the consequences of our construction in that the total Ewald energy, UC, of the ions in C is equal to twice the energy of the ions in C0. That is,
 | (2) |
In order to establish proper surface interactions, across a range of different separations (h), we need to ensure that the confined fluid is in equilibrium with an appropriate bulk solution. This is achieved via Grand Canonical (Metropolis) Monte Carlo (GCMC) simulations. As we have also demonstrated recently,31 it is possible to use individual ion chemical potentials μind, and perform separate GCMC steps for each species. We can define the mean chemical potential as,  , where Nsp is the number of species with different valencies Zi. The coefficients, νi satisfy,
  and
and  . The individual ion chemical potentials in the bulk salt solution, can then be formally written as,
| μind(Zi) = μsalt − ZieΨref | (3) |
![[thin space (1/6-em)]](https://www.rsc.org/images/entities/i_char_2009.gif) :
:![[thin space (1/6-em)]](https://www.rsc.org/images/entities/char_2009.gif) Z) electrolyte Ψref = 0, but it is non-zero for the asymmetric salts (3
Z) electrolyte Ψref = 0, but it is non-zero for the asymmetric salts (3![[thin space (1/6-em)]](https://www.rsc.org/images/entities/char_2009.gif) :
:![[thin space (1/6-em)]](https://www.rsc.org/images/entities/char_2009.gif) 1 and 4
1 and 4![[thin space (1/6-em)]](https://www.rsc.org/images/entities/char_2009.gif) :
:![[thin space (1/6-em)]](https://www.rsc.org/images/entities/char_2009.gif) 1) investigated in this work.
1) investigated in this work.
In our simulations the value of Ψ is not known a priori. Instead we introduce a so-called bias potential, Ψbias, that discriminates between anions and cations so that the individual ion chemical potentials become,
| μeff(Zi) = μsalt − ZieΨbias | (4) |
These effective chemical potentials are used in the Grand Canonical Boltzmann weights for insertion/deletion moves of the individual ions. The difference Ψbias − Ψref is the Donnan potential, which is due to the charge distribution at the interface between the bulk and the confined electrolyte. In our system the Donnan potential is equal to the surface potential. Thus, our simulations are carried out at constant surface potential. In an experimental setup, using an atomic force microscope, or a surface force apparatus, with potentiometric regulation, the Donnan potential would correspond to the applied voltage.
For a non-zero Donnan potential the simulation box C0 will not be electroneutral. However, the repeated supercell, C, is ensured to be electroneutral by the completely correlated image charges. While the surface potential is fixed, the instantaneous surface charge density, σs, (determined by the image charges) will fluctuate around some average value 〈σs〉. It should be noted that this average value will vary with the surface separation. We will denote its limiting value, at large separations by σsingles.
To complete our analysis we introduce some other definitions and calculation protocols. The “apparent” surface charge density, σapp(z), is defined as,
 | (5) |
In our simple approach, the electrode polarization is treated via image charges, which represents the response of the surfaces to thermal fluctuations of the ions. At long-range these ion-induced thermal fluctuations of the surfaces lead to an algebraically decaying repulsive contribution to the normal pressure. There is another contribution to the pressure, that is neglected in our model, due to correlated thermal fluctuations of the bare surfaces (and underlying solvent). This gives rise to an attractive zero frequency van der Waals pressure, PvdW(0), that should be added to the measured normal pressure, and exactly cancels the repulsive ion-induced contribution at long-range. This pressure contribution is analytic26,27 and has the following form,
 | (6) |
![[thin space (1/6-em)]](https://www.rsc.org/images/entities/char_2009.gif) :
:![[thin space (1/6-em)]](https://www.rsc.org/images/entities/char_2009.gif) 1 salt solutions.29 By adding PvdW(0) to our simulated pressures, we ensure that our results provide “pure Coulomb” contributions, to which suitably estimated vdW interactions (for instance via a metal–water–metal Hamaker constant) may be subsequently added, in the spirit of DLVO theory. As mentioned above, the procedure to evaluate PN is described in the ESI.† The net pressure, Pnet can be estimated by subtracting the value at the largest simulated separation, hmax, i.e. Pnet(h) = PN(h) − PN(hmax). That is, we assume hmax is suitably large so that the fluid is essentially bulk-like near the mid-plane. Finally, the net interaction free energy per unit area, Δgs(h), is found by integrating (we used a cubic spline) the net pressure,
1 salt solutions.29 By adding PvdW(0) to our simulated pressures, we ensure that our results provide “pure Coulomb” contributions, to which suitably estimated vdW interactions (for instance via a metal–water–metal Hamaker constant) may be subsequently added, in the spirit of DLVO theory. As mentioned above, the procedure to evaluate PN is described in the ESI.† The net pressure, Pnet can be estimated by subtracting the value at the largest simulated separation, hmax, i.e. Pnet(h) = PN(h) − PN(hmax). That is, we assume hmax is suitably large so that the fluid is essentially bulk-like near the mid-plane. Finally, the net interaction free energy per unit area, Δgs(h), is found by integrating (we used a cubic spline) the net pressure, 
3 Results
We will start by investigating the response of surface forces to a change of Ψbias, which in turn leads to different surface charge densities. Given that our intent in this work is to establish possible relations between apparent surface charge density profiles and free energy barriers, we will focus on long-range behaviours. Correlations between the trivalent cations will always cause a strong attraction at short range, which are indeed observed in our simulations. However, this behaviour is not the focus of this work, so in most cases we will concentrate on that part of the interaction at and beyond the free energy barriers.A 4 mM salt solution at various surface charges σsingles
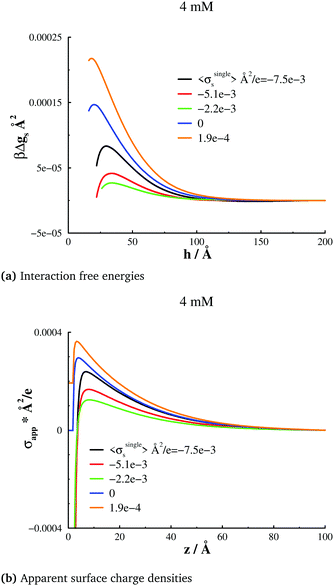
With the salt chemical potential adjusted such that the bulk concentration is about 4 mM, we obtain the surface interactions, at various bias potentials (and therefore different σsingles), as shown in Fig. 2(a). There are a few remarkable observations. First, we note that even for net neutral surfaces, there is a significant double-layer repulsion, in stark contrast to standard DLVO theory. Moreover, the repulsion varies in a non-monotonic manner with the applied potential, i.e., with σsingles. If we start with a surface that is net neutral at large separations, the barrier becomes larger for a slight positive surface charge density (σsingles = 0.00019 e), but is initially weaker if the surfaces are made negative (σsingles = −0.0022 e Å−2, and σsingles = −0.0051 e Å−2)). Even σsingles = −0.0075 e Å−2 is insufficient to generate a repulsion as strong as for neutral surfaces, although the difference is diminished nevertheless. The apparent surface charge density profiles, evaluated at a large separation, displays exactly the same qualitative behaviour as the surface interactions. This is illustrated in Fig. 2(b). A comparison between the graphs in Fig. 2(a) and (b) also reveals that the systems wherein the maximum of the apparent surface charge density is located near the surface, correspond to surface force barriers which also occur at short separations. Already at this stage, our results imply a close relationship between σapps(z) and the position and magnitude of the repulsive barrier in Pnet. We report further evidence for this below.As already mentioned, this work focuses on the long-ranged part of the interactions, but it should be noted that we do indeed establish ion-correlation attractions at short range, for all investigated cases, as expected in the presence of highly valent counterions. With a 1![[thin space (1/6-em)]](https://www.rsc.org/images/entities/char_2009.gif) :
:![[thin space (1/6-em)]](https://www.rsc.org/images/entities/char_2009.gif) 1 salt, this regime would vanish, and we would obtain monotonically repulsive interactions. Such systems have been explored in an earlier work,29 using simulations as well as an image charge adjusted version of Poisson–Boltzmann theory. While successful for 1
1 salt, this regime would vanish, and we would obtain monotonically repulsive interactions. Such systems have been explored in an earlier work,29 using simulations as well as an image charge adjusted version of Poisson–Boltzmann theory. While successful for 1![[thin space (1/6-em)]](https://www.rsc.org/images/entities/char_2009.gif) :
:![[thin space (1/6-em)]](https://www.rsc.org/images/entities/char_2009.gif) 1 salt solutions, such a mean-field ansatz would fail for our systems, containing multivalent counterions, since an account for ion correlations is required to even qualitatively capture the presence of an attractive regime.
1 salt solutions, such a mean-field ansatz would fail for our systems, containing multivalent counterions, since an account for ion correlations is required to even qualitatively capture the presence of an attractive regime.
A given bias potential will generate some average surface charge density at large separations, as indicated in the legends of Fig. 2. However, these averages will vary as the surfaces are brought closer together, which in turn might influence the interaction free energy. Our simulation data suggest that this effect indeed exists, but also that its relevance sometimes is small. In Fig. 3, we plot how the average surface charge density changes with separation, i.e. 〈σs(h)〉 − 〈σsingles〉. We note that in the cases where 〈σsingles〉 is negative, the average surface charge density becomes less negative at short separations, but the relative change is quite modest. When the isolated surfaces are neutral, or weakly positive, on the other hand, the net change is negative, and in these cases the effect appears strong enough to be significant.
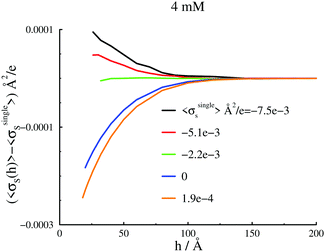 | ||
| Fig. 3 Separation dependence of the net average surface charge density, 〈σs〉(h) − 〈σsingles〉, for various applied bias potentials, Ψbias. | ||
A 22 mM salt solution at various surface charges σsingles
Let us now examine the responses at a higher bulk salt concentration of 22 mM. We summarize our results in Fig. 4. The behaviours are qualitatively similar to those we found at 4 mM, although the effects of a decreased electrostatic screening length are apparent. Again, we note how the free energy barrier responds in a non-monotonic manner to an incremental increase of the applied bias potential, starting from a low value. This behaviour is analogous for the maximum degree of overcharging at an isolated surface. At an intermediate bias potential, for which σsingles = −0.005 e Å−2, we find the weakest barrier, and also the smallest degree of overcharging. The range of the barriers are also qualitatively reflected by the surface distance at which the maximum overcharging occurs.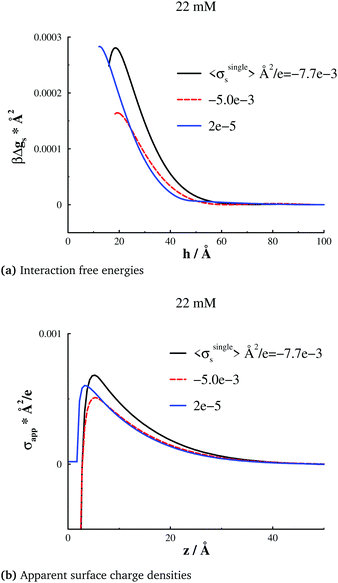 | ||
| Fig. 4 Analogous results as those reported in Fig. 2, but at a salt concentration of 22 mM, and a “large” separation h = 100 Å. (a) Interaction free energies per unit area, gs(h). (b) Apparent surface charge densities, σapps(z), at a “large” separation, h = 100 Å. | ||
σ singles ≈ −0.005 e Å−2: salt concentration dependence
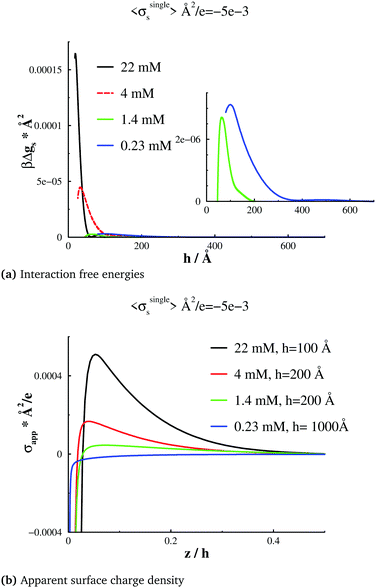
In this section, we will investigate surface forces, at a constant limiting surface charge density σsingles ≈ −0.005 e Å−2, but for different bulk salt concentrations. In order to facilitate such a comparison, we must first adjust Ψbias, for each chosen concentration (chemical potential), at a large surface separation. In Fig. 5(b), we note that overcharging vanishes at a sufficiently low concentration, and that there is a threshold concentration, of about 1.4 mM, at which σapp(z) is essentially flat, outside the primary adsorption layer (or “Stern layer”). Below this threshold concentration, σapp(z) has a positive slope beyond the Stern layer, and above the threshold, the slope is negative. If we compare with Fig. 5(a), we see that close to the threshold concentration, the free energy barrier has almost vanished. The barriers are stronger at higher as well as lower salt concentrations, and, as expected, they are more long-ranged in the latter case. Thus, there is a non-monotonic dependence of the barrier height on the salt concentration with the minimum coinciding with a flat σapp(z) profile (outside the Stern layer). These observations indicate a condition that can be described as “perfect surface charge neutralization”. As stated in the Introduction, similar behaviour has been observed also for non-conducting surfaces, experimentally,13,35,36 as well as theoretically.21–24 At long range, there will be a double-layer repulsion between surfaces that are effectively negative, or positive, depending on whether the surfaces are overcharged, or “undercharged”. However, at the threshold concentration (about 1.4 mM in our case), the effective surface charge is close to zero, which essentially eliminates the double-layer repulsion. As mentioned, these observations have already been established for non-conducting surfaces, but this is, to the best of our knowledge, the first report of similar findings for conducting surfaces. Given the extra adsorption of multivalent ions that such surfaces generate, the threshold concentration will be lower than for non-conducting surfaces.24A simple adsorption model with non-conducting charged surfaces
Let us summarize our findings thus far. The slope and range of σapp(z), outside the Stern layer at a single surface, carries information about the range and strength of the free energy barrier, when two such surfaces interact. This observation might help us to more simply identify the predominate mechanisms in at least two ways. Firstly, we note that a single simple canonical simulation of an isolated surface can provide useful information about how two such surfaces will interact – without having to conduct expensive grand canonical surface force calculations across a range of different surface separations. Secondly, the apparent relevance of the σapp(z) profile at long range, suggests the possibility of a simplified approach, where the expensive treatment of image charges can be avoided. Here we will explore such a model, by replacing the image charge treatment by using an attractive, short-ranged adsorption potential, w(z), between ions and the surfaces. We will furthermore report interactions between conducting, and non-conducting surfaces in a 1.1 mM 4![[thin space (1/6-em)]](https://www.rsc.org/images/entities/char_2009.gif) :
:![[thin space (1/6-em)]](https://www.rsc.org/images/entities/char_2009.gif) 1 salt solution, where the surface charge density at large separations is 〈σsingles〉 ≈ −0.01 e Å−2. This will allow further scrutiny of our suggested simplified approach, with an added adsorption potential to mimic effects from image charges.
1 salt solution, where the surface charge density at large separations is 〈σsingles〉 ≈ −0.01 e Å−2. This will allow further scrutiny of our suggested simplified approach, with an added adsorption potential to mimic effects from image charges.
We expect an attraction between an ion and a conducting surface, with a strength proportional to Zi2, from the self-image charge of an ion of valency Zi. However, this attraction will be screened as the ion moves away from the interface, so assuming it to be short-ranged, we shall model it as a linear function. With these considerations in mind, we propose the following adsorption potential, as an alternative to the image charge approach used above,
 | (7) |
![[thin space (1/6-em)]](https://www.rsc.org/images/entities/char_2009.gif) :
:![[thin space (1/6-em)]](https://www.rsc.org/images/entities/char_2009.gif) 1 salt, Aw = 0.285 leads to an apparent surface charge density profile that resembles the corresponding one established with conducting (but otherwise inset) surfaces. A similar observation holds for a 4
1 salt, Aw = 0.285 leads to an apparent surface charge density profile that resembles the corresponding one established with conducting (but otherwise inset) surfaces. A similar observation holds for a 4![[thin space (1/6-em)]](https://www.rsc.org/images/entities/char_2009.gif) :
:![[thin space (1/6-em)]](https://www.rsc.org/images/entities/char_2009.gif) 1 salt, with Aw = 0.18.
1 salt, with Aw = 0.18.
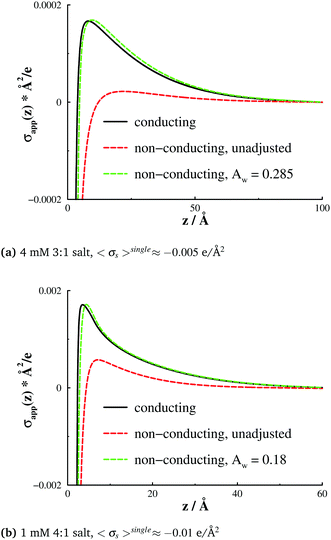 | ||
Fig. 6 Apparent surface charge densities, σapps(z), at conducting and non-conducting walls. (a) A 4 mM 3![[thin space (1/6-em)]](https://www.rsc.org/images/entities/char_2009.gif) : :![[thin space (1/6-em)]](https://www.rsc.org/images/entities/char_2009.gif) 1 salt, and 〈σsingles〉 ≈ −0.005 e Å−2. (b) A 1 mM 4 1 salt, and 〈σsingles〉 ≈ −0.005 e Å−2. (b) A 1 mM 4![[thin space (1/6-em)]](https://www.rsc.org/images/entities/char_2009.gif) : :![[thin space (1/6-em)]](https://www.rsc.org/images/entities/char_2009.gif) 1 salt, and 〈σsingles〉 ≈ −0.01 e Å−2. The red dashed curves display results for non-conducting surfaces, as obtained without any non-electrostatic adsorption potential. By adjusting AW (see eqn (7)) with the data for conducting surfaces as target (black curves), we arrived at the green dashed curves. This was achieved for Aw = 0.285 (3 1 salt, and 〈σsingles〉 ≈ −0.01 e Å−2. The red dashed curves display results for non-conducting surfaces, as obtained without any non-electrostatic adsorption potential. By adjusting AW (see eqn (7)) with the data for conducting surfaces as target (black curves), we arrived at the green dashed curves. This was achieved for Aw = 0.285 (3![[thin space (1/6-em)]](https://www.rsc.org/images/entities/char_2009.gif) : :![[thin space (1/6-em)]](https://www.rsc.org/images/entities/char_2009.gif) 1 salt, graph (a)), and Aw = 0.18 (4 1 salt, graph (a)), and Aw = 0.18 (4![[thin space (1/6-em)]](https://www.rsc.org/images/entities/char_2009.gif) : :![[thin space (1/6-em)]](https://www.rsc.org/images/entities/char_2009.gif) 1 salt, graph (b)), respectively. 1 salt, graph (b)), respectively. | ||
In Fig. 7 we show the resulting normal pressures, PN, compared with those for both conducting and non-conducting surfaces. We see that interactions between conducting surfaces can be successfully captured by the surface adsorption model, without using explicit dielectric boundaries. We should also point out that, for non-conducting surfaces, one cannot apply the IE simulation method.
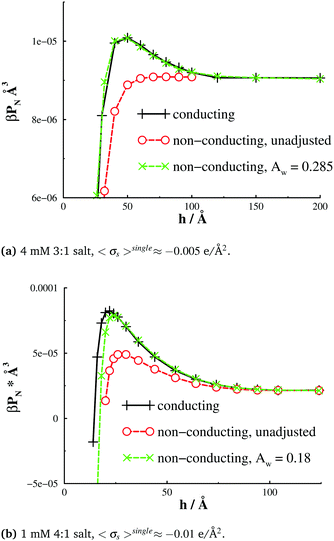 | ||
| Fig. 7 Slit normal pressures, PN, for the systems described in Fig. 5. Results are shown for conducting and non-conducting surfaces that carry a similar average surface charge density, but are otherwise inset, as well as for a non-conducting surface that has a non-electrostatic ion affinity. The latter affinity was adjusted so as to generate an apparent surface charge density profile that, at large separations, resemble the corresponding profile at a non-conducting (inset) surface, as shown in Fig. 5. This procedure emanated in the Aw values that are reported in the legends of the graphs. | ||
Instead, we utilized an external mean electrostatic potential, which was calculated from previously simulated ion density profiles, to account for long-ranged interactions external to the simulated volume.37,38 Furthermore, in the addition and deletion moves of the GCMC simulations an overall electroneutral group of ions were either added, or removed, from the simulation cell. The pressure component normal to the surfaces, PN, was, for non-conducting surfaces, obtained by calculating the average z-projection of all forces per unit area, acting across the mid plane of the slit. Despite these differences in simulation methodology, the limiting normal pressure at large separations (the bulk pressure) is identical, within some small amount of noise. This is an important check that confirms that long-ranged interactions are satisfactorily predicted, and that the simulated pressures are correctly evaluated.
Finally, in Fig. 8, we report the corresponding net interaction free energies, per unit area. The agreement between interactions obtained with adsorption-adjusted models, and those from a full image charge treatment, is not perfect, but nevertheless encouraging. The apparently successful application of the fitted (single-particle) potential suggests that image effects are dominated by the short-ranged adsorption of the counterions. While the simulations presented here are against flat surfaces, they may be of some relevance to conducting spherical colloidal particles where the radius is large. Dispersions of such particles will be dominated by pair interactions between the colloids, and it is possible that the Derjaguin approximation can also be brought to bear to take account of curvature. This gives some hope that simulations of a colloidal dispersion might be approximated by a model where multiple image charges are replaced by a similar ion adsorption potential. Of course, one would need to fit the adsorption potential using a separate single particle pre-simulation, by matching integrated charge density profiles (σapps(r)), but this would still amount to very large computational savings for a many-particle simulation.
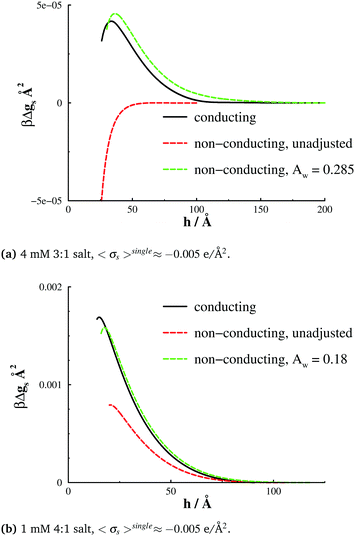 | ||
| Fig. 8 Interaction free energies, gs, for the systems described in Fig. 5. | ||
4 Conclusions
This simulation study has focused on the accurate determination of electrolyte properties confined by conducting surfaces and in electro-chemical equilibrium with a fixed bulk solution. We have shown that a surface neutralization threshold concentration is observed in these systems, similar to that seen in non-conducting surfaces. This has significance in many experimental systems, where the charged particles are either metallic or semi-metallic, or else have mobile charges on their surfaces. In addition to this, we have uncovered very strong repulsive barriers to particle association even for ostensibly uncharged particles. This effect is primarily due to the adsorption of multivalent charged species at the electrode surfaces due to strong self-image interactions. This adsorption can also promote surface overcharging. The forced desorption of these ions as the surfaces approach can lead to surface–surface repulsion, though the full story can be complex, as we have also seen that the close approach of apparently neutral surfaces can increase multivalent ion adsorption (and the magnitude of the surface charge) at least at intermediate separations. Finally, we have explored the possibility of mapping these conducting systems to one of non-conducting charged surfaces with an additional adsorption potential. Fitting this short-ranged potential to the effective surface charge gives rise to very similar surface interactions. Though the success of such a potential for spherical colloid particles is purely conjecture at this stage, evidence would suggest that this approach holds some promise for facilitating calculations on conducting particles, by way of a much simpler model.Conflicts of interest
There are no conflicts to declare.Acknowledgements
J. F. acknowledges financial support from the Swedish Research Council. We also thank the Lund University cluster organization, LUNARC, for providing computational resources.References
- M. Faraday, Philos. Trans. R. Soc. London, 1857, 147, 145–181 CrossRef.
- F. Oosawa, Polyelectrolytes, Marcel Dekker, New York, 1971 Search PubMed.
- L. Guldbrand, B. Jönsson, H. Wennerström and P. Linse, J. Chem. Phys., 1984, 80, 2221 CrossRef CAS.
- R. Kjellander and S. Marcelja, Chem. Phys. Lett., 1986, 127, 402–407 CrossRef CAS.
- S. Nordholm, Aust. J. Chem., 1984, 37, 1 CrossRef CAS.
- S. Nordholm, Chem. Phys. Lett., 1984, 105, 302 CrossRef CAS.
- L. Mier-y Teran, S. Suh, H. S. White and H. T. Davis, J. Chem. Phys., 1990, 92, 5087 CrossRef CAS.
- J. Valleau, R. Ivkov and G. M. Torrie, J. Phys. Chem., 1991, 95, 520 CrossRef CAS.
- M. A. G. Dahlgren, Å. Waltermo, E. Blomberg, P. M. Claesson, L. Sjöström, T. Åkesson and B. Jönsson, J. Phys. Chem., 1993, 97, 11769 CrossRef CAS.
- Z. Tang, L. E. Scriven and H. T. Davis, J. Chem. Phys., 1994, 100, 4527 CrossRef CAS.
- K. Bestemann, M. A. G. Zevenbergen, H. A. Heering and S. G. Lemay, Phys. Rev. Lett., 2005, 93, 170802 CrossRef PubMed.
- W. Lin, P. Galletto and M. Borkovec, Langmuir, 2004, 20, 7465 CrossRef CAS PubMed.
- G. Gillies, W. Lin and M. Borkovec, J. Phys. Chem. B, 2007, 111, 8626 CrossRef CAS PubMed.
- L. Popa, G. Gillies, G. Papastavrou and M. Borkovec, J. Phys. Chem. B, 2010, 113, 8458 CrossRef PubMed.
- M. A. Gebbie, M. Valtiner, X. Banquy, E. T. Fox, W. A. Henderson and J. N. Israelachvili, Proc. Natl. Acad. Sci. U. S. A., 2013, 110, 9674–9679 CrossRef CAS PubMed.
- M. A. Gebbie, H. A. Dobbs, M. Valtiner and J. N. Israelachvili, Proc. Natl. Acad. Sci. U. S. A., 2015, 112, 7432–7437 CrossRef CAS PubMed.
- B. V. Derjaguin and L. Landau, Acta Physicochim. URSS, 1941, 14, 633–662 Search PubMed.
- E. J. W. Verwey and J. T. G. Overbeek, Theory of the Stability of Lyophobic Colloids, Elsevier Publishing Company Inc., Amsterdam, 1948 Search PubMed.
- G. M. Torrie and J. P. Vallueau, J. Phys. Chem., 1982, 86, 3251 CrossRef CAS.
- M. Trulsson, B. Jönsson, T. Åkesson, J. Forsman and C. Labbez, Langmuir, 2007, 23, 11562–11569 CrossRef CAS PubMed.
- M. Turesson, J. Forsman and T. Åkesson, Phys. Rev. E: Stat., Nonlinear, Soft Matter Phys., 2007, 76, 021801 CrossRef PubMed.
- M. Turesson, C. E. Woodward, T. Åkesson and J. Forsman, J. Phys. Chem. B, 2008, 112, 5116 CrossRef CAS PubMed.
- M. Turesson, T. Åkesson and J. Forsman, J. Colloid Interface Sci., 2009, 329, 67 CrossRef CAS PubMed.
- S. Stenberg and J. Forsman, Langmuir, 2021, 37, 14360–14368 CrossRef CAS PubMed.
- J. Turkevich, P. C. Stevenson and J. Hillier, Discuss. Faraday Soc., 1951, 11, 55–75 RSC.
- J. Mahanty and B. Ninham, Dispersion forces, Academic Press, 1976 Search PubMed.
- R. Kjellander and S. Marcelja, Chem. Phys. Lett., 1987, 142, 485–491 CrossRef CAS.
- M. M. Hatlo and L. Lue, Soft Matter, 2008, 4, 1582–1596 RSC.
- R. Szparaga, C. E. Woodward and J. Forsman, Soft Matter, 2015, 11, 4011–4021 RSC.
- M. M. Hatlo and L. Lue, Soft Matter, 2008, 4, 1582–1596 RSC.
- S. Stenberg, B. Stenqvist, C. Woodward and J. Forsman, Phys. Chem. Chem. Phys., 2020, 22, 13659–13665 RSC.
- J. Hautman, J. W. Halley and Y. Rhee, J. Chem. Phys., 1989, 91, 467–472 CrossRef CAS.
- C. Y. Son and Z.-G. Wang, Proc. Natl. Acad. Sci. U. S. A., 2021, 118, e2020615118 CrossRef CAS PubMed.
- I.-C. Yeh and M. L. Berkowitz, J. Chem. Phys., 1999, 111, 3155–3162 CrossRef CAS.
- P. Sinha, I. Szilagyi, F. J. Montes Ruiz-Cabello, P. Maroni and M. Borkovec, J. Phys. Chem. Lett., 2013, 4, 648–652 CrossRef CAS PubMed.
- F. J. M. Ruiz-Cabello, G. Trefalt, Z. Csendes, P. Sinha, T. Oncsik, I. Szilagyi, P. Maroni and M. Borkovec, J. Phys. Chem. B, 2013, 117, 11853–11862 CrossRef CAS PubMed.
- G. M. Torrie and J. P. Valleau, J. Chem. Phys., 1980, 73, 5807–5816 CrossRef CAS.
- B. Jönsson, H. Wennerström and B. Halle, J. Phys. Chem., 1980, 84, 2179 CrossRef.
Footnotes |
| † Electronic supplementary information (ESI) available: Here, we describe the way in which normal pressures are calculated. We also provide examples of ion distributions. See DOI: 10.1039/d1sm01520f |
| ‡ Similar arguments have led to the standard coarse-grained treatment of repulsive (often hard-sphere) interactions between monomers in a “good solvent” polymer solution model. |
| This journal is © The Royal Society of Chemistry 2022 |

