DOI:
10.1039/D1SM01350E
(Paper)
Soft Matter, 2022,
18, 1801-1818
From dynamic self-organization to avalanching instabilities in soft-granular threads†
Received
17th September 2021
, Accepted 20th December 2021
First published on 15th February 2022
Abstract
We study the dynamics of threads of monodisperse droplets, including droplet chains and multi-chains, in which the droplets are interconnected by capillary bridges of another immiscible liquid phase. This system represents wet soft-granular matter – a class of granular materials in which the grains are soft and wetted by thin fluid films—with other examples including wet granular hydrogels or foams. In contrast to wet granular matter with rigid grains (e.g., wet sand), studied previously, the deformability of the grains raises the number of available metastable states and facilitates rearrangements which allow for reorganization and self-assembly of the system under external drive, e.g., applied via viscous forces. We use a co-flow configuration to generate a variety of unique low-dimensional regular granular patterns, intermediate between 1D and 2D, ranging from linear chains and chains with periodically occurring folds to multi-chains and segmented structures including chains of finite length. In particular, we observe that the partially folded chains self-organize via limit cycle of displacements and rearrangements occurring at a frequency self-adapted to the rate of build-up of compressive strain in the chain induced by the viscous forces. Upon weakening of the capillary arrest of the droplets, we observe spontaneous fluidization of the quasi-solid structures and avalanches of rearrangements. We identify two types of fluidization-induced instabilities and rationalize them in terms of a competition between advection and propagation. While we use aqueous droplets as the grains we demonstrate that the reported mechanisms of adaptive self-assembly apply to other types of soft granular systems including foams and microgels. We discuss possible application of the reported quasi-1D compartmentalized structures in tissue engineering, bioprinting and materials science.
I. Introduction
Self-assembly, understood as spontaneous formation of well-defined ordered structures from independent building blocks, may be classified either with respect to the nature of the final states, i.e., equilibrium versus non-equilibrium (corresponding to the so-called static or dynamic self-assembly, respectively1,2), or with respect to the way that the final states are achieved: either spontaneously, i.e., via thermal equilibration, or with support of an external and directed input of energy. The externally driven self-assembly offers a particularly promising route towards engineering of new materials at various length scales as, with the additional external control parameters, it allows more control over the targeted structures. Apparently, it is this kind of self-assembly that we observe in living systems, which are out of equilibrium and constantly dissipating energy. Further understanding of this approach may bring us closer to understanding the emergence of complexity in biological systems and possibly even the origin of life itself.3
It was recently proposed as a general principle4 that the external energy input leads to durable non-equilibrium states by forcing the system to cross a sequence of particularly high energy barriers. Such arrested non-equilibrium states, imposed via external drive, are necessarily associated with adsorption and dissipation of particularly large amounts of energy. This leads to ‘dissipative adaptation’4 in which the system self-adapts in order to reach the states with possibly high local energy barriers. In such a process, non-trivial complex conformations of the system—the actual targets of self-assembly—may be reached only when the energy scale associated with the external drive matches the height of the energy barriers. Otherwise—with too weak external drive—the system may not rearrange at all, whereas with too strong excitation—it is swept towards a global free energy minimum. Similar conclusions apply to the timescales: the timescale associated with externally induced stress-buildup should match the one associated with internal stress relaxation. In principle, such scenarios may apply both at the nanoscale—in systems characterized by thermal noise, e.g., in chemical networks5,6—as well as at the mesoscale, e.g., in non-Brownian soft-glassy systems such as compressed emulsions—in which stochasticity is associated with ‘frozen’ structural disorder. In the latter case, to our knowledge, adaptive self-assembly under external drive has never yet been explored.
In this work we show how the presence of metastable states, i.e., local energy wells, in a quasi-1D soft-granular system supports adaptive self-assembly under external drive. We use microfluidics (Fig. 1a) to steadily generate a chain of aqueous droplets carried by an external viscous flow; the fluid supply plays the role of the external drive. The droplets adhere to each other due to the presence of a small amount of a third liquid phase (oil), immiscible with both the droplet and the external phases, forming capillary bridges between the droplets. Capillary arrest results in formation of ordered elastic threads. The external flow (fluorinated fluid) can be tuned to provide steady convection of a single-file structure, i.e., a perfectly linear chain of droplets (Fig. 1d, S9). However, when the rate of flow is slightly lowered, the viscous forces start to compress the chain longitudinally. We observe that the accumulated elastic energy is then released via buckling and folding of the chain onto itself. The process is repetitive resulting in a regular spatiotemporal pattern (Fig. 1d, S7–8); the frequency of folding depends on the rate of elastic stress build-up, where the latter, as we show, scales linearly with the ratio fgen/fadv of the rates of droplet generation (fgen) and of their free advection by the external flow (fadv). Finally, we also report the formation of segmented granular structures such as granular clusters (Fig. 1d, S1) including internally ordered clusters (Fig. 1d, S2), finite chains (Fig. 1d, S10–12), double-chains (Fig. 1d, S3), etc.
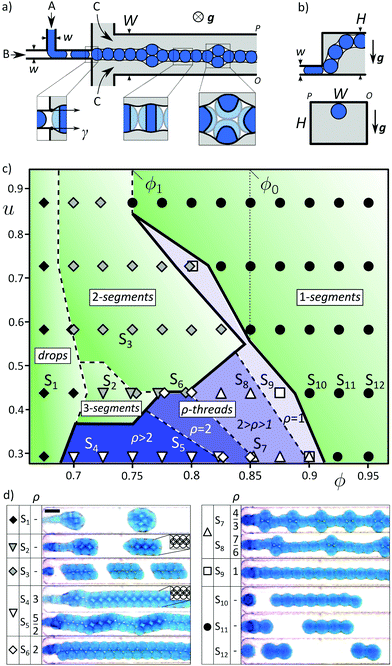 |
| | Fig. 1 Generation of threads and clusters of monodisperse droplets via interplay of capillary arrest and viscous forces. (a) Layout of the microfluidic device: a T-junction serially combined with a co-flow geometry; double-emulsion (A/B/C) jets are generated with high volume fraction ϕ = QA/(QA + QB) of the ‘core’ phase A in the ‘shell’ phase B; the resulting morphology is a chain of droplets connected by thin capillary bridges. (b) The side-views in the directions transverse and parallel to the flow. (c) Stability diagram spanned by ϕ and the parameter u = QC/(QA + QB)×(w2/WH) being the ratio of cross-sectionally averaged rates of flow of the external phase and the dispersed phases. (d) Micrographs of the observed structures and the associated structural indices ρ (thread thicknesses, ρ = N/(N – Nfold) where N, Nfold are the number of droplets and the number of folds, respectively). Channel dimensions are w = 150 μm, W = H = 900 μm. The scale bar is 500 μm. We used QA + QB = 1.5 mL h−1 which corresponds to Ca = 2.56 × 10⁻². | |
Our experimental setup follows standard formats: microfluidic formulation of double-emulsions, where drops engulf multiple smaller immiscible droplets, has been studied for over a decade.7–9 Here, however, we consider the unusual case of a very small amount of the engulfing phase, such that it only forms thin films around the encapsulated droplets resulting in formation of the adhesive capillary bridges. This scenario, as already noted, results in tight packing of the droplets and formation of quasi-solid elastic structures.10,11 In our previous work11 we reported generation of finite polyhedral clusters and studied their geometric characteristics such as point-group symmetries. Here, we study the dynamics of structure formation, in particular focusing on high-aspect-ratio quasi-1D structures emerging via interplay of capillary arrest and external viscous forces.
We further examine the limits of mechanical stability of the structures upon either (i) increasing the rate of the external flow up to elasticity-limited scission of the threads into finite chains of length N (Fig. 1d, S10–12), or (ii) lowering the strength of capillary arrest by decreasing the volume fraction ϕ of the aqueous droplets in the encapsulating oil phase below a threshold ϕ0 resulting in avalanche-like droplet rearrangements. Based on the semi-empirically determined internal fluidity of the threads Ψ(ϕ), we predict the full stability diagrams in (ϕ,fadv)-space for various sets of fluids in good agreement with experiments.
Overall, we report a variety of dynamic phenomena in a system composed of monodisperse close-packed droplets wetted by another immiscible liquid phase. We propose that such structures are representative of a wider class of materials which we refer to as wet soft-granular matter that is distinct from wet granular matter with rigid grains,12,13 examples including wet sand or granular pastes. Deformability of the grains facilitates rearrangements and supports flow of the material under external stresses, while capillary arrest stabilizes the once-formed structures against spontaneous rearrangements in the absence of such stresses.
The paper is organized as follows. After describing the experimental setup (Section II) we report a typical stability diagram (Section III.1), discuss general conditions for stability and explain the mechanism behind the structure formation (Section III.2). Next, we focus on various types of dynamic instabilities and, based on a semi-empirical formula for the effective thread fluidity Ψ(ϕ), we predict the full stability diagrams in good agreement with the experiments (Section III.3). We summarize our findings in Section IV and discuss the results and application perspectives in Section V. We present additional data and derivations in Appendices A and B followed by a summary table of variables in Appendix C.
II. Experimental setup
We fabricated the microfluidic channels via micro-milling in polycarbonate plates, which were subsequently thermally bonded at 130 C under the pressure of 2 bars. We supplied the liquids to the microfluidic chip either via syringe pumps or via pressurized containers (Elveflow OB1 Mk3). We used three immiscible liquid phases: water with Methylene Blue at 0.1% w/w as the drop phase (A), a mixture of hexadecane, silicone oil (viscosity 5 cSt) and a non-ionic surfactant SPAN80 in w/w ratio 30![[thin space (1/6-em)]](https://www.rsc.org/images/entities/char_2009.gif) :70:1 as the middle (shell) phase (B) and hydrofluoroether Novec 7500 (set I) or fluorocarbon fluid FC40 (set II) as the external phase (C). In order to enhance wetting of the walls by the fluorinated phase we used commercially available fluorophilic coating (Aculon or 3M Novec 1720). The densities of the dispersed phases were {ρA, ρB} = {1.00, 0.87} g cm−3 and viscosities {ηA, ηB} = {1.0, 4.0} cP, whereas ρC = 1.61 g cm−3, ηC = 1.2 cP or ρC = 1.82 g cm−3, ηC = 4.1 cP for sets I or II, respectively. By using the pendant drop method we measured interfacial tensions to be γAB = 3.4 mN m−1, γAC = 49 mN m−1, and γBC = 0.9 mN m−1 (set I) or γAB = 3.4 mN m−1, γAC = 51 mN m−1, and γBC = 4.9 mN m−1 (set II). To simplify notation we further denote γBC ≡ γ, ηC ≡ η, and γAB ≡ γA. The effective Bond number of a single aqueous droplet, accounting for interfacial tensions of both interfaces A–B and B–C, can be calculated as Bo = (ρC − ρA)ga2/(γA + γ) with a being the droplet radius. In the reported experiments such calculated Bo was of the order 10−2. We note that our requirement for the choice of the three phases A, B, C was that (i) the phases are all immiscible, (ii) the interfacial tensions obey γA + γ < γAC, ensuring that the engulfing morphology is mechanically stable,14–16 (iii) the external phase wets the walls. In particular, the reason for adding silicone oil to the middle phase B was that it lowered γ (even by a factor of 5) without significantly altering the remaining interfacial tensions.
:70:1 as the middle (shell) phase (B) and hydrofluoroether Novec 7500 (set I) or fluorocarbon fluid FC40 (set II) as the external phase (C). In order to enhance wetting of the walls by the fluorinated phase we used commercially available fluorophilic coating (Aculon or 3M Novec 1720). The densities of the dispersed phases were {ρA, ρB} = {1.00, 0.87} g cm−3 and viscosities {ηA, ηB} = {1.0, 4.0} cP, whereas ρC = 1.61 g cm−3, ηC = 1.2 cP or ρC = 1.82 g cm−3, ηC = 4.1 cP for sets I or II, respectively. By using the pendant drop method we measured interfacial tensions to be γAB = 3.4 mN m−1, γAC = 49 mN m−1, and γBC = 0.9 mN m−1 (set I) or γAB = 3.4 mN m−1, γAC = 51 mN m−1, and γBC = 4.9 mN m−1 (set II). To simplify notation we further denote γBC ≡ γ, ηC ≡ η, and γAB ≡ γA. The effective Bond number of a single aqueous droplet, accounting for interfacial tensions of both interfaces A–B and B–C, can be calculated as Bo = (ρC − ρA)ga2/(γA + γ) with a being the droplet radius. In the reported experiments such calculated Bo was of the order 10−2. We note that our requirement for the choice of the three phases A, B, C was that (i) the phases are all immiscible, (ii) the interfacial tensions obey γA + γ < γAC, ensuring that the engulfing morphology is mechanically stable,14–16 (iii) the external phase wets the walls. In particular, the reason for adding silicone oil to the middle phase B was that it lowered γ (even by a factor of 5) without significantly altering the remaining interfacial tensions.
The device operated as follows. An array of droplets (A in B), generated at a T-junction with a narrow outlet channel (w × w in cross-section, w = 150 μm), entered a wide channel (W × H = 900 μm × 900 μm or 1300 μm × 800 μm) filled with phase C (see Fig. 1a). At the entrance to the wide channel the B–C interface was formed encapsulating the droplets of phase A. The emerging double-emulsion drop was then stretched by the co-flowing external phase. As the outer phase C was much denser than both phases A and B, the droplets were always slightly pressed against the upper wall of the channel by buoyancy (Fig. 1b).
In the analysis of the structures (Fig. 1–3) we focus mainly on the set of fluids with higher γA/γ (set I) for which we observed richer metastability and thus a wider variety of different flow patterns.
 |
| | Fig. 2 Repetitive self-folding of the chain of droplets in the external co-flow. (a) Experimental snapshots showing droplet rearrangements and steady advection of the generated structure. Scale bar is 500 μm. (b and c) Schematic representation of the elastic energy (b) and longitudinal compressive stress in the chain (c) as functions of the number of generated droplets, n = 1,2,…, corresponding to the configurations shown in panel (a). When the strain reaches the ‘yield stress’ σy, the chain folds (c). | |
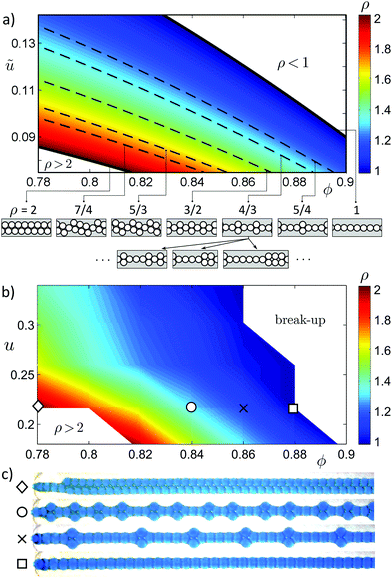 |
| | Fig. 3 Steady-state stability diagram of ρ-threads with 1 < ρ < 2. (a) Theoretical color-coded map ρ(ϕ,ũ) (eqn (6)), where ũ = fadv/f0 = C0u with f0 = (QA + QB)/w3 and where C0 is a ‘mobility’ coefficient depending on the channel geometry and droplet shape (eqn (17), eqn (11)). Isolines ũρ(ϕ) (eqn (7)) for several chosen ρ are indicated. The pictograms display ‘minimal’ structures, i.e., those with the shortest possible ‘unit cell’ containing either a single fold followed by k droplets arranged in single file (ρ = 1 + k−1) or a single droplet followed by k neighboring folds (ρ = 2 − k−1), where k = 1,2,…. Several alternative non-minimal ‘unit cells’ are displayed for comparison at ρ = 4/3. (b) Experimental map ρ(ϕ,u) obtained for the channel W = 1300 μm, H = 800 μm. The map was probed at 7 different ϕ-values and 5 different u-values. Comparison of panels (a and b) leads to an estimate C0 ≈ 0.4. (c) Snapshots of the observed structures. Note that the sequences of folds are not strictly periodic. | |
III. Results
III.1. Experimental stability diagram
Classification of the structures.
Depending on the volumetric flow rates QA, QB, and QC of the three immiscible phases we observed various patterns, from compound drops to jets of different internal structure. We choose to classify the patterns for a fixed QA + QB in terms of the remaining two independent parameters: the volume fraction ϕ = QA/(QA + QB) of the droplets in the jet and the ratio u = Uext/U0 (see Fig. 1c) where Uext = QC/(WH) is the approximate flow speed of the external phase (more precisely the background flow, i.e., at QA + QB = 0) and U0 = (QA + QB)/w2 the characteristic flow speed of the dispersed phases (A and B combined), i.e., we have u = QC/(QA + QB)×(w2/WH). While ϕ serves as a control parameter for the internal structure, u determines the level of extensional viscous stresses acting on the jet (it must be noted, however, that ϕ also determines the frequency of generation of the droplets, i.e., the frequency of their ‘feeding’ to the jet). Finally, we also define the capillary number as Ca = ηU0/γ = η(QA + QB)/(γw2). Note that, in this definition, we use the viscosity of the external phase η together with the speed of the dispersed phase U0; accordingly, Ca is the capillary number characteristic of the external flow around the droplets.17 We now turn to the description of the observed flow patterns for fixed QA + QB (fixed Ca) for set I.
At low ϕ (ϕ ≲ 0.7), the effects of packing were weak and the compound jet behaved similarly to a simple viscous jet breaking up into drops,18,19 with the difference that the drops in our case were in fact a double emulsion,11 see Fig. 1d, panel S1. With increasing ϕ, the engulfed droplets started ordering along the direction of the flow resulting in transformation of drops into quasi-solid 2-segments (S2) or 3-segments (S3). For u ≲ 0.5 we observed further transitions into continuous threads (S4–S9) of average thickness ρ, which we term ρ-threads, with droplets locally arranged in parallel rows. We define ρ = N/(N − Nfold), where N is the total number of droplets in the thread and Nfold the number of ‘folded’ droplets. Accordingly, the structures S4, S6, S9 correspond, respectively, to integer thicknesses ρ = 3, 2, 1, whereas the structures S5, S7, S8 correspond to the fractions ρ = 5/2, 4/3, 7/6.
Types of instabilities.
In the cases 1 < ρ < 2, upon increasing u, we found two distinct mechanisms of thread breakup depending on ϕ. For ϕ < ϕ0 we observed spontaneous folding of the threads resulting in their fragmentation into finite 2-segments (S3; we further distinguish two sub-types of this type of instability, see the detailed analysis in Section III.3); for ϕ > ϕ0 increasing u caused gradual thinning of the threads (S6–S9) down to single-file 1-threads (S9), which subsequently broke into 1-segments (S10–S12). The number N of droplets in each 1-segment decreased with increases of either ϕ or u until reaching N = 1 single core–shell drops. We found that the critical volume fraction ϕ0 corresponding to the transition between the two unstable regimes depended on the ratio of surface tensions γA/γ (in Fig. 1c we present the data for set I, γA/γ = 3.8, for which we found ϕ0 ≃ 0.85; for set II, γA/γ = 0.7, we found ϕ0 ≃ 0.95, cf.Fig. 5a and 6b). Finally, we observed stable 1-threads also along a thin strip in the (ϕ,u)-space entering the regime ϕ < ϕ0 at high u. Those structures lost stability for ϕ < ϕ1 where ϕ1, similar to ϕ0, also depended on γA/γ (we found ϕ1 ≃ 0.75 for set I, ϕ1 ≃ 0.87 for set II, cf.Fig. 5b).
 |
| | Fig. 4 Generation of 1-segments. (a) Time-series snapshots showing generation of a 1-segment (set II, γA/γ = 0.7). (b) Extensional strain Dn/D2 − 1 of the n-th droplet in (another) 1-segment just before detachment from the inlet; Dn is the length of the droplets measured along the chain axis, where n = 1,…,N and n = 2 is taken as a reference (n = 1 corresponds to the droplet at the tip which has a different shape). (c–h) The length N of the generated 1-segments versus u for various sets of fluids, ϕ and Ca, with color code explained in the legend in panel (i). In each plot, the different curves correspond to ϕ = 0.85, 0.875, 0.9, 0.925, 0.95 from right to left, as indicated by the arrow in panel (d). In panel (e) ϕ-values of isolated symbols have been marked, whereas the encircled data correspond to ϕ = 0.75, 0.775, 0.8 from top to bottom. In panels (c–h) the data with N ≤ 3 (below the horizontal dotted line) as well as the data encircled in panel (e) are excluded from further analysis. (i) The data collapse after multiplying N by Ca(1 − δ*)2/[(1 − ϕ)2/3(1 − δ)] and plotting as a function of Δu = u – ϕ(1 − ϕ)(H/w)(1 − δ)/β0 (see eqn (18)) with the droplet deformation parameters δ, δ* (eqn (11) and (12)) extracted directly from experiments (see Fig. 10b and main text for details). Inset (j) shows β0 fitted to the data separately for each Ca. | |
 |
| | Fig. 5 Threshold volume fractions ϕ0 (a) and ϕ1 (b) calculated numerically using Surface Evolver. Shaded intervals on the ϕ-axis correspond to the cases θ ∈ [0,π/4]. Horizontal thin dashed line in (b) indicates the exact asymptotic result ϕ1 = 2/3 for the case of a chain of touching rigid spheres (θ = 0, γA/γ = ∞). | |
 |
| | Fig. 6 Three types of dynamic instabilities of the threads and the predicted full dynamic stability diagrams. (a) Finite thread (set I, ϕ = 0.75) spontaneously folding at a constant rate faval = dL/dt. (b) Effective fluidity Ψ(ϕ) = faval(ϕ)/faval,max extracted from the measured dL/dt where faval,max is taken to be the average of faval(ϕ) measured for ϕ ≤ ϕ1. Data for both set I (black circles) and set II (red squares) are shown. Solid lines correspond to eqn (21) with fitted ϕ0, ϕ1. Shaded ϕ-intervals indicate ϕ0, ϕ1 calculated numerically (see Fig. 5) with θ in the range [0,π/4]. (c) Time-series snapshots of the three types of instabilities (see Movies S2b, S3 and S4, ESI†). (d)–(f) Predicted stability diagrams in (ϕ,ũ)-space with ũ = fadv/f0 based on eqn (7), (21), (24) and (27) for the internal capillary number of the thread in the fluid state (eqn (26)) equal (d) Caint,fluid = 5.9, (e) Caint,fluid = 7.8 and (f) Caint,fluid = 23.5. | |
Energy and stress landscape.
In the remaining part of the paper we focus on ρ-threads with 1 < ρ < 2. Such structures formed via repetitive folding of linear 1-threads that is via local rearrangements of the droplets happening shortly after they entered the wide channel (Fig. 2a and Movie S1, ESI†). At ϕ > ϕ0 the generated structures were stable and steadily advected downstream without any further folding or alteration of the structure. In those cases ρ − 1 may be interpreted as the linear density of folds (taking droplet size as unit length). We observed that the structures remained stable even after switching the external flow off. We associate this stability with a finite energy barrier ΔEfold for folding. We demonstrated in our previous work11 that such a barrier emerges due to deformation of the droplets at contact. We expect this barrier to be significantly smaller than the barrier ΔEunfold for unfolding (as unfolding requires stretching and breaking of the capillary bridges). Accordingly, the elastic energy of a ρ-thread as a function of the number n of the generated droplets consists of oscillations superimposed with an overall downward drift (Fig. 2b). As the system overcomes the energy barriers, internal compressive stress is periodically released (Fig. 2c). Hence, folding of the chain can be interpreted in terms of repetitive yielding to the external viscous stress occurring each time the latter exceeds the corresponding ‘yield stress’ σy (Fig. 2c).
III.2. Mechanism of formation of ρ-threads
Steady formation of ρ-threads via stress-free advection.
In order to understand the formation of the variety of structures shown in Fig. 1d we note, again, that in the case of stable ρ-threads (S4–S9 in Fig. 1d and 2a) the structures, once formed, remain stationary in the co-moving frame, i.e., the droplets collectively translate with a constant velocity along the channel without further rearrangements (Fig. 2a). We also note that the structures are soft and thus capable of sustaining only limited longitudinal stresses. Hence, it is reasonable to assume that the net viscous stresses acting on a steadily generated ρ-thread vanish. This condition implies that the rate of growth of the thread fρ: = dLρ/dt, where Lρ = N − Nfold is the non-dimensional length, must equal the rate fadv of the force-free advection of the droplets by the external flow, i.e., the inverse of the time after which a single droplet is displaced along the channel by the distance equal to its length D (measured in the direction along the channel, see, Fig. 2a). We note that, since the droplets get compressed by the other droplets in the chain, in general we have D < 2a, where a is the radius of an undeformed spherical droplet. The condition of the steady advection impliesBased on the above requirement and considering that the droplets are generated at a T-junction, in the following we derive a stability condition for ρ-threads in terms of u and ϕ for a given ρ.
Transitions between different structures in the steady-state.
First, we note that, since Lρ = N/ρ and dN/dt ≡ fgen, we haveEqn (1) and (2) lead to ρ = fgen/fadv. Accordingly, the linear density of folds, or equivalently the frequency of folding expressed as a multiple of fadv, reads ρ − 1 = fgen/fadv − 1.
In order to determine ρ(ϕ,u) we estimate fgen and fadv as functions of ϕ and u. First, we note that fgen = 3QA/(4πa3), where a, in general, is set by QA and QB. However, for the case of a T-junction in the dripping regime it is known20 that a is set solely by the volume fraction ϕ (at least for capillary numbers ≳10−3,21 a condition which holds in our experiments), namely we have
| |  | (3) |
which leads to:
where
f0 =
U0/
w is a natural frequency scale (well approximating the upper bound on the frequency of droplet generation at a T-junction). In order to estimate
fadv, we first note that the Reynolds number, defined as Re
= ρC(
QA +
QB)/(
ηw), is small (of the order 10
−2–10
−1), which implies a linear dependence of
fadv on
Uext (in general, this conclusion is valid as long as the droplets do not change their shape upon variation in
Uext; we do not observe any such shape changes). Since
QA +
QB = const we may write
where
C0 is a non-dimensional ‘mobility’ coefficient of the droplets at the wall (see also
eqn (17)), which for
a/
W ≪ 1,
a/
H ≪ 1 turns out to be nearly independent of the droplet size
a (see Appendix A)
i.e., as independent of
ϕ, and where we introduced a shorthand notation
ũ for the advection frequency
fadv rescaled with
f0.
Overall, eqn (1)–(5) determine a relation between ũ, ϕ and ρ. In particular, we find
Accordingly, the isolines set by
ρ(
ϕ,
ũ) = const =
ρ are given by
Eqn (6), plotted in
Fig. 3a with solid lines given by
eqn (7), qualitatively reproduces the main features of the experimentally observed stability map
ρ(
ϕ,
u) in the regime corresponding to
ρ-threads with 1 ≤
ρ ≤ 2, see
Fig. 3b.
Interpretation in terms of dynamic self-adaptation.
We note that the condition Δfρ = 0 is equivalent to the requirement that the net hydrodynamic drag FH experienced by each of the droplets vanishes, FH = 0. From the linearity of the Stokes equations FH must be linear in ΔUρ: = −DΔfρ, i.e., in the difference between the advection velocity and the actual translational velocity of the droplets. Those two velocities in general may differ since the droplets are pushed (or pulled) by the other droplets in the chain. This leads to a stabilizing negative-feedback loop: if, at any given rates of flow, initially ρ is such that Δfρ > 0, implying FH < 0, the viscous forces compress the thread longitudinally. As a result, the droplets rearrange more frequently such that ρ increases, decreasing fρ, which in turn restores the condition Δfρ = 0. Similarly, if initially Δfρ < 0, implying FH > 0, the thread is stretched, which leads to less frequent rearrangements, i.e., decreasing ρ until, again, Δfρ = 0. In other words, the frequency of droplet rearrangements self-adapts such that the net extensional viscous stresses acting on the generated structure vanish.
III.3. Limits of stability: from elasticity-limited scission to avalanching instabilities
Scission of 1-threads at high u.
We now turn to the regime in the (ϕ,u)-space in which 1-threads break into 1-segments. In general, due to the linearity of the Stokes equations, net hydrodynamic drag per unit length of a 1-thread can be expressed as αηΔU where we denoted ΔU ≡ ΔU1 and where α is an unknown drag coefficient. Accordingly, the drag force FH per droplet can be written as:
In the steady state we have ΔU = 0. However, if the external flow is suddenly raised such that ΔU > 0 (FH > 0), the already single-file structure cannot further unfold and we expect the chain to break into finite 1-segments (Fig. 4a).
Prior to breakup we observe that the longitudinal deformation of the droplets in the chain, calculated as (Dn–D2)/D2, linearly increases upstream (n = 1,…,N labels consecutive droplets; we take n = 2 as a reference since n = 1 corresponds to the droplet at the tip of the chain which is of a different shape than the other droplets, see Fig. 4a and Movie S2a, ESI†). We observe that the breakup happens directly at the inlet, at the point of the highest strain. Yet, we never observe fission of the droplets but rather breakup of the capillary bridge connecting the upstream-most droplet to the inlet. Accordingly, the critical force balance can be written as
where
F(N)H is the hydrodynamic drag per single droplet in a chain of length
N and
Fc,max is the maximal force of the capillary adhesion of the chain to the inlet. In the following we neglect ‘end effects’ associated with the finite size of the chain so that
F(N)H =
FH. However, since the chains are unsteady, we need to take into account (linear) variations in droplet extensional deformation along the chain. Accordingly, in
eqn (8) we replace droplet length in the steady state
D with the average length of the droplets in the chain at breakup,
i.e.,
D* = (
D +
Dmax)/2, where
Dmax is the critical (maximal) deformation at breakup (see
Fig. 4a), and Δ
U with Δ
U* =
D*(
fadv −
fgen). Altogether this leads to
| | | F(N)H = αηD*2(fadv − fgen). | (10) |
We note that, in general, we expect
D as well
D* to depend on
γA/
γ and
ϕ but not on
N. In particular, we expect that
ϕ sets only the volume of the droplet,
i.e., its free diameter 2
a but not the shape. Accordingly, one can write
D = 2
a(1 −
δ),
D* = 2
a(1 −
δ*) with the droplet deformation parameters
We expect both
δ and
δ* to depend on
γA/
γ but not on
ϕ. Indeed, our Surface Evolver calculations show that the dependence of
δ on
ϕ is negligible (see
Fig. 10c) and we expect the same conclusion to hold for
δ*. Accordingly, in the following we assume
δ =
δ(
γA/
γ),
δ* =
δ*(
γA/
γ). In particular, based on the experimental images of the droplets at chain breakup, we estimate
D* ≃
D for set I and
D* ≃ 1.15
D for set II (that is
δ* ≃
δ and
δ* ≃ 1.15
δ − 0.15, respectively; for representative droplet shapes see
Fig. 6c-iii and 4a). Finally, we note that, due to the hydrodynamic interactions between the droplets, the coefficient
α in general may also depend on
N. In our analysis, for simplicity, we neglect the hydrodynamic interactions.
Considering Fc,max we assume that the capillary force holding the chain at the inlet to the channel acts along the contact line of the oil-external (B–C) interface at the wall of the (narrower) channel supplying the droplets. We assume that this contact line is pinned along the perimeter of the narrow channel so that its length equals 4w (Fig. 1a). Accordingly, we can estimate
Applying
eqn (9)–(13) and assuming
D ∼
w leads to the following scaling for the length
N of 1-segments:
| |  | (14) |
Note that
eqn (14) is valid for any type of a microfluidic junction generating droplets at a frequency
fgen. For the particular case of a T-junction we can further use
eqn (3) and (4) which together with
eqn (5) lead to:
| |  | (15) |
where we denoted
| | | Δu = u − ϕ(1 − ϕ)/C0 = u − ũ1(ϕ)/C0, | (16) |
which accordingly can be interpreted as the shift in
u relative to the 1-thread stability line.
Next, we consider a simple hydrodynamic bead-model of the chain (see Appendix A) in which the coefficient C0 can be expressed in terms of δ, w/H and h/a where h is the distance between the surface of the droplets and the upper wall. Assuming δ ≪ 1, w/H ≪ 1 and h/a ≪ 1, and upon neglecting the effect of the flattening of the droplets at the upper wall, we obtain
| |  | (17) |
where
β0 is a non-dimensional coefficient which in the assumed rigid-sphere model scales as
β0 ∼ 1/ln(
a/
h) (see
eqn (A.12)). In general, one may expect
h to depend on Ca (
e.g.,
via the hydrodynamic lift forces
22). However, since in our experiments Ca was not significantly varied (
i.e., by less than one order of magnitude) and since the dependence on
h enters only
via its logarithm, we further neglect the dependence of
β0 on Ca. Further, since
h is not directly accessible in experiment, we leave
β0 as a fitting parameter of the model. In experiment, we find no large variations in
β0 as a function of Ca or
γA/
γ,
cf.Fig. 4j, which confirms consistency of our model.
Using eqn (17), eqn (15) attains the final form where the dependence on γA/γ enters via δ and δ* and
| | 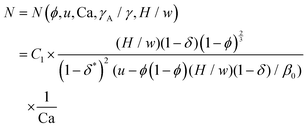 | (18) |
with a constant
C1 given by
| |  | (19) |
Note that since
β0 ∼ 1/ln(
a/
h) and
α ∼ ln(
a/
h) (
eqn (A.14), (A.15)), the logarithmic terms cancel out in
eqn (19) and
C1 remains a finite constant for
h/
a → 0. Using the analytical solution for the Poiseuille flow in a rectangular channel
23 and an exact solution for the flow past a sphere next to a wall,
24C1 can be evaluated exactly (
eqn (A.16)) with the result
C1 = 3.4 × 10
−2.
In order to compare the theoretical predictions of eqn (15) and (18) with the experimental data, we first fitted β0 separately to each dataset N(ϕ,u) collected for different Ca and γA/γ (different sets of fluids), such that in each case the scaling N ∼ Δu−1 (see eqn (15)) was best reproduced (we had the total of 6 datasets: 3 for set I and 3 for set II, Fig. 4c–h; we used δ = 0.23 for set I and δ = 0.51 for set II, see also Fig. 10b). We found β0 to be nearly constant, i.e., varying within less than 15% for different Ca and γA/γ. Further, we also found that after multiplying N by Ca(1 − ϕ)−2/3(1 − δ*)2(1 − δ)−1 (see eqn (18)) and plotting versus Δu all the data collapsed onto a master curve (Fig. 4i). This shows that C1 indeed is approximately a constant independent of Ca and γA/γ. We found the best-fit value C1 = 1.4 × 10⁻² (Fig. 4i, solid line) which remains of the same order of magnitude as the theoretical estimate, yet significantly smaller. One may ascribe the discrepancy to several factors such as (i) the use of the rigid-sphere approximation, which neglects flattening of the droplets at the upper wall (Bond and capillary numbers are small but finite), (ii) the hydrodynamic slip at the liquid–liquid interfaces, as well as (iii) droplet ‘rolling’ at the upper wall.25,26 Taking all of these factors into account should lower C1. We note however that hydrodynamic interactions between the droplets (which we neglected) effectively weaken the drag per droplet (due to the hydrodynamic screening effect), so that including them would presumably raise C1.
Avalanching instabilities and quasi-1D solid-fluid transition.
We now consider the situations in which the structures lose their quasi-solid characteristics and fold spontaneously (that is, without longitudinal compression). We observed that such spontaneous folding always happens at sufficiently low volume fractions ϕ and results in folding ‘avalanches’, i.e., steadily propagating rearrangement waves. In particular, we find that ρ-threads spontaneously fold for ϕ < ϕ0, except for the case with ρ = 1 in which the threads remain stable down to ϕ = ϕ1 where ϕ1 < ϕ0. In the regime ϕ1 < ϕ < ϕ0, the emergence of a single fold always initiates a rearrangement wave. We interpret the emergence of spontaneous rearrangements in terms of a quasi-1D solid-fluid transition of the initially capillary-arrested granular threads. We discuss further details below.
Critical volume fractions ϕ0, ϕ1.
Let us first consider the case of a 1-thread. In this case, at sufficiently large ϕ, the capillary bridges remain disconnected and the chain remains linearly stable with respect to the lateral droplet displacements which can be quantified in terms of the bond angle ψ (Fig. 11b). The critical bond angle ψ1 at which the neighboring capillary bridges merge (Fig. 11c) depends on ϕ, γA/γ, and on the equilibrium Young's contact angle between the droplets θ, see inset in Fig. 5a (θ was non-zero in the experiments because the surfactant in the intermediate oil phase formed bilayers between the droplets; for further discussion see Appendix B). The condition ψ1(ϕ,γA/γ,θ) = 0 corresponds to a transition to a linearly unstable configuration and so yields the critical volume fraction ϕ1(γA/γ,θ). We calculated ϕ1 for various θ via numerically minimizing the surface energy of liquid interfaces under volume constraint using the software Surface Evolver (Fig. 5b, see Appendix B for details). We found ϕ1 to be a monotonically decreasing function of γA/γ, approaching a finite asymptotic value ϕ1 = 2/3 for γA/γ → ∞, i.e., for the case of rigid spheres (this value is calculated as the ratio of a volume of a sphere to the volume of a circumscribing cylinder).
In the case of a ρ-thread with at least a single fold (ρ > 1) the critical bond angle ψ0 can be expected to be smaller than ψ1 because the droplets at the fold form a finite angle ψfold (see Fig. 11d). We use the approximation ψ0 = ψ1 − ψfold with ψfold ≃ π/6. The condition ψ0(ϕ,γA/γ,θ) = 0 yields ψ1(ϕ,γA/γ,θ) ≃ π/6 which determines ϕ0(γA/γ,θ). Accordingly, ϕ0 can be approximately calculated (Fig. 5a) based on the equilibrium shape of droplets in a 1-thread (we expect this approximation to be precise for γA/γ ≫ 1 but possibly underestimating the value of ϕ0 for γA/γ ≲ 1).
1D fluidity.
We observed that the avalanches of rearrangements always propagated at a constant rate faval := dL/dt depending only on ϕ, but not on u or Ca. We analyzed the cases of chains not attached to the inlet, i.e., freely advected by the flow, see Fig. 6a. We consistently found faval to be nearly constant for ϕ < ϕ1 and gradually decreasing to zero within the interval ϕ1 < ϕ < ϕ0 (see Fig. 6b) where ϕ0 and ϕ1 were characteristic of a given set of fluids. These observations allow us to propose a semi-empirical formula| | | faval(ϕ) = faval,maxΨ(ϕ), | (20) |
with faval,max = faval(ϕ1) accounting for the maximum observed frequency of droplet rearrangements (also characteristic of a given set of fluids), and with Ψ(ϕ) being a non-dimensional scaling function, which we approximate as| |  | (21) |
(solid line in Fig. 6b) with ϕ0, ϕ1 set by γA/γ, θ, as discussed above. Accordingly, Ψ accounts for the effect of slowing down of the droplet rearrangements due to close-packing of the droplets in the threads and the emerging energy barriers.11 Using the terminology of soft glasses,27Ψ measures internal fluidity of the threads as they change from being solid-like (Ψ = 0) to liquid-like (Ψ = 1) upon decreasing ϕ from ϕ0 down to ϕ1.
Effective internal viscosity of the threads.
We note that a rearrangement wave can be interpreted in terms of the viscous relaxation of a 1-thread into a 2-thread under the action of the interfacial tension γ. Introducing an effective internal viscosity of the thread ηint the relaxation time τ associated with a change in length of the thread by a single droplet diameter can be estimated as τ = ηintw/γ, where w serves as a length scale approximating the size of a droplet. On the other hand we have τ = faval−1 such that the effective viscosity ηint can be directly expressed as a function of ϕ via:| |  | (22) |
where| |  | (23) |
is the effective viscosity of the thread at ϕ = ϕ1, i.e., in the fluid state (Ψ = 1). Upon approaching the solid state, ϕ → ϕ0, Ψ → 0, ηint(ϕ) diverges. Accordingly, in terms of soft-glasses, in this case we observe a transition analogous to a jamming transition.
Spontaneous folding-induced instabilities.
We find two different possible scenarios of folding-induced thread breakup which we refer to as absolute and contractive instabilities.
In the case when the folding front propagates upstream (Fig. 6c(i) and Movie S3, ESI†), it leads to absolute instability via accumulation of the droplets at the inlet and thread breakup. By analogy to viscous jets18 such regime can be interpreted as the ‘dripping’ regime. The stability criterion can be then expressed as ũ > (2 − ρ)−1faval/f0 where the factor (2 − ρ) is the fraction of the length of the ρ-thread in which the droplets are arranged in a single file and thus subject to folding (the remaining part of the thread is already ‘folded’). Accordingly, the equality ũ = (2 − ρ)−1faval/f0 sets the critical stability condition. Assuming fixed Ca one can use the relation ρ = ϕ(1 − ϕ)/ũ (eqn (6)) which then determines the transition line ũcrit,1(ϕ) in (ϕ,ũ)-space such that for ũ > ũcrit,1 the threads become advectively stable (i.e., the folding front is advected downstream and no breakup occurs), which can be interpreted as ‘jetting’, and below which they are absolutely unstable. We find
| |  | (24) |
where we introduced the “Strouhal number” of a spontaneously folding thread in the fluid state
(originally the Strouhal number applies to the high-Reynolds number flows and is defined as St =
fL/
U, where
f is the frequency of vortex shedding from an object of size
L and
U is the flow speed). For the pattern to be stable, the droplets must rearrange slower than they are advected, whereas they can be advected no faster than they are generated. Therefore, the condition St < 1 may be interpreted as a necessary approximate requirement for threads to be advectively stable (for the evolution of the stability diagram upon varying St for a given
Ψ(
ϕ),
i.e., for a given set of fluids, see
Fig. 6d–f; in practice, such variation can be achieved
via changing the net rate of flow
QA +
QB which sets
f0). We further note that the Strouhal number may be also expressed as St =
γ/(
ηint,fluidU0) such that St
−1 can be interpreted as the effective internal capillary number of the thread in the fluid state,
| | | Caint,fluid := ηint,fluidU0/γ = St−1. | (26) |
Hence, advective stability of the thread requires roughly Ca
int,fluid > 1. Further, from
eqn (24), we find that for Ca
int,fluid ≫ 1 (St ≪ 1), see
Fig. 6f, the transition line
ũcrit,1(
ϕ) approaches the 2-thread stability line, which in turn widens the advectively stable regime (v) (see below for discussion of the various regimes). For Ca
int,fluid ≪ 1 (St ≫ 1) we have
ũcrit,1(
ϕ)≫ 1 so that regime (v) vanishes; in such a case, stable threads may only be observed for
ϕ >
ϕ0. We note, again, that the notion of the effective capillary number reveals an analogy to simple viscous jets in which increasing the capillary number stabilizes jetting against dripping.
18 On the other hand, the simple viscous jets are never actually stable, as even the slowly developing advected instabilities finally lead to thread breakup far downstream. In contrast, in our case, the advected rearrangements do not lead to thread breakup but rather to its thickening,
i.e., formation of a 2-thread structure downstream which may remain stable (depending on the actual value of
ϕ; further folding into 3-threads or formation of amorphous aggregates is possible for low enough
ϕ, see the ‘drops’ regime in
Fig. 1c).
The second instability scenario refers to a contraction-induced breakup (Fig. 6c(ii) and Movie S4, ESI†). At folding, tensile stresses caused by local contraction of the thread may result in its breakup upstream the folding front. In order to quantitatively understand such instability, which we further refer to as contractive instability, let us consider a finite thread advected by the external flow and not attached to the inlet. In such a case, rearranging droplets pull on the free ends of the thread effectively decelerating the droplets downstream and accelerating the droplets upstream. In general, because of the friction at the wall, the acceleration/deceleration depends on where exactly along the thread the rearrangement happens; in particular, in a very long thread, if the droplets rearrange close to one end, effectively only the droplets at this end are affected. In our case, folding is typically initiated close to the inlet, so that we can assume that the velocity of the droplets upstream the folding front increases by Dfaval. Accordingly, in order for the newly generated droplets to keep up with those already accelerated, the rate of droplet generation fgen/f0 must equal or exceed ũ + faval/f0. Combined with eqn (4) and (20) this leads to the following estimate for the corresponding transition line:
| | | ũcrit,2(ϕ) = ϕ(1 − ϕ) − StΨ(ϕ). | (27) |
For
ũ > ũcrit,2 the threads break under contraction and thus are contractively unstable whereas for
ũ < ũcrit,2 they are contractively stable (though they still can be absolutely unstable). Again, also in this type of instability, we find that taking Ca
int,fluid ≫ 1 or Ca
int,fluid ≪ 1 respectively widens or narrows the advectively stable regime (v).
Full stability diagrams; comparison with experiment.
The full dynamic stability diagram, spanned by ϕ and ũ, is given by eqn (7), (24), (27), see Fig. 6d. We note that the diagram is fully determined by two material parameters ϕ0, ϕ1 and a single ‘dynamic’ control parameter Caint,fluid. We may distinguish three unstable regimes: (i) absolutely unstable, (ii) contractively unstable and (iii) scission (the latter corresponding to elasticity-limited breakup of 1-threads into 1-segments) and two stable regimes: (iv) absolutely stable (no spontaneous rearrangements occur) and (v) advectively stable (rearrangements are advected downstream, but no breakup occurs) where the boundary between the regimes (iv) and (v) is set by the 1D-jamming point at ϕ = ϕ0. We find that Caint,fluid impacts only the advectively stable regime (v) as well as absolutely and contractively unstable regimes (i) and (ii); upon increasing Caint,fluid, the low-ϕ boundary of regime (v), determined by the crossing of the transition lines ũcrit,1(ϕ) and ũcrit,2(ϕ), is shifted towards lower ϕ (see Fig. 6e and f). Accordingly, the stable regime (v) expands at the expense of the unstable regimes (i) and (ii).28
Finally, we compare the calculated diagrams with the experimental data for various Ca and the two different sets of fluids (Fig. 7a–d). We note that the fluidity functions Ψ(ϕ) are in both cases well approximated by eqn (21). In the case of set I (γA/γ = 3.8), we find ϕ0 = 0.85 and ϕ1 = 0.75 (Fig. 6b), with faval,max = 23 s−1. Accordingly, the cases Ca = {2.56, 1.7, 0.85} × 10−2 correspond to Caint,fluid = {5.4, 3.6, 1.8}, respectively, which allows us to theoretically predict the corresponding stability diagrams. We obtain a reasonable agreement between theory and experiment (Fig. 7a–c), particularly good in the case Ca = 2.56 × 10⁻² (Fig. 7a). In the cases Ca = 1.7 × 10⁻² and Ca = 0.85 × 10⁻² (Fig. 7b and c) in the experiment we observed other types of instabilities not considered in the model (such as spontaneous breakup of 1-threads directly into 3-segments or clusters, see Fig. 1d, structures S1, S2). We attribute formation of such more compact structures to a diminished role of the extensional viscous stresses at low Ca.
 |
| | Fig. 7 Stability diagrams: comparison with experiment. The meaning of the symbols is the same as in Fig. 1c except for the open circles (solid red and dotted black) additionally indicating the observed type of instability (advective or contractive, respectively). (a–c) Experimental data for set I at Ca = {2.56, 1.7, 0.85} × 10−2, respectively. (d) Experimental data for set II at Ca = 1.54 × 10⁻². The model is based on the fluidity function Ψ(ϕ) based on ϕ0, ϕ1 measured separately for set I and set II (Fig. 6b). In particular, we obtain {ϕ0, ϕ1} = {0.85, 0.75} for set I (a–c) and {0.925, 0.875} for set II (d). | |
In the case of set II (γA/γ = 0.7) we find ϕ0 = 0.975 and ϕ1 = 0.875 (Fig. 6b), with faval,max = 48 s−1. Accordingly, the cases Ca = {1.54, 1.03, 0.51} × 10−2 correspond to Caint,fluid = {2.6, 1.7, 0.9}, respectively. Independently of the capillary number, we hardly observe any stable ρ-threads (except for 1-threads observed at Ca = 1.54 × 10⁻², see Fig. 7d; data for lower Ca not shown) which we attribute to the fact that (i) in this case the predicted stable regime (iv) is not experimentally accessible (T-junction cannot generate droplets at ϕ > 0.975) and (ii) that the calculated internal capillary number Caint,fluid is close to 1 which strongly narrows the advectively stable regime (v).
Overall, we conclude that the stability of ρ-threads preferably requires ‘soft-shell/hard-core’ configurations, i.e., γA/γ > 1, such as in set I.
IV. Summary
In summary, we have studied dynamic self-organization of droplets into stable soft-granular threads, i.e., elongated quasi-1D structures (Fig. 1) achievable via interplay of capillary arrest and rearrangements under external viscous co-flow. We have also investigated the limits of stability of the structures and established two dynamic regimes depending on the degree of confinement of the aqueous droplet ‘cores’ within an oil ‘shell’ set by the volume fraction ϕ. At ϕ > ϕ0, i.e., when the capillary bridges of oil between the droplets are thin and disconnected from each other, strong confinement leads to quasi-1D jamming, i.e., trapping of droplets in local energy minima, which results in solid-like structures (Fig. 2a). In this regime, at low flow rates of the external phase, quantified by the flow speed ratio u, resulting in longitudinal compression of the threads, the droplets repetitively rearrange, i.e., the system jumps over local energy barriers (Fig. 2b and c) with predictable frequency, set by u. The corresponding cycles of droplet displacements and rearrangements lead to formation of ρ-threads with periodically (or nearly periodically) occurring folds, ρ − 1 being linear fold density per droplet (Fig. 3). Once-folded, the chains are steadily advected downstream without any further droplet rearrangements and the structure remains stable even after the external flow was stopped.
In contrast, for ϕ < ϕ0, we observe the development of spontaneous rearrangements: such structures are no longer capable of supporting internal elastic stresses and collapse. We observe avalanches of rearrangements (Fig. 6) propagating along the threads at a rate depending, for a given set of fluids, only on ϕ0 − ϕ, that is on the distance from the jamming point ϕ0, where the latter, in turn, depends on the ratio of interfacial tensions γA/γ of the core and shell phases (Fig. 5a). We introduce the effective internal viscosity of the thread ηint(ϕ) (eqn (22)) scaling inversely proportional to the speed of such avalanches and diverging at the jamming point ϕ0 (at which rearrangements cease).
In this regime we find two types of instabilities: absolute instability in which the rearrangement wave propagates upstream resulting in thread breakup, and contractive instability in which the droplets are pulled upstream by the contracting (folding) part of chain which results in thread separation from the inlet (Fig. 6d). In the case when the folding front is advected downstream the threads remain advectively stable (the propagating rearrangements does not lead to thread breakup but rather to formation of a stable 2-thread). Transition between absolute instability and advective stability is controlled by “the Strouhal number” St of the thread (eqn (19)). We argue this transition by analogy to the case of simple viscous jets18 with the difference that in the case of granular threads the fluidity Ψ depends on the degree of packing of the droplets in the thread set by ϕ. As in the case of viscous jets we find that increasing the internal capillary number of the thread in the fluid state Caint,fluid, where in our case Caint,fluid = St−1, has a stabilizing effect on the thread in the sense of widening the advectively stable regime (see Fig. 6d–f for theoretical predictions and Fig. 7a–c for experiment). Considering the contractive instability, we find it to be directly linked to the underlying granular structure of the threads, apparently not having any direct counterpart neither in Newtonian nor non-Newtonian jets.29
V. Discussion
From the point of view of basic physics, we report a rather unique type of dynamic self-organization: as the granular threads are generated de novo ‘grain-by-grain’, the reported quasi-1D morphologies in general differ from the equilibrium or out-of-equilibrium morphologies generated in systems consisting of a fixed number of particles.30–34 Also, the reported structures do not globally minimize free energy, so that one may exploit multiple metastable configurations via simple tuning of the applied rates of flow. Our system offers a rare example of athermal, non-equilibrium self-assembly with signatures of ‘dissipative adaptation’.4
It is noteworthy that quasi-linear systems capable of gradual stress release, analogous to the one described above, are ubiquitous in nature, particularly at the nanoscale. In molecular systems, single atoms or other molecular subunits such as monomers, etc., naturally constitute discrete building blocks which lead to ratchet-like free-energy and stress-release landscapes. Examples include crystallizing polymer chains,35 stochastically contracting actin fibers in the cytoskeleton,36 unfolding single protein molecules37 or DNA strands.38 Moreover, the characteristic pattern of repetitive stress release can also be observed at the macroscale in catastrophic events such as earthquakes39 or wildfires.40
Comparison with other types of self-assembling jets and threads
Periodically folding viscous jets have been previously reported in external decelerating co-flows generated by a gradually widening channel.19 However, the folded patterns were typically unstable and constantly evolved upon being advected. Qualitatively, we find that the structural self-adaptation of ρ-threads in our experiments is actually more reminiscent of the behavior of the droplet-decorated spider silk fibers,41 in which the droplets ‘spool in’ the excess fiber in order to support a constant tension.
In fact, scission of 1-threads into finite 1-segments in accelerating external co-flows also resembles the behavior of an elastic solid fiber rather than a viscous jet. In particular, the observed scaling of the length N of the segments (Fig. 4) agrees with a model assuming a tensile-strength limited breakup, see eqn (14) (for additional exact formulas, valid specifically for droplets generated at a T-junction, see eqn (15) and (16)), similar to the previously reported case of solidifying polymer jets.42
Comparison with previous reports of ‘flowing crystals’
We note that the examples of dynamic self-organization of monodisperse droplets or bubbles into various ordered structures in external flows were already reported before, see ref. 43 for an overview. In those cases the structures were imposed by the confining walls and/or by hydrodynamic interactions at a distance, so that such structures typically would not persist without a background flow. The structures based on recurring droplet rearrangements were first reported by Thorsen et al.44 who observed linear arrays of droplets developing repetitive perturbations while flowing down a narrow channel (such emergent droplet superstructures resembled to some extent the folded chains that we report here). Ordered quasi-2D flowing foams were later also reported by Garstecki et al.45,46 and Raven et al.47 While Garstecki reported limit cycles of bubble rearrangements resulting in predictable spatiotemporal patterns, Raven characterized the dynamic transition between the different patterns, in particular between the ‘hex-one’ and ‘hex-two’ structures, (resembling 1-threads and 2-threads reported here, respectively). The transition involved propagation of a rearrangement wave resulting in either advective or absolute instability, or else in a dynamic coexistence of hex-one and hex-two structures (apparently such coexistence is characteristic only of a pressure-controlled bubble system; we did not observe any such coexistence in our system). Since in our experiments the droplets are confined inside the encapsulating film of oil rather than by the walls (though the droplets slid at the upper wall), the dynamics of rearrangements is controlled not by the friction at the walls, as in Raven's report, but rather by the viscous dissipation in the thin films of oil between the droplets. In particular, the thin-film dominated type of dissipation is evidenced by the vanishing of the rate of rearrangements faval(ϕ) as the volume fraction ϕ approaches the jamming point at ϕ0 (eqn (20) and (21), Fig. 6b). We leave the detailed explanation of such behavior, including the actual functional form of Ψ(ϕ), as well as the impact of the material parameters on faval,max, for future studies.
Extension to general wet soft-granular-systems
We further argue that the reported structures represent a wider class of materials that we term wet soft-granular matter in which soft grains such as droplets,10,11 bubbles48,49 or hydrogel beads50,51 close-pack under capillary forces. In comparison to wet granular matter with rigid grains, such as wet sand, deformability of the particles introduces additional degrees of freedom and facilitates rearrangements which altogether allow externally driven self-assembly.
We reported such self-assembly in the case of droplets ordering into threads, but we find that the underlying mechanism of quasi-1D structure formation is generic in the sense that it is applicable to any type of soft-granular system with (i) short-range attractions, (ii) constant rate of feeding of the grains, and (iii) constant rate of advection of the grains. We expect the details—such as the type of grains (e.g., droplets, bubbles, soft-solid particles) or the feeding/advection mechanism—to be irrelevant. For example, the advection could also be provided by the friction at a steadily translating substrate, rather than by the external flow. In fact, we performed an additional experiment in which we used a T-junction to generate air bubbles in liquid gelatin stabilized with cetyltrimethylammonium bromide (CTAB) surfactant at 0.5% w/v concentration. The bubbles were sequentially extruded onto a substrate in a form of a folding chain. The substrate was cooled down to 5 °C which led to rapid solidification of the gelatin and permanent stabilization of the structure (Fig. 8a–d; we previously used the same setup to print multi-layered bubble structures, see ref. 52). We note that generation of free-standing droplet- or bubble chains (analogous to our 1-threads) within a crosslinking hydrogel as the encapsulating phase was already demonstrated before by Chaurasia et al.,53–57 but their method relied on extrusion of droplets/bubbles into a static aqueous bath whereas the extensional forces were provided by buoyancy rather then by viscous flows.
 |
| | Fig. 8 Other types of wet soft-granular structures including clusters and chains of bubbles or microgels. (a) Schematics of a bubble printing setup. (b–d) Solidified ρ-threads of air bubbles in gelatin stabilized by CTAB surfactant extrusion-printed at a glass substrate cooled down to 5 °C, where (b) fgen = U/D, ρ = 1, or (c and d) fgen > U/D, ρ > 1. (e) A fluorescence-microscopy snapshot from generation of clusters of solid TRITC-labelled GelMA beads (fluorescent) in liquid GelMA shell (6% w/v GelMA in PBS, non-fluorescent) at a T-junction. The continuous phase is Novec 7500 + 2% w/w PFPE–PEG–PFPE. (f) Generated clusters (N ≲ 6), (g) short chains (N = 3–5), (h) longer chains (N = 6–9) as well as a twisted/bent 2-thread. Scale bar: 500 μm (b–d) and 200 μm (e–i). | |
Potential applications in tissue engineering
Capillary arrest of soft-solid particles into chains or clusters remains of particular interest in tissue-engineering,58 mainly in the context of generation of compartmentalized 3D cell culture scaffolds.50,51,58–62 Capillary self-assembly of all-hydrogel structures consisting of solid-hydrogel ‘cores’ inside liquid-hydrogel ‘shell’ was proposed over a decade ago by Du et al.50 as an efficient strategy towards fabrication of such scaffolds. In this context, we believe that the structures reported in the current work could be further exploited in 3D cell culture, and as such find applications in high-throughput screening, drug discovery or diagnostics. The currently available hydrogel-bead assembly techniques suffer from rather low reproducibility50 and/or low throughput.62 Our work indicates that that the microfluidic approach, drawing from the steadiness of the applied rates of flow and precise localization of viscous stresses, could allow generation of granular hydrogel structures—also those previously unattainable—such as N-segments (N > 1) and ρ-threads (ρ > 1) with unprecedented reproducibility.
In order to experimentally check the possibility of using hydrogel beads in capillary self-assembly of elongated granular all-hydrogel structures we performed another proof-of-concept experiment in which we fed one channel of a microfluidic T-junction with a dense (ϕ ∼ 75%) suspension of gelatin-methacryloyl (GelMA) beads (which we generated in a separate experiment via UV-crosslinking of microfluidic droplets, a standard microbead-preparation method63) suspended in liquid non-crosslinked GelMA precursor (6% aqueous solution of GelMA), and the other channel with Novec 7500, see Fig. 8e. We observed formation of both regular clusters as well as metastable chains and threads of beads connected by capillary bridges of liquid GelMA (see Fig. 8f–i for experimental snapshots; details of these experiments will be published elsewhere). The experiment demonstrates the possibility of ordering of the elastic particles in a way similar to droplets. Yet, we find that the control over the generated structures in this case is limited due to spontaneously emerging flow inhomogeneities inside the bead-supplying microchannel (clogs, avalanches etc.). We believe that solving this technological problem could open way to controlled fabrication of compartmentalized all-hydrogel structures, and we leave it for future studies.
Other possible applications
Finally, we discuss the perspectives of further miniaturization of the system, i.e., the possibility of generating the droplet thread-like structures at the colloidal length scale. In principle, since the capillary and viscous forces dominate at the microscale, we expect that the reported mechanisms of flow-assisted self-assembly should remain valid also in this regime. In fact, fabrication of granular chains consisting of spherical beads of diameter down to 15 μm connected by capillary bridges was reported recently.64 Generation of droplets as well as double-droplets down to single microns in diameter using microfluidics is challenging but feasible.65,66 The most important remaining challenge is retaining the precise control over the flow rates at the scale nL h−1. In previously reported micron-sized droplet generators,65,66 typical generation frequencies varied in the range 103–104 s−1. If the droplets self-assembled into chains at this rate this would correspond to an impressive generation rates of up to 10 cm s−1 in terms of chain length which could open way to industrial fabrication of internally ordered, compartmentalized microfibers for various applications, besides tissue engineering also in fabrication of new photonic or granular-electronic microdevices.34,67,68
Author contributions
JG conceived and performed experiments with droplets in a co-flow channel, analyzed data, developed a theoretical model and wrote the manuscript. RB performed additional droplet experiments, MCo performed bubble-printing experiments, MCw performed microgel experiments. PG and HAS analyzed data and edited the manuscript.
Conflicts of interest
A patent application (by J. Guzowski, R. Buda, M. Costantini) considering printing of droplets and bubbles at a substrate has been filed by IPC PAS to the Polish Patent Office.
Appendix A
A.1. Calculation of the coefficients C0, β0
In order to determine C0 we first consider an infinite chain of droplets (1-thread) resting at the upper wall of a channel of rectangular cross section (W × H), along its longitudinal vertical mid-plane (Fig. 9), with externally imposed low-Reynolds number flow characterized by viscosity η and the net volumetric flow rate QC. From the linearity of the Stokes equations, the expression for the drag force per droplet can be in general written aswhere Uext = QC/(HW). Accordingly, the quantity FH/D = βηUext may be interpreted as a linear viscous force density acting on the chain, which then defines the drag coefficient β. In order to estimate β we apply the so-called bead-model in which we replace the actual chain of droplets by a chain of touching rigid spheres, each of diameter 2a = D/(1 − δ) with δ ∈ [0,1]. In general, the reason for using the bead model is that it allows us to use the exact expressions for the hydrodynamic drag on a sphere in confined geometries (e.g., at the wall24). In the bead model, linear force density may be expressed as F(sph)H/(2a) where F(sph)H is the force per sphere, i.e., we haveIn our model we neglect hydrodynamic interactions between spheres in the chain, which means that we assumewhere F(sph)H1 is the force acting on a single sphere in absence of other spheres.
In the case without any spheres the imposed velocity field v in the channel is directed everywhere along the channel, i.e., along the x-axis, so that v = v(y,z)ex, with y ∈ [−W/2,W/2] and z ∈ [0,H] denoting the transverse horizontal and vertical coordinates, respectively (Fig. 9). We note that due to the stick boundary conditions at the walls, the flow profile close to the upper wall at y = 0 (around the droplet) can be approximated as v(0,z) ≃(H − z)κ where κ is the local shear rate (i.e., around z = H). Accordingly, since a ≪ H, we can use the expression provided by Chaoui and Feuillebois24 for the drag on a single sphere resting in a shear flow at a distance a + h from a wall,
| | | F(sph)H1 = 6πfκxxηa(a + h)κ, | (A.4) |
where
fκxx (notation from ref.
24) is a non-dimensional coefficient which in general also depends on the thickness
h of the gap between the sphere and the wall. We assume
h = 0, for which ref.
24 provides the value
fκxx = 1.70.
 |
| | Fig. 9 Sketch of the configuration of a sphere fixed at the upper wall of a channel with flow imposed along the x-direction. Parabolic-like flow profile along the channel mid-plane (y = 0) is indicated by the small arrows. | |
 |
| | Fig. 10 Morphology of 1-threads. (a) Left: Experimental close-up view of a 1-thread at the moment the flow is stopped, t = 0; center: the same view after t = 4 s; formation of surfactant bilayers between the dropelts results in a finite contact angle θ ≈ π/4. (b and c) Deformation parameter δ = 1 − D/(2a) calculated numerically using Surface Evolver for ϕ = 0.925 and for droplet–droplet contact angles θ = 0 and π/4 (solid and dashed lines, respectively) as a function of γA/γ (b) and as a function of ϕ for γA/γ = 0.7 and 3.8 (c) (lower and upper curves, respectively). (d) Experimental snapshots (ϕ = 0.925) for set I and set II corresponding to the situation before and after formation of surfactant bilayers, shown together with the corresponding numerically calculated morphologies for γA/γ = 3.8 (set I) and 0.7 (set II) with θ = 0 or π/4. Water–oil, oil–external, and water–water interfaces (the latter being a surfactant bilayer) are indicated as blue, black and red lines, respectively. | |
 |
| | Fig. 11 (a) Schematics of the longitudinal cross-section through a single droplet in 1-thread with indicated interfaces SA1, SA2, SB, and SAA and the contact angle θ with a neighboring droplet. (b) Zig-zag displacement of the droplets in a chain with capillary bridges marked in grey. (c) Critical configuration of 1-thread just before folding. (d) Folded configuration with indicated angle ψfold. For rigid spheres (γA/γ = ∞, θ = 0), ψfold = π/6. (e) Critical configuration around a fold just before next folding event (such as in avalanche folding). In (c and e) the arrows indicates the points where the capillary bridges merge. | |
In order to compare eqn (A.1) and (A.4) we need to express Uext in terms of κ. To this end, we use the exact expression for the velocity field in a rectangular channel (ref. 23):
| |  | (A.5) |
where
Y =
y/
H and
Z =
z/
H; we also denote
ω =
W/
H and
v0 = 48
Uext/(π
3S0) where
| |  | (A.6) |
Remembering that, by definition,
κ = − (∂
v/∂
z)|
y=0,z=H, we obtain
| |  | (A.7) |
with
| |  | (A.8) |
Inserting
eqn (A.7) into
eqn (A.4), taking
h = 0, and using
eqn (A.1)–(A.3) we finally obtain:
| |  | (A.9) |
Next, in order to relate
β to the coefficient
C0 (see main text), we consider
eqn (8) in the main text in the situation with stationary droplets,
i.e., for
fgen = 0,
ρ = 1, for which we have
Recalling
eqn (5) we have
Uadv ≡
Dfadv =
DC0f0u = 2
C0a(1 −
δ)
Uext/
w; inserting into
eqn (A.10), and comparing with
eqn (A.1), we find
C0 =
βw/(2
αa(1 −
δ)) which together with
eqn (A.9) leads to
| |  | (A.11) |
Comparing with
eqn (17) in the main text we can identify
| |  | (A.12) |
A.2. Calculation of the coefficient α
In order to calculate α we consider eqn (8) in the main text in the case with a chain translating with velocity Ugen in a channel filled with quiescent fluid (fadv = 0, fgen > 0). One obtains the expression for the drag force per droplet in the form:Within the bead-model, after Chaoui,24 the force on a rigid sphere translating with velocity Ugen next to a wall can be written as F(sph,t)H1 = − 6πftxxηaUgen where the coefficient ftxx diverges logarithmically for small gaps h between the sphere and the wall,24ftxx ≃ −(8/15)ln(h/a).
From eqn (A.2)–(A.3) we have FH = F(sph,t)H1D/(2a) and comparing with eqn (A.13) we obtain
| |  | (A.14) |
| |  | (A.15) |
Accordingly, in the rigid-sphere approximation,
α ∼ ln(
a/
h), whereas
β0 ∼ 1/ln(
a/
h) so that
α diverges while both
C0 and
β0 vanish for
h/
a → 0.
A.3. Calculation of the coefficient C1
Finally, based on eqn (19), (A.14), (A.15) in the main text the coefficient C1 can be expressed as:| |  | (A.16) |
Note that since fκxx remains finite for h/a → 0, C1 also remains finite in this limit. The data presented in Fig. 4 correspond to the case W = H, so that ω = 1. In order to calculate S0 and S1 we truncate the series in eqn (A.6) and (A.8) at k = 201, with the result S0 = 0.422, S1 = 0.831, so that, with fκxx = 1.70, we finally obtain C1 = 0.034.
Appendix B
B.1. Morphology of 1-threads
We observed various morphologies of the droplets depending on γA/γ and ϕ. We also observed that the morphologies slightly evolved after switching off the flow. In particular the chains contracted by around 10–20% within few seconds (for set I) or few tens of seconds (set II). We associate this morphological transformation with drainage of the lubricating films of oil from between the droplets resulting in formation of stable facets at droplet–droplet contacts, presumably surfactant bilayers.69 Formation of a bilayer is associated with the release of surface energy ΔF. As a consequence the contact angle θ between the droplets, given by the Young-Dupree equation,69 cos(θ/2) = 1 − ΔF/(2γA), is finite. We measured the contact angle via image analysis to be θ ≈ 0 and θ ≈ π/4 before and after the drainage of the oil film between the droplets (which took around 10 s), respectively. The experimentally measured droplet deformation parameter δ as a function of γA/γ and ϕ is plotted in Fig. 10b and c (symbols), respectively, while the corresponding morphologies are shown in Fig. 10d. The data are in good agreement with numerical calculations (solid lines) which we describe below.
B.2. Numerical surface evolver calculations
We calculated the equilibrium shape of the liquid–liquid interfaces in a 1-thread using the software Surface Evolver.70 The software discretizes the interface (this corresponds to triangulation in 3D case and division into linear segments in 2D case) and iteratively moves the vertices following the steepest decent of the energy functional  under the constraint of fixed volumes of liquids. In the experiment we observed that the oil phase completely wet the aqueous droplets such that it formed a thin film around them. In such a case, considering a single droplet in the chain, one can distinguish only three types of interfaces: water–oil interface of surface tension γA, oil-fluorocarbon interface of surface tension γ, and the droplet–droplet contact area which can be associated with the surface tension γAA. Accordingly, we used the following functional:
| |  | (B.1) |
where SA, S, SAA denote the corresponding surface areas (Fig. 11a). We note that if the film of oil between the droplets was macroscopic (beyond the typical range of the disjoining pressure, say of thickness above 100 nm) one could use γAA = 2γA. In such a case the contact angle between the droplets would vanish. However, as already mentioned, in the experiment we observed a finite equilibrium contact angle θ between the droplets; the condition of mechanical equilibrium requires γAA = 2γAcos(θ/2). Accordingly, we use θ as the material parameter instead of γAA.
We also observed that the contact angle between the water–oil and oil–fluorocarbon interfaces was always close to zero. Thus, we assume that those interfaces did not interact (or interacted weakly); accordingly, we use γA + γ as the effective surface tension of the water–oil–fluorocarbon interface. We denote the corresponding surface area SA1. We also denote SA2 = SA − SA1 and SB = S − SA1 (Fig. 11a) such that eqn (B.1) can be rewritten as
| |  | (B.2) |
We minimized the functional in
eqn (B.2) under the constraint of fixed volumes of the aqueous and oil phases,
VA and
VB, respectively. Using the radius of an undeformed spherical drop
a as the unit length we have
VA = 4π/3 and
VB = (1 −
ϕ−1)4π/3. Accordingly, overall, the shape of the equilibrium liquid interfaces is governed by the three independent parameters
θ,
γA/
γ and
ϕ.
Due to the axial symmetry of the system we considered longitudinal cross-section of the chain which reduced dimensionality of the problem from 3D to 2D. The calculated droplet deformation parameter δ = 1 − D/2a is shown in Fig. 10b and c. Examples of the calculated equilibrium interfaces (cross-sections) are shown in Fig. 10d.
B.3. Numerical calculation of the threshold volume fractions ϕ1, ϕ0
Calculation of ϕ1.
We assume that upon a lateral zig-zag-like displacement of the droplets in a 1-thread (Fig. 11b), the chain folds whenever the bond angle ψ exceeds the maximal bond angle ψ1 for which the neighboring capillary bridges merge (Fig. 11c). Based on the equilibrium 1-thread configuration (Fig. 11a), with D1 denoting the length of the capillary bridge and D⊥ the height of the droplet, we find sin(ψ1/2) = (D − D1)/D⊥. Accordingly, ϕ1 solves the condition ψ1(ϕ,γA/γ,θ) = 0. The calculated ϕ1 as a function of γA/γ for θ = 0 and θ = π/4 is shown in Fig. 5b.
Calculation of ϕ0.
We note that the calculation of the critical volume fraction ϕ0 for a ρ-thread with ρ > 1, owing to a lack of axial symmetry in this case, in general requires setting up and solving a full 3D numerical model, computationally time consuming. Instead, for simplicity, we calculated ϕ0 approximately based on the results obtained for the 1-thread configuration described above. First, we assumed that the maximal bond angle ψ0 in the case with ρ > 1 can be approximated as ψ0 = ψ1 − ψfold, where ψfold is the angle formed by the droplets at the fold (Fig. 11d). We approximated ψfold = π/6 which is strictly valid only for rigid spheres (γA/γ = ∞, θ = 0). Finally, we determined the critical volume fraction ϕ0 = ϕ0(γA/γ,θ) from the condition ψ0(ϕ,γA/γ,θ) = 0, that is ψ1(ϕ,γA/γ,θ) = π/6. The calculated values of ϕ0 as a function of γA/γ for θ = 0 and θ = π/4 are shown in Fig. 5a.
Appendix C
Summary table of variables (in alphabetical order):
| Variable |
Description |
Ref. |
|
a
|
Radius of an unconfined droplet |
Eqn (3)
|
|
α
|
Hydrodynamic drag coefficient |
Eqn (8) and (A.14)
|
|
β
0
|
Mobility coefficient in the bead-model |
Eqn (A.12) and (A.15)
|
|
C
0
|
Hydrodynamic mobility coefficient |
Eqn (17) and (A.11)
|
|
C
1
|
Numerical prefactor |
Eqn (18), Eqn (19) |
| Ca |
Capillary number |
Ca = ηU0/γ |
| Caint,fluid |
Internal capillary number of the thread in the fluid state |
Eqn (26)
|
|
D
|
Length of a droplet in the chain |
Fig. 10
|
|
D
max
|
As above, maximal value just before breakup |
Fig. 4a and b
|
|
D* |
As above, average value just before breakup |
D* = (D + Dmax)/2 |
|
δ
|
Droplet deformation parameter |
Eqn (11), Fig. 10 |
|
δ* |
As above, average value just before breakup |
Eqn (12)
|
|
η
|
Viscosity of the external phase |
— |
|
η
int(ϕ) |
Effective internal viscosity of the thread |
Eqn (22)
|
|
η
int,fluid
|
Effective internal viscosity of the thread in the fluid state |
Eqn (23)
|
|
f
0
|
Frequency scale |
f
0 = U0/w |
|
f
adv
|
Frequency of droplet advection by the flow |
Eqn (5)
|
|
f
aval
|
Rate of propagation of an avalanche |
f
aval = dL/dt |
|
f
aval,max
|
As above, maximum value with respect to ϕ. |
f
aval,max = faval(ϕ1) |
|
f
gen
|
Frequency of droplet generation |
Eqn (4)
|
|
f
ρ
|
Thread linear growth rate |
Eqn (2)
|
| Δfρ |
Difference between the thread linear growth rate and the droplet advection frequency |
Eqn (1)
|
|
F
H
|
Hydrodynamic drag force on a droplet |
Eqn (8)
|
|
F
c,max
|
Capillary force holding the thread at the inlet |
Eqn (13)
|
|
ϕ
|
Volume fraction of droplets in the thread |
ϕ = QA/(QA + QB) |
|
ϕ
0
|
Critical lower volume fraction for stability of (ρ > 1)-threads |
Fig. 5a
|
|
ϕ
1
|
Critical lower volume fraction for stability of 1-threads |
Fig. 5b
|
|
γ
|
Interfacial tension between the outer and middle phase |
— |
|
γ
A
|
Interfacial tension between the droplet and middle phase |
— |
|
γ
AA
|
Interfacial tension of the droplet–droplet contact area |
— |
|
h
|
Distance between the droplet and the upper wall |
— |
|
H
|
Height of the channel |
— |
|
L
|
Length of the thread |
— |
|
N
|
Number of droplets in the chain |
Fig. 4a and c–i
|
|
N
fold
|
Number of ‘folded’ droplets |
— |
|
ψ
|
Bond angle between droplets in a chain |
Fig. 11b
|
|
ψ
0
|
Critical bond angle for (ρ > 1)-threads |
Fig. 11e
|
|
ψ
1
|
Critical bond angle for 1-threads |
Fig. 11c
|
|
ψ
fold
|
Bond angle at a fold |
Fig. 11d
|
|
Ψ(ϕ) |
Internal fluidity of the thread |
Eqn (21)
|
|
Q
A, QB, QC |
Volumetric rates of flow of the phases A, B, C |
— |
| Re |
Reynolds number |
Re = ρC(QA + QB)/(ηw) |
|
ρ
|
Average thickness of the thread in terms of droplet diameters |
ρ = N/(N − Nfold) |
|
ρ
C
|
Density of the external phase |
— |
| St |
The ‘Strouhal number’ of the thread |
Eqn (25)
|
|
θ
|
Young's contact angle between the droplets |
cos(θ/2) = γAA/2γA |
|
U
0
|
Dispersed-phase velocity scale (upper limit) |
U
0 = (QA + QB)/w2 |
|
U
adv
|
Speed of advection of droplets by the external phase |
U
adv = Dfadv |
|
U
ext
|
Average velocity of the external phase |
U
ext = QC/(WH) |
| ΔUρ |
Difference between the advection velocity and the actual velocity of the droplets |
ΔUρ = −DΔfρ |
|
u
|
Ratio of the cross-sectionally averaged rates of flow of the external the dispersed phases. |
u = Uext/U0 |
| Δu |
Shift in u relative to the 1-thread stability line u = ũ1(ϕ)/C0 |
Eqn (16)
|
|
ũ
|
Advection frequency fadv rescaled with f0 |
Eqn (5)
|
|
ũ
ρ
(ϕ) |
Isoline ρ(ϕ, ũ) = const |
Eqn (7)
|
|
ũ
crit,1(ϕ) |
Transition line in (ϕ, ũ)-space separating advectively stable and absolutely unstable regimes |
Eqn (24) |
|
ũ
crit,2(ϕ) |
Transition line in (ϕ, ũ)-space separating contractively stable and contractively unstable regimes |
Eqn (27)
|
|
w
|
Width and height of the channels at the T-junction |
— |
|
W
|
Width of the channel |
— |
Acknowledgements
JG acknowledges financial support from Polish Ministry of Science under Mobility Plus grant 1058/MOB/2013/0. MCw, MCo and RB acknowledge support within Foundation for Polish Science grant POIR.04.04.00-00-26C7/16-00 (previously First TEAM 2016-2/13). PG acknowledges support within the European Research Council Starting Grant 279647 and the Foundation for Polish Science Idee dla Polski program. HAS acknowledges support from NSF grant CMM1-1661672.
References
- G. M. Whitesides and B. Grzybowski, Self-assembly at all scales, Science, 2002, 295(5564), 2418–2421 CrossRef CAS PubMed.
- M. Fialkowski,
et al., Principles and implementations of dissipative (dynamic) self-assembly, J. Phys. Chem. B, 2006, 110(6), 2482–2496 CrossRef CAS PubMed.
- J. L. England, Statistical physics of self-replication, J. Chem. Phys., 2013, 139(12), 121923 CrossRef PubMed.
- J. L. England, Dissipative adaptation in driven self-assembly, Nat. Nanotechnol., 2015, 10(11), 919–923 CrossRef CAS PubMed.
- J. M. Horowitz and J. L. England, Spontaneous fine-tuning to environment in many-species chemical reaction networks, Proc. Natl. Acad. Sci. U. S. A., 2017, 114, 7565–7570 CrossRef CAS PubMed.
- T. Kachman, J. A. Owen and J. L. England, Self-Organized Resonance during Search of a Diverse Chemical Space, Phys. Rev. Lett., 2017, 119, 038001 CrossRef PubMed.
- A. S. Utada,
et al., Monodisperse double emulsions generated from a microcapillary device, Science, 2005, 308(5721), 537–541 CrossRef CAS PubMed.
- T. Nisisako, S. Okushima and T. Torii, Controlled formulation of monodisperse double emulsions in a multiple-phase microfluidic system, Soft Matter, 2005, 1(1), 23–27 RSC.
- L. Y. Chu,
et al., Controllable monodisperse multiple emulsions, Angew. Chem., Int. Ed., 2007, 46(47), 8970–8974 CrossRef CAS PubMed.
- S. H. Kim,
et al., Packing of Emulsion Droplets: Structural and Functional Motifs for Multi-Cored Microcapsules, Adv. Funct. Mater., 2011, 21(9), 1608–1615 CrossRef CAS.
- J. Guzowski and P. Garstecki, Droplet Clusters: Exploring the Phase Space of Soft Mesoscale Atoms, Phys. Rev. Lett., 2015, 114(18), 188302 CrossRef PubMed.
- S. Herminghaus, Dynamics of wet granular matter, Adv. Phys., 2005, 54(3), 221–261 CrossRef.
- N. Mitarai and F. Nori, Wet granular materials, Adv. Phys., 2006, 55(1–2), 1–45 CrossRef CAS.
- S. Torza and S. G. Mason, Coalescence of 2 immiscible liquid drops, Science, 1969, 163(3869), 813–814 CrossRef CAS PubMed.
- N. Pannacci,
et al., Equilibrium and Nonequilibrium States in Microfluidic Double Emulsions, Phys. Rev. Lett., 2008, 101(16), 164502 CrossRef PubMed.
- J. Guzowski,
et al., The structure and stability of multiple micro-droplets, Soft Matter, 2012, 8(27), 7269–7278 RSC.
-
U
0 well approximates the characteristic speed of the droplets in the wide channel in the case of elongated structures that are the main interest of this work. If one used Uext in the definition of Ca, it would lead to an overstimate since the droplets move slower than the average velocity Uext (since they are close to the wall; this is relevant in the case a ≪ H).
- P. Guillot,
et al., Stability of a jet in confined pressure-driven biphasic flows at low reynolds numbers, Phys. Rev. Lett., 2007, 99(10), 104502 CrossRef PubMed.
- T. Cubaud and T. G. Mason, Capillary threads and viscous droplets in square microchannels, Phys. Fluids, 2008, 20(5), 053302 CrossRef.
- P. Garstecki,
et al., Formation of droplets and bubbles in a microfluidic T-junction – scaling and mechanism of break-up, Lab Chip, 2006, 6(3), 437–446 RSC.
- P. M. Korczyk,
et al., Accounting for corner flow unifies the understanding of droplet formation in microfluidic channels, Nat. Commun., 2019, 10, 2528 CrossRef PubMed.
- C. A. Stan,
et al., The magnitude of lift forces acting on drops and bubbles in liquids flowing inside microchannels, Lab Chip, 2013, 13(3), 365–376 RSC.
-
H. Bruus, Theoretical Microfluidics, Oxford University Press, 2008 Search PubMed.
- M. Chaoui and F. Feuillebois, Creeping flow around a sphere in a shear flow close to a wall, Q. J. Mech. Appl. Math., 2003, 56, 381–410 CrossRef.
- S. Thutupalli,
et al., Why can artificial membranes be fabricated so rapidly in microfluidics?, Chem. Commun., 2013, 49(14), 1443–1445 RSC.
- C. M. Leong, Y. Gai and S. K. Y. Tang, Internal flow in droplets within a concentrated emulsion flowing in a microchannel, Phys. Fluids, 2016, 28(11), 112001 CrossRef.
- L. Bocquet, A. Colin and A. Ajdari, Kinetic Theory of Plastic Flow in Soft Glassy Materials, Phys. Rev. Lett., 2009, 103(3), 036001 CrossRef PubMed.
- Our model predicts that for
 (St > St*), where Caint,fluid*-1 = St* = 2ϕ1(1 − ϕ1)/3 is the solution to 2ũcrit,1(ϕ1) = ũcrit,2(ϕ1) (we find
  for set I and
  for set II), the regime (v) actually consists of two disconnected subregimes: one at for ϕ < ϕ1 and the other at ϕ > ϕ1 (see Fig. 6e). However, we expect that for ϕ < ϕ1 the predictions of the model may not be accurate due to the emergence of other types of instabilities in this regime, which we neglect in the analysis (such as the formation of 3-segments). In any case, it may be expected that for
  the threads are unstable for ϕ < ϕ*(Caint,fluid) independently of ũ, where ϕ* corresponds to the crossing of the transition lines, i.e., it is the solution to ũcrit,1(ϕ) = ũcrit,2(ϕ) (note that this equation may have two solutions; we consider only ϕ* > ϕ1).
- P. E. Arratia,
et al., The effects of polymer molecular weight on filament thinning and drop breakup in microchannels, New J. Phys., 2009, 11, 115006 CrossRef.
- P. Liu,
et al., Reconfigurable assembly of superparamagnetic colloids confined in thermo-reversible microtubes, Soft Matter, 2015, 11(31), 6201–6211 RSC.
-
J. Zhang, E. Luijten and S. Granick, Toward Design Rules of Directional Janus Colloidal Assembly, in Annual Review of Physical Chemistry, ed. M. A. Johnson and T. J. Martinez, 2015, vol. 66, pp. 581–600 Search PubMed.
- H. L. Cong,
et al., Current status and future developments in preparation and application of colloidal crystals, Chem. Soc. Rev., 2013, 42(19), 7774–7800 RSC.
- K. S. Khalil,
et al., Binary colloidal structures assembled through Ising interactions, Nat. Commun., 2012, 3, 794 CrossRef PubMed.
- L. Chen, B. Su and L. Jiang, Recent advances in one-dimensional assembly of nanoparticles, Chem. Soc. Rev., 2019, 48, 8–21 RSC.
- M. C. Zhang, B. H. Guo and J. Xu, A Review on Polymer Crystallization Theories, Crystals, 2017, 7(1), 4 CrossRef.
- J. E. Komianos and G. A. Papoian, Stochastic Ratcheting on a Funneled Energy Landscape Is Necessary for Highly Efficient Contractility of Actomyosin Force Dipoles, Phys. Rev. X, 2018, 8(2), 021006 CAS.
- P. J. Bujalowski and A. F. Oberhauser, Tracking unfolding and refolding reactions of single proteins using atomic force microscopy methods, Methods, 2013, 60(2), 151–160 CrossRef CAS PubMed.
- S. Nostheide,
et al., Unfolding kinetics of periodic DNA hairpins, J. Phys.: Condens. Matter, 2014, 26(20), 205102 CrossRef PubMed.
- D. Vere-Jones, Earthquake Prediction – A Statistician's View, J. Phys. Earth, 1978, 26, 129–146 CrossRef.
- E. A. Johnson and S. L. Gutsell, Fire frequency models, methods and interpretations, Adv. Ecol. Res., 1994, 25, 239–287 Search PubMed.
- H. Elettro,
et al., In-drop capillary spooling of spider capture thread inspires hybrid fibers with mixed solid-liquid mechanical properties, Proc. Natl. Acad. Sci. U. S. A., 2016, 113(22), 6143–6147 CrossRef CAS PubMed.
- C. Mercader,
et al., Kinetics of fiber solidification, Proc. Natl. Acad. Sci. U. S. A., 2010, 107(43), 18331–18335 CrossRef CAS PubMed.
- T. Beatus, R. H. Bar-Ziv and T. Tlusty, The physics of 2D microfluidic droplet ensembles, Phys. Rep.-Rev. Section Phys. Lett., 2012, 516(3), 103–145 Search PubMed.
- T. Thorsen,
et al., Dynamic pattern formation in a vesicle-generating microfluidic device, Phys. Rev. Lett., 2001, 86(18), 4163–4166 CrossRef CAS PubMed.
- P. Garstecki and G. M. Whitesides, Flowing crystals: nonequilibrium structure of foam, Phys. Rev. Lett., 2006, 97, 024503 CrossRef PubMed.
- P. Garstecki and G. M. Whitesides, Tessellation of a stripe, Phys. Rev. E: Stat., Nonlinear, Soft Matter Phys., 2006, 73, 031603 CrossRef PubMed.
- J. P. Raven and P. Marmottant, Microfluidic Crystals: Dynamic Interplay between Rearrangement Waves and Flow, Phys. Rev. Lett., 2009, 102(8), 084501 CrossRef PubMed.
- C. W. Visser,
et al., Architected polymer foams via direct bubble writing, Adv. Mater., 2019, 31(46), 1904668 CrossRef CAS PubMed.
- J. Wan and H. A. Stone, Microfluidic generation of a high volume fraction of bubbles in droplets, Soft Matter, 2010, 6, 4677–4680 RSC.
- Y. A. Du,
et al., Directed assembly of cell-laden microgels for fabrication of 3D tissue constructs, Proc. Natl. Acad. Sci. U. S. A., 2008, 105(28), 9522–9527 CrossRef CAS PubMed.
- J. E. Mealy,
et al., Injectable Granular Hydrogels with Multifunctional Properties for Biomedical Applications, Adv. Mater., 2018, 30(20), 1705912 CrossRef PubMed.
- M. Costantini,
et al., 3D-Printing of Functionally Graded Porous Materials Using On-Demand Reconfigurable Microfluidics, Angew. Chem., Int. Ed., 2019, 58(23), 7620–7625 CrossRef CAS PubMed.
- Y. Yu,
et al., Flexible Fabrication of Biomimetic Bamboo- Like Hybrid Microfi bers, Adv. Mater., 2014, 26(16), 2494–2499 CrossRef CAS PubMed.
- E. J. Um,
et al., Multicompartment microfibers: fabrication and selective dissolution of composite droplet-in-fiber structures, J. Mater. Chem. B, 2014, 2(45), 7866–7871 RSC.
- A. S. Chaurasia and S. Sajjadi, Flexible Asymmetric Encapsulation for Dehydration-Responsive Hybrid Microfibers, Small, 2016, 12(30), 4146–4155 CrossRef CAS PubMed.
- A. S. Chaurasia, F. Jahanzad and S. Sajjadi, Flexible microfluidic fabrication of oil-encapsulated alginate microfibers, Chem. Eng. J., 2017, 308, 1090–1097 CrossRef CAS.
- A. S. Chaurasia and S. Sajjadi, Transformable bubble-filled alginate microfibers via vertical microfluidics, Lab Chip, 2019, 19(5), 851–863 RSC.
- N. N. Kachouie,
et al., Directed assembly of cell-laden hydrogels for engineering functional tissues, Organogenesis, 2010, 6(4), 234–244 CrossRef PubMed.
- B. Zamanian,
et al., Interface-Directed Self-Assembly of Cell-Laden Microgels, Small, 2010, 6(8), 937–944 CrossRef CAS PubMed.
- L. Moroni,
et al., Biofabrication strategies for 3D in vitro models and regenerative medicine, Nat. Rev., 2018, 3, 21–37 CAS.
- H. P. Wang,
et al., Microrobotic Assembly of Shape-Customized Three-Dimensional Microtissues Based on Surface Tension Driven Self-Alignment, IEEE Trans. Nanotechnol., 2018, 17(4), 684–687 CAS.
- J. Cui,
et al., Fabrication of perfusable 3D hepatic lobule-like constructs through assembly of multiple cell type laden hydrogel microstructures, Biofabrication, 2019, 11, 015016 CrossRef CAS PubMed.
- A. Sheikhi,
et al., Modular microporous hydrogels formed from microgel beads with orthogonal thermo-chemical responsivity: Microfluidic fabrication and characterization, Methods, 2019, 6, 1747–1752 Search PubMed.
- Z. Rozynek,
et al., Formation of printable granular and colloidal chains through capillary effects and dielectrophoresis, Nat. Commun., 2017, 8, 15255 CrossRef CAS PubMed.
- F. Malloggi,
et al., Monodisperse Colloids Synthesized with Nanofluidic Technology, Langmuir, 2010, 26(4), 2369–2373 CrossRef CAS PubMed.
- L. Shui,
et al., Liquid crystallography: 3D microdroplet arrangements using microfluidics, Soft Matter, 2009, 5, 2708–2712 RSC.
- K. Xu, L. Qin and J. R. Heath, The crossover from two dimensions to one dimension in granular electronic materials, Nat. Nanotechnol., 2009, 4, 368–372 CrossRef CAS PubMed.
- M. Bayer,
et al., Optical Demonstration of a Crystal Band Structure Formation, Phys. Rev. Lett., 1999, 83(25), 5374–5377 CrossRef CAS.
- A. R. Thiam, N. Bremond and J. Bibette, From Stability to Permeability of Adhesive Emulsion Bilayers, Langmuir, 2012, 28, 6291–6298 CrossRef CAS PubMed.
- K. A. Brakke, The surface evolver and the stability of liquid surfaces, Philos. Trans. R. Soc., A, 1996, 354(1715), 2143–2157 CrossRef.
Footnote |
| † Electronic supplementary information (ESI) available. See DOI: 10.1039/d1sm01350e |
|
| This journal is © The Royal Society of Chemistry 2022 |
Click here to see how this site uses Cookies. View our privacy policy here. 
 Open Access Article
 This Open Access Article is licensed under a Creative Commons Attribution-Non Commercial 3.0 Unported Licence
 *a,
R. J.
Buda
a,
M.
Costantini
a,
M.
Ćwiklińska
a,
P.
Garstecki
a and
H. A.
Stone
*a,
R. J.
Buda
a,
M.
Costantini
a,
M.
Ćwiklińska
a,
P.
Garstecki
a and
H. A.
Stone


 under the constraint of fixed volumes of liquids. In the experiment we observed that the oil phase completely wet the aqueous droplets such that it formed a thin film around them. In such a case, considering a single droplet in the chain, one can distinguish only three types of interfaces: water–oil interface of surface tension γA, oil-fluorocarbon interface of surface tension γ, and the droplet–droplet contact area which can be associated with the surface tension γAA. Accordingly, we used the following functional: