
 Open Access Article
 This Open Access Article is licensed under a Creative Commons Attribution-Non Commercial 3.0 Unported Licence
Sensing of COVID-19 spike protein in nasopharyngeal samples using a portable surface plasmon resonance diagnostic system†
Hiba
Saada
a,
Quentin
Pagneux
a,
James
Wei
b,
Ludovic
Live
b,
Alain
Roussel
c,
Alexis
Dogliani
c,
Lycia
Die Morini
c,
Ilka
Engelmann
d,
Enagnon Kazali
Alidjinou
d,
Anne Sophie
Rolland
e,
Emmanuel
Faure
fg,
Julien
Poissy
h,
Julien
Labreuche
i,
Gil
Lee
j,
Peng
Li
j,
Gerard
Curran
j,
Anass
Jawhari
k,
Jhonny A.
Yunda
 l,
Sorin
Melinte
l,
Axel
Legay
l,
Jean-Luc
Gala
m,
David
Devos
e,
Rabah
Boukherroub
a and
Sabine
Szunerits
*a
l,
Sorin
Melinte
l,
Axel
Legay
l,
Jean-Luc
Gala
m,
David
Devos
e,
Rabah
Boukherroub
a and
Sabine
Szunerits
*a
aUniv. Lille, CNRS, Centrale Lille, Univ. Polytechnique Hauts-de-France, UMR 8520 – IEMN, F-59000 Lille, France. E-mail: sabine.szunerits@univ-lille.fr
bAffinité Instruments, Canada
cLaboratoire d'Ingénierie des Systèmes Macromoléculaires (LISM), Institut de Microbiologie, Bioénergies et Biotechnologie (IM2B), Aix-Marseille Université – CNRS, UMR 7255, Marseille, France
dUniv Lille, CHU Lille, Laboratoire de Virologie ULR3610, F-59000 Lille, France
eUniv. Lille, CHU-Lille, Inserm, U1172, Lille Neuroscience & Cognition, LICEND, Lille, France
fService Universitaire de maladies infectieuses – Hôpital Hutiez, CHU de Lille, F-59000, Lille, France
gUMR8204 U1019, Centre infection et immunité de Lille, Equipe Opinfield, Institut Pasteur de Lille, F-59800, Lille, France
hUniv. Lille, Inserm U1285, CHU Lille, Pôle de réanimation, CNRS, UMR 8576 – UGSF – Unité de Glycobiologie Structurale et Fonctionnelle, F-59000 Lille, France
iUniv. Lille, CHU Lille, ULR2694 METRICS: Évaluation des Technologies de Santé et des Pratiques Médicales, F 59000 Lille, France
jMagnostics, 2 Clifton Lane, Monkstown, County Dublin, Ireland
kBiosensing Diagnostics, 310 avenue Eugène Avinée, Parc Eurasanté Ouest, 59120 Loos, France
lUniversité catholique de Louvain, ICTEAM, Louvain-la-Neuve, Belgium
mUniversité catholique de Louvain, CTMA, Brussels, Belgium
First published on 5th July 2022
Abstract
Rapid, yet sensitive and accurate testing concepts are critical in the control of spreading diseases. With the COVID-19 pandemic still ongoing, the need for efficient, fast and accurate testing of the infection state of children and the elderly traveling as well as people with symptoms has not declined. Most current methods, which are highly sensitive, are rather slow and cannot be applied at the point of care. While rapid antigenic tests ascertain only high viral burden, here, we demonstrate an alternative, rapid point-of-care diagnostics with the ability to sense low viral loads. The goal of a portable and fast quantitative diagnostic device has been achieved via the use of VHH-72-Fc, a nanobody featuring high binding strength to the spike 1 glycoprotein of the SARS-CoV-2 viral envelope, a surface plasmon resonance sensing approach, and machine learning for predicting the cut-off value between positive and negative nasopharyngeal swab samples. The concept was validated on 119 nasopharyngeal samples, 50 positive and 69 negative, as identified by reverse transcription quantitative polymerase chain reaction (RT-qPCR) tests, showing a 88% positive percentage agreement and a 92% negative percentage agreement, as compared to RT-qPCR. Simple artificial neural network data processing revealed the influence in the sampling time to achieve unique performance in terms of speed, specificity and sensitivity. These sensing features combined with no sample preparation and portability of the diagnostic device suggest that this approach is well-adapted to be operated in hospital or laboratory located diagnostic centres.
1. Introduction
The recent pandemic caused by the severe acute respiratory syndrome coronavirus 2 (SARS-CoV-2) has highlighted the importance of analytical approaches, which are currently divided into rapid antigenic detection with limited sensitivity, and reverse transcription quantitative polymerase chain reaction (RT-qPCR)-based technologies of high accuracy and specificity.1–3 Yet, the impact of RT-qPCR is hindered by slow delivery of results, with rapid testing based on enzyme-linked immunosorbent assays and lateral flow assays technology often preferred as pre-screening methods with results available in 10–20 min.4 With a cycle threshold (Ct) cut off correlating to Ct = 28 in the best cases, concerns regarding the high frequency of false negative results raised research efforts in finding alternative strategies to real-time RT-qPCR tests. A large number of electrical and electrochemical approaches have been proposed as point-of-care strategies,5–8 with an original COVID-19 detection using an organic electrochemical transistor.7 The combination of a solution-processable conjugated polymer as a transistor channel together with nanobody-SpyCatcher fusion protein surface receptors allowed SARS-CoV-2 spike protein (S1) detection in nasopharyngeal swab samples of different viral loads.7 Similar to other coronaviruses, the surface of SARS-CoV-2 is decorated with spike glycoproteins that bind host angiotensin-converting enzyme 2 (ACE2) receptors to mediate the fusion of viral and host cell membranes.9 Targeting the spike glycoprotein is considered a direct way to measure the COVID-19 infectivity state of a patient,10–12 which is different from the most commercial antigen kits targeting the nucleocapsid protein.13 Some of us have recently reported on an efficient electrochemical platform for the quantification of SARS-CoV-2 viral particles in nasopharyngeal swab samples based on the functionalization of gold electrodes with highly-oriented Llama nanobodies specific to the three N-terminal receptor binding domain (RBD) of S1.14 The electrochemical sensor provided results in 10 min of exposure to 200 μL of unprocessed nasopharyngeal swab samples with an efficiency of 90% positive and 90% negative percentage agreement on clinical samples, as compared to RT-qPCR.The goal of this study was to develop an optical biosensor in the form of a portable surface plasmon resonance (SPR) point-of-care device through a nanobody-modified SPR chip for the detection of SARS-CoV-2 in nasopharyngeal samples. The label-free sensing ability of plasmonic-based sensors, allowing real-time sensing together with short response times of some minutes, with the possibility of sensing in multichannel format have made this testing approach widely accepted.15 The interest of SPR is broad and includes its use for the understanding of avidity-induced affinity enhancements for the SARS-CoV-2 spike protein and ACE2 interaction,16 a screening approach of affinity constants between bioreceptors and viral proteins,17,18 as well as a rapid diagnostic tool for detection of SARS-CoV-2 antibodies19 involved in severe acute respiratory syndrome20 and more recently for the diagnosis of COVID-19 infection.21–23 While the large size of the instrument has been a limitation for a large implementation in diagnostics, portable SPR devices in the wavelength interrogation mode21,24–27 display unique point-of-care features allowing viral sensing under safe conditions and optimal detection protocols offered by emerging machine learning tools.28 Huang et al.21 developed recently a spike protein specific plasmonic sensor and tested its performance on a SARS-CoV-2 pseudovirus. The format is based on SARS-CoV-2 monoclonal antibodies as surface receptors and gold nanoparticles labelled with ACE2 protein or SARS-CoV-2 monoclonal antibodies for signal amplification. This sandwich SPR-based immunoassay format achieved a theoretical detection limit of 370 viral particles per mL. While this sensor has potential to detect SARS-CoV-2 in nasopharyngeal swab samples, its real performance has not been discussed.
Herewith, we show the performance of a portable SPR sensor (Fig. 1a) using a direct detection scheme for SARS-CoV-2 using VHH-72-Fc bioreceptors (Fig. 1b) referring to VHH-72 fused to a human IgG1 Fc domain by a GS(GGGGS)2 linker, as reported by Wrapp et al.17 The VHH-72-Fc nanobodies were immobilized on SPR chips via a carboxylic-acid functionalized polyethylene glycol (PEG)-surface anchor, where the presence of the hydrophilic PEG chain suppressed efficiently non-specific adsorption of proteins and cells present in the transport medium used for collecting nasopharyngeal swab samples. Validation on 119 nasopharyngeal samples (50 positive and 69 negative) showed a 88% positive percentage agreement (PPA) and a 92% negative percentage agreement (NPA), as compared to RT-qPCR. A clear correlation between the Ct as determined by RT-qPCR and the RU indicated by 15 min SPR sensorgrams is observed (Fig. 1c). Furthermore, with the access to raw clinical data, machine learning (ML) methods29–36 have been applied to grasp the characteristics of SPR sensing curves and to estimate the cut-off value for assigning positive and negative responses. Our study highlights that 1 min SPR sensorgram data is sufficient to match the inferred results from 15 min sensing data. The novelty of the work resides in the demonstration, that a plasmonic device with adapted surface ligands and surface chemistry can indeed work under clinical settings with reasonable accuracy and good sensitivity not only for standard solutions but also on real clinical samples, in this case nasopharyngeal samples. The work presented here showed that the approach is applicable to the current pandemic situation by sensing the spike protein of the SARS-CoV-2 viral envelop, a direct manner to sense viral infectivity. While the SARS-CoV-2 variants encode mutations in the virus envelop spike protein, the main advantage using the S1 protein as sensing target over other viral components such as RNA or the nucleocapsid protein, packaging the viral RNA to form a helical capsid, is that no virus lysing is required to have access to the biomarkers. The possibility to decrease the sensing time down to 1 min via ML without loss in sensitivity makes the approach of interest for fast sample screening in emergency cases.
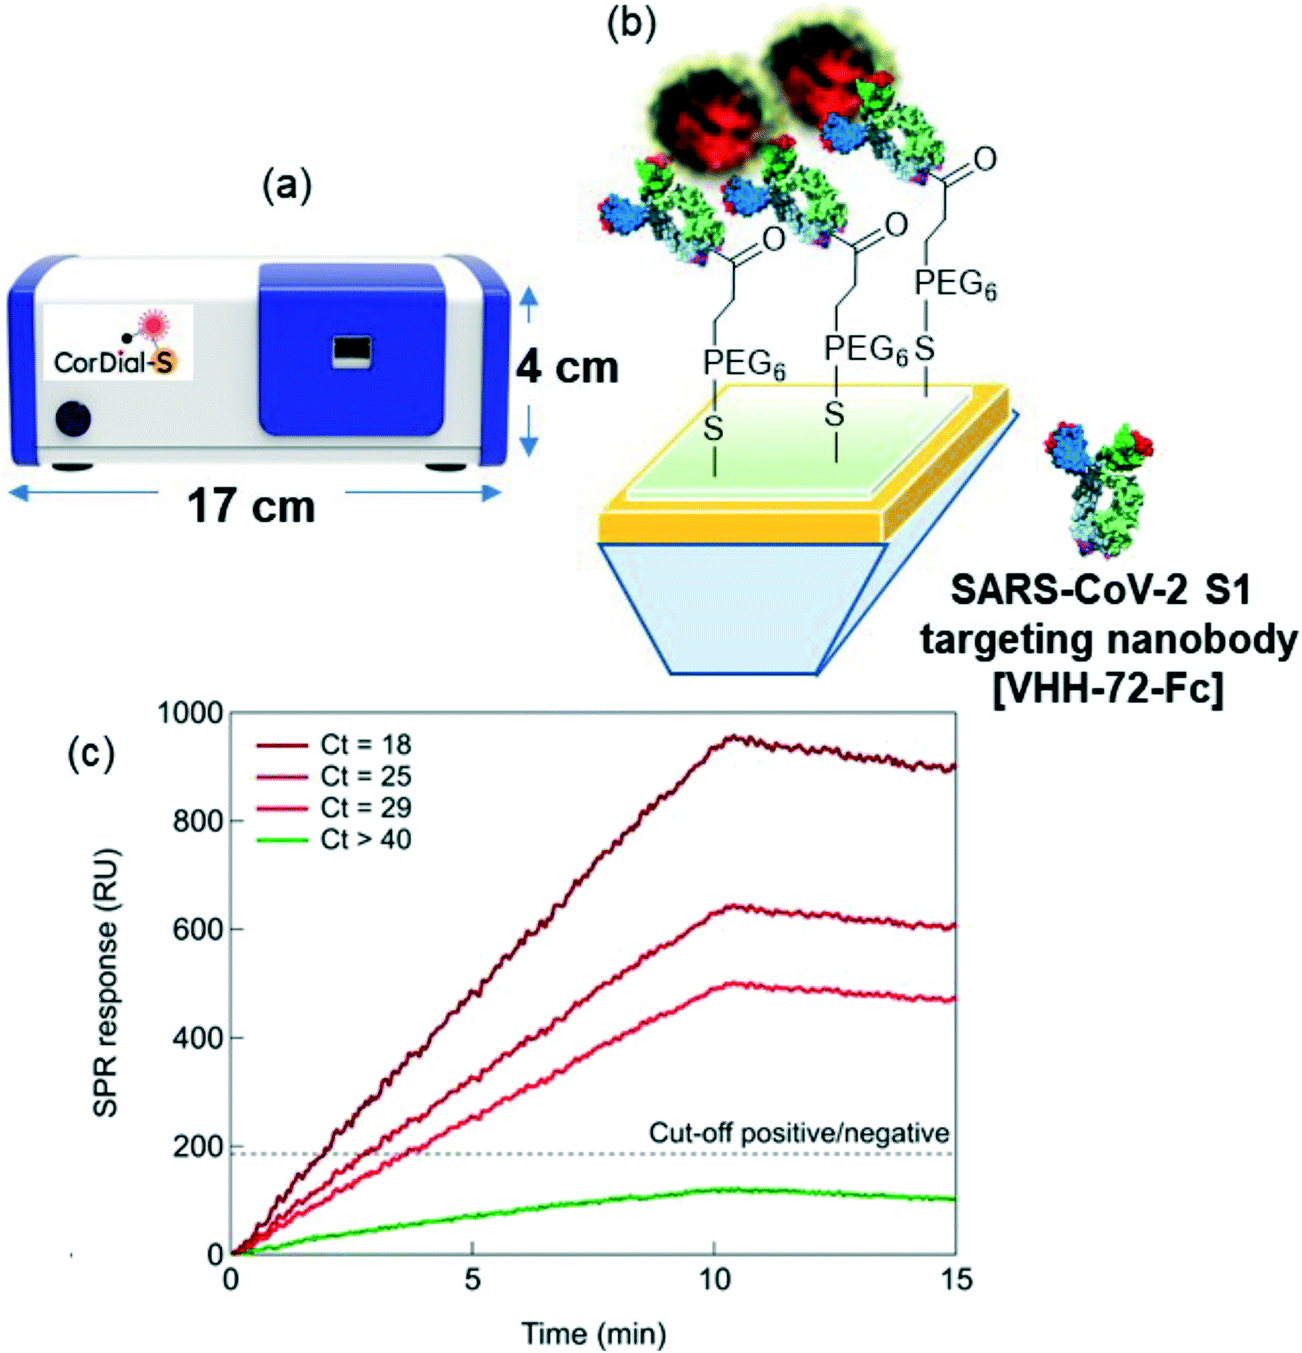 | ||
| Fig. 1 Label-free detection of SARS-CoV-2 virus particles in nasopharyngeal swab samples. (a) Portable surface plasmon resonance device used in this work. (b) Schematic diagram of the plasmonic sensor modified with SARS-CoV-2 S1 nanobodies together with the structure of the VHH-72-Fc. (c) RT-qPCR categorized nasopharyngeal swab samples into positive and negative, and the corresponding sensorgrams on nanobody-modified SPR chip. The indicated cut-off between the positive and negative samples (186 RU) is obtained by analysing the SPR response with machine learning algorithms at different sampling times and sensorgram lengths. | ||
The sensing device is competitive with other optical sensing platforms recently described and developed.37,38 By engineering gold nanospheres to distinctively bind with the outer surface of the SARS-CoV-2 virus, the resonance frequency was adjusted to the visible range (380–700 nm). It was shown that the broadband absorption of the virus merges with the visible spectrum when the virus is partially covered with gold nanoparticles at a specific coverage percentage and this feature can be used in efficient and accurate colorimetric plasmon sensors for COVID-19 detection. Rodríguez Díaz et al. developed colorimetric sensors based on gold nanoparticles for recognition of SARS-CoV-2 RdRp, E and S structural proteins and were able to detect medium and high viral loads (≥103–104 viral RNA copies per μL) in patient samples.38
2. Results and discussion
2.1. SPR bioassays using VHH-72-Fc nanobody as SARS-CoV-2 S1 specific surface receptor
Despite the nanomolar affinity of VHH-72 for the SARS-CoV-2 RBD reported by SPR,17 the rapid dissociation is believed to effect negatively the SPR read out. The bivalence of VHH-72-Fc, due to the Fc domain of human IgG1 genetically linked by a HHHHHHRENLYFQG linker to the VHH domain (Fig. 1), results in nanomolar affinity constant of KD = 1.5 × 10⁻⁹ M with a kon of 1.2 × 10⁵ M−1 s−1 and an improved koff equal to 1.8 × 10⁻⁴ s−1, as determined by the portable P4 SPR (Affinité Instruments) device (Fig. 2a). Indeed, the results are comparable to those recorded on a Biacore T200 (Cytiva Life Science) instrument (Fig. S1†) using the same running buffer. The interaction of the VHH-72-Fc nanobody with the RBD of SARS-CoV-2 (Fig. 2b) is expected not to be altered with the current mutations (Fig. 2c). As seen from the molecular surface structure of the RBD with the fingerprint of VHH-72-Fc included, even the 15 mutations of Omicron variant are not interfering with the RBD/VHH-72-Fc overlapping positions.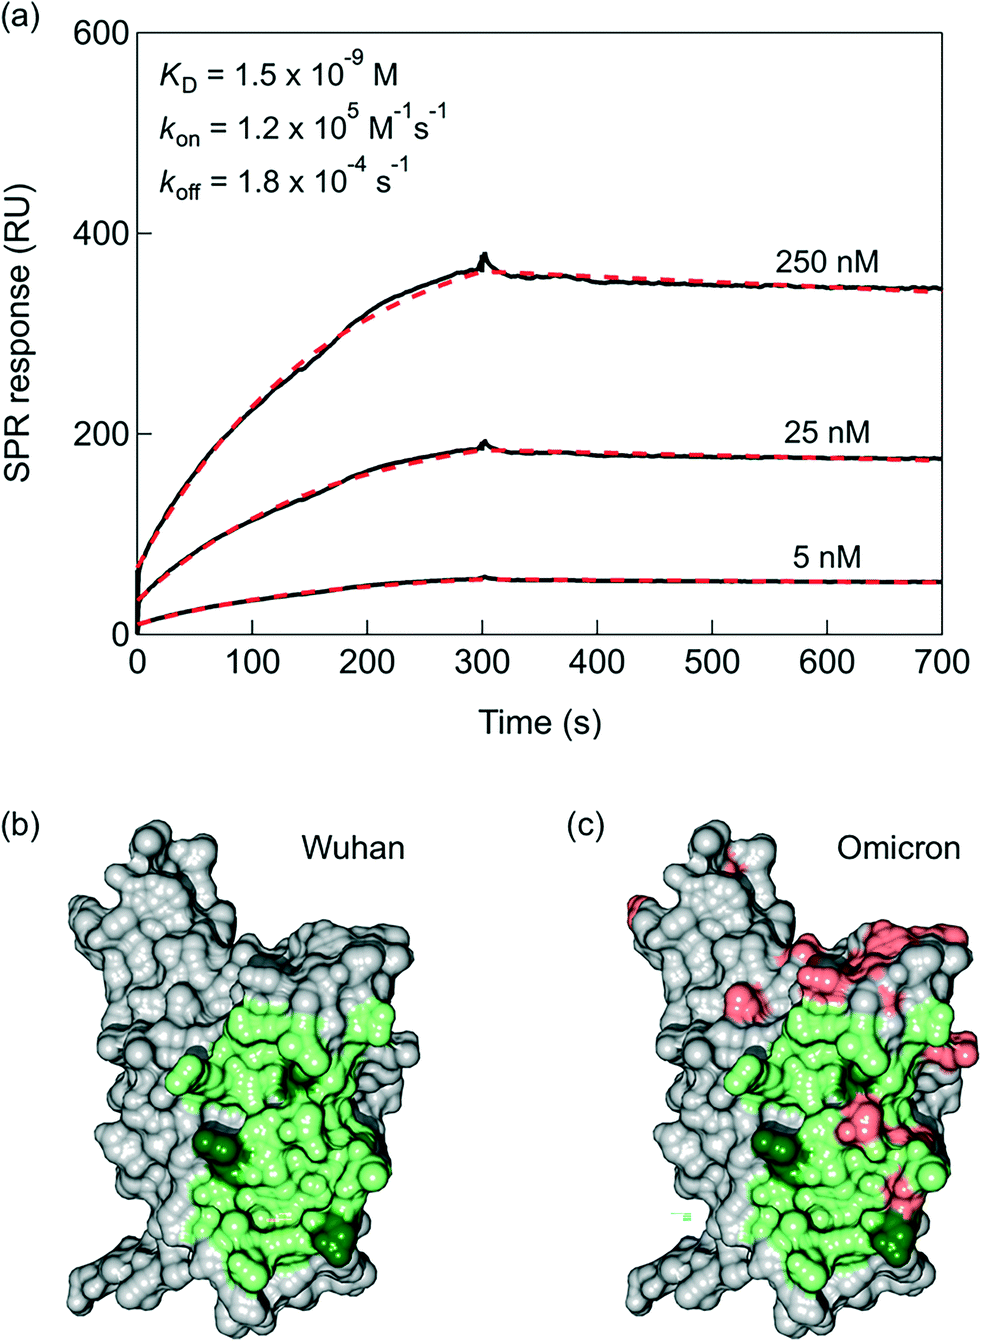 | ||
Fig. 2 VHH-72-Fc interaction with the RBD of SARS-CoV-2. (a) SPR sensorgram measuring the apparent binding affinity of RBD Wuhan (Acrobiosystems, Ref. SPD-C52H3) to surface immobilized VHH-72-Fc modified SPR chip. The SPR binding curves were recorded with a P4 SPR (Affinité Instruments, Canada) using as running buffer HBS-P+ 1× (containing 0.01 M HEPES, 0.15 M NaCl and 0.05% v/v surfactant P20). Surface modification response of 1 RU is equal to 1 pg mm−2 and the change of 2000 RU was targeted with VHH-72-Fc. The interaction with RBD Wuhan (5, 25 and 250 nM in HBS-P+) was recorded at a flow rate of 30 μL min−1. The binding curve is colored in black and the fit of the data to a 1![[thin space (1/6-em)]](https://www.rsc.org/images/entities/char_2009.gif) :1 Langmuir based binding curve is colored in red. (b) Representation of the molecular surface of the RBD (grey colour) together with the VHH72 fingerprint (light green colour). The 3 hot spots (hydrogen bonding with side chains) are colored in dark green. (c) Representation of the molecular surface of the RBD I with the 15 mutations of the Omicron variant (salmon colour). The overlapping positions (light green colour) correspond to interactions with atoms of the RBD main chain. :1 Langmuir based binding curve is colored in red. (b) Representation of the molecular surface of the RBD (grey colour) together with the VHH72 fingerprint (light green colour). The 3 hot spots (hydrogen bonding with side chains) are colored in dark green. (c) Representation of the molecular surface of the RBD I with the 15 mutations of the Omicron variant (salmon colour). The overlapping positions (light green colour) correspond to interactions with atoms of the RBD main chain. | ||
2.2. VHH-72-Fc modified SPR chips towards quantitative analysis of receptor binding domain (RBD) proteins
Dynamic binding of SARS-CoV-2 spike proteins was investigated on SPR chips modified first with a short heterofunctional poly(ethylene glycol) (PEG) linker, HS-PEG6-COOH, followed by covalent VHH-72-Fc coupling using standard amide coupling procedure (NHS/EDC) (Fig. 1a). The immobilization steps were monitored through X-ray photoelectron spectroscopy (XPS) (Fig. S2†). Upon functionalization with VHH-72-Fc, bands corresponding to C1s, O1s, S2p and Au4f were observed. The high resolution C1s XPS spectrum of Au-S-PEG6-COOH sensing chips reveals bands at 285.0 eV (C–C/C–H), 286.7 eV (C–S/C–O) and 288.6 eV (O–C![[double bond, length as m-dash]](https://www.rsc.org/images/entities/char_e001.gif) O). Integration of VHH-72-Fc via amide linkage shows significant change in the C1s feature with bands at 285.0 eV (C–C/C–H), 286.3 eV (C–O, C–N, C–S) and 288.2 eV (O–CO and N–CO). In all cases, signals of the underlying Au4f are visible, indicating that surface modifications result in film thicknesses below 10 nm.
O). Integration of VHH-72-Fc via amide linkage shows significant change in the C1s feature with bands at 285.0 eV (C–C/C–H), 286.3 eV (C–O, C–N, C–S) and 288.2 eV (O–CO and N–CO). In all cases, signals of the underlying Au4f are visible, indicating that surface modifications result in film thicknesses below 10 nm.
From the SPR signal change as a function of wavelength after immobilization of VHH-72-Fc (Fig. 3a), the surface concentration, Γ, of VHH-72-Fc was estimated as 1.12 ng mm−2 using eqn (1):
 | (1) |
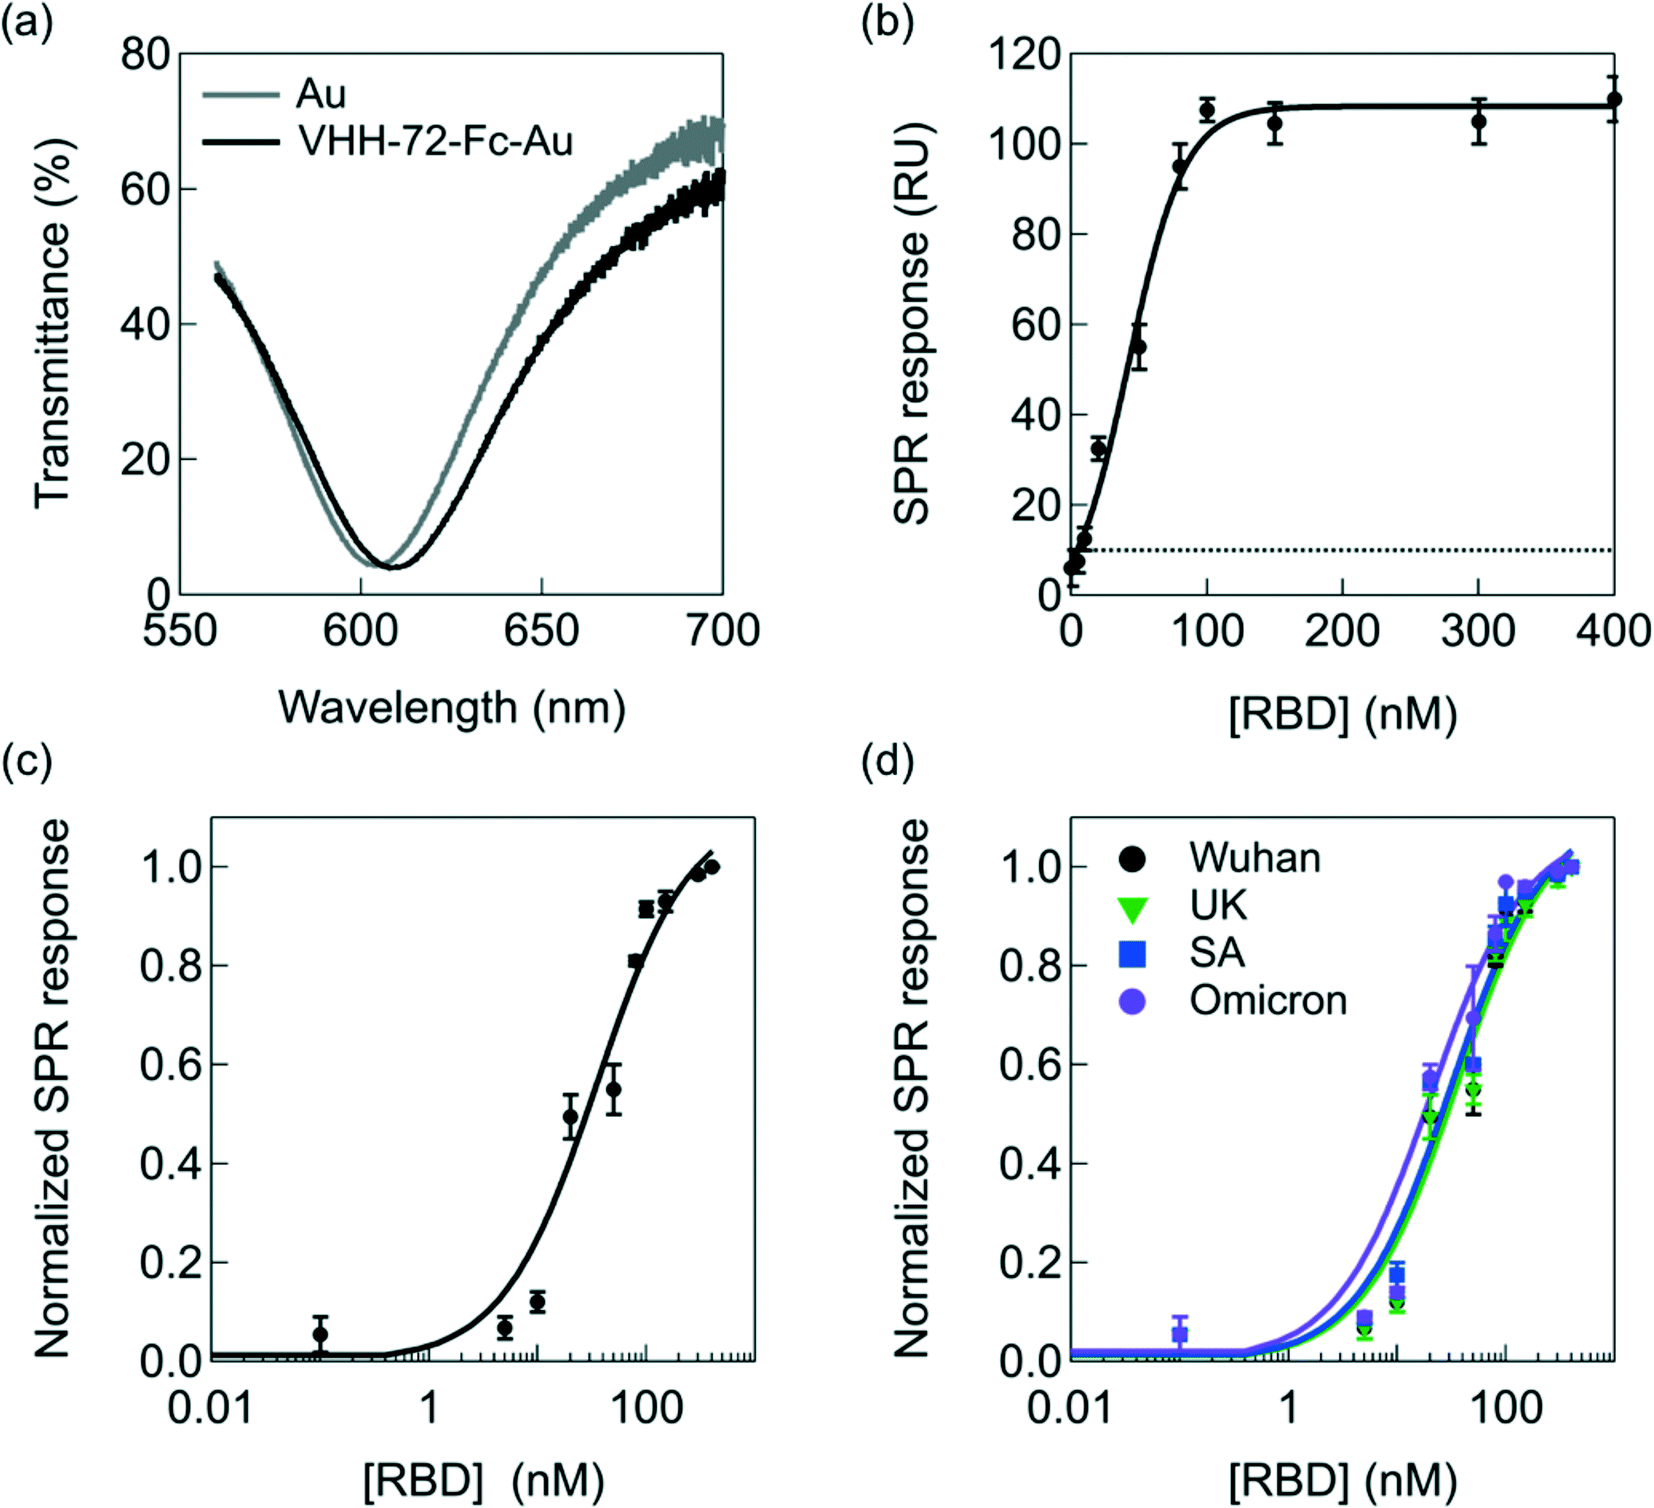 | ||
| Fig. 3 Interaction of RBD with VHH-72-Fc modified SPR chips of the portable diagnostic device. (a) Transmittance as a function of wavelength before (grey) and after (black) VHH-72-Fc receptor immobilization (50 μg mL−1) onto the SPR chip via amide linkage to surface attached thiol-PEG6-COOH (Fig. 1a). (b) SPR response as a function of different RBD concentrations (Wuhan, Acrobiosystems, Ref. SPD-C52H3). The dotted line corresponds to the detection limit (10 RU) of the SPR instrument. (c) Langmuir adsorption isotherm obtained by plotting the surface coverage (eqn (2)) as a function of RBD Wuhan concentration. The black curve is a fit to the isotherm determined using eqn (2). The RU value at 400 nM was set to 1. (d) Langmuir adsorption isotherms on VHH-72-Fc modified gold prims using RBD from different variants: Wuhan (black, Acrobiosystems, Ref. SPD-C52H3), UK (green, Sinobiological Ref. 40592-V08H8), South African (blue, Acrobiosystems, Ref. SPD-C52H), Omicron (violet, Acrobiosystems, Ref. S1N-C52Ha). | ||
Exposure of VHH-72-Fc modified SPR gold chips to increasing RBD concentrations results in an increase in the SPR response until saturation at ≈100 nM, according to RU = 4.15 + 1.05 × [RBD] (nM) (R = 0.9962), with a detection limit of about 10 ± 2 nM from five blank noise signals (95% confidence level) (Fig. 3b). These results indicate, as shown previously in several reports,40–42 that the portable spectral mode SPR is well-adapted for precise analytical sensing.
The data can be fitted with a Langmuir isotherm model (Fig. 3c) according to eqn (2) with RU(c0) being the initial response units, RU(c∞) the response units in the presence of RBD and KA the affinity constant between VHH-72-Fc and RBD:
| Θ = RU(c0)/RU(c∞) = KA × c0/(1 + KA × c0). | (2) |
The risk with the direct detection of the virus via its S1 spike protein is that possible RBD mutations might have reduced binding affinity with the VHH-72-Fc nanobody epitopes. Fig. 3d screens for the change in SPR signal upon the interaction of VHH-72-Fc modified SPR chips with different RBD mutations, in particular the UK, South African and Omicron variants. The Omicron variant is by far the most divergent SARS-CoV-2 variant. The S-shaped curves prove no significant difference towards different UK and South African mutants. This is in line with the KA values determined for each mutant (Fig. S3†) with the values listed in Table 1.
| RBD | Reference | K A (M) | k off (s−1) | k on (M−1 s−1) |
|---|---|---|---|---|
| RBD Wuhan | Acrobiosystems Ref. SPD-C52H3 | (1.47 ± 0.3) × 10−9 | 0.000356 | 2.4 × 10⁵ |
| RBD UK | Sinobiological Ref. 40592-V08H8 | (1.01 ± 0.6) × 10−9 | 0.000365 | 3.6 × 10⁵ |
| RBD South African | Acrobiosystems Ref. SPD-C52H | (1.35 ± 0.9) × 10−9 | 0.000352 | 2.6 × 10⁵ |
| RBD S1 Omicron | Acrobiosystems Ref. S1N-C52Ha | (1.32 ± 0.9) × 10−9 | 0.000762 | 5.7 × 10⁵ |
2.3. SPR bioassays of SARS-CoV-2 virus in cultured virus samples
To validate the performance of the SPR interface, the VHH-72-Fc modified SPR chips were exposed to cultured SARS-CoV-2 viral particles (clade 20A.EU2, EU variant) of different concentrations diluted in the SPR running buffer HBS-P+ 1× (containing 0.01 M HEPES, 0.15 M NaCl and 0.05% v/v surfactant P20) (Fig. 4a). The running buffer in absence of SARS-CoV-2 cultured viral particles was used as control blank group. From the dynamic binding curves of nanobody-virus interactions, it can be seen that the control solution yields a 10 RU response, corresponding to the background signal. Fig. 4b depicts the linear relationship between the SPR response and the viral load between 5.9 × 10⁴ and 1.9 × 10⁸ copies per mL with a limit of detection (LoD = (3 × noise)/sensitivity, with a noise equal to 10 RU) of 2.9 × 10⁴ viral particles per mL. Indeed, to correlate the RU changes of Fig. 4a to the absolute number of virions, the number of viral RNA genomes has to be determined by RT-qPCR for each viral dilution, assuming that each genome is associated with a virion.14 Calibration of Ct values to viral copies per mL was performed lately by us using a commercially available standard (Exact Diagnostics SARS-CoV-2 Standard SKU: COV019).14 It has to be kept in mind that there is considerable variability in Ct values of a given concentration when using different primers and probes and the IP4 assay used here gives relatively high Ct values compared to some other techniques.43 The most diluted solution (Fig. 4a) has in our case a Ct = 40 and correlated to 1.5 × 10³ viral RNA genomes per mL. This concentration is not detectable by the SPR set up as it is within the background signal. The assumption made for linking viral RNA genomes to viral particles is tremendously important. If a large fraction of the viral RNA copies is present as naked RNA and not encapsulated inside the viral particles, the use of viral RNA copies as an approximation for the number of viral particles leads to an overestimation of the number of viral particles. The detection limit of 2.9 × 10⁴ viral particles per mL can be correlated to about Ct = 32.5.14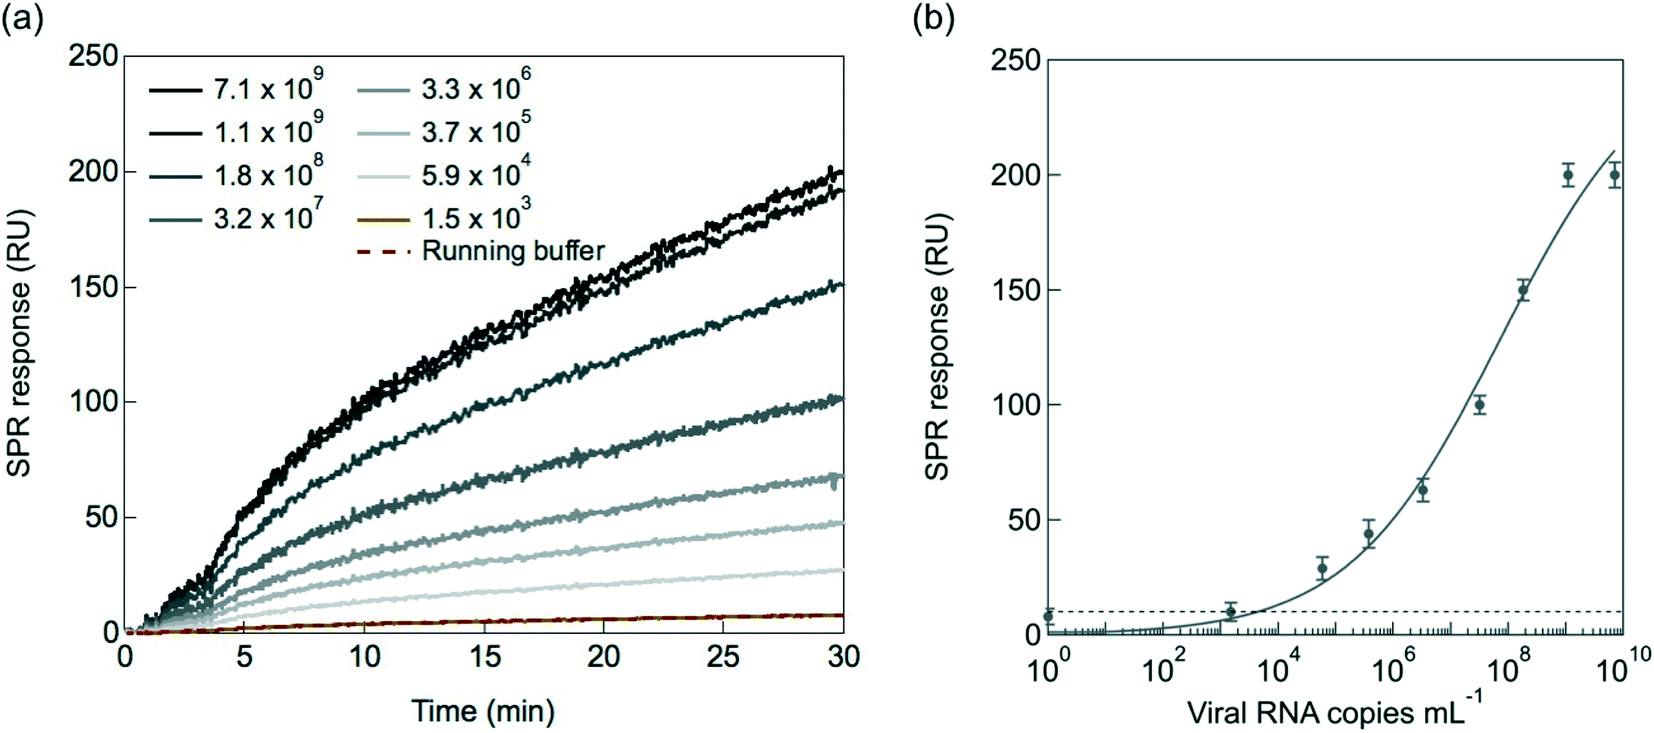 | ||
| Fig. 4 Performance of the portable SPR functionalized with VHH-72-Fc as surface receptor on cultured SARS-CoV-2 virus samples. (a) SPR sensorgrams upon flowing cultured viral particles of different dilutions (D1 to D9, 7.1 × 10⁹ to 1.1 × 10³ viral RNA copies per mL) over the SPR chip. The flow rate is 60 μL min−1 and the running buffer HBS-P+ 1× (containing 0.01 M HEPES, 0.15 M NaCl and 0.05% v/v surfactant P20). (b) Dose-dependent response curve toward SARS-CoV-2 cultured virus clade 20A.EU2 (EU variant) using t = 30 min as reading point. The dotted line indicates the experimentally determined LoD and the solid line is a fit to the data (Hill–Langmuir). | ||
2.4. Selectivity and specificity towards SARS-CoV-2 mutants
To assess the risk of RBD mutants that could interfere with the nanobody epitopes (Fig. 2), viral titration of clade 20A.EU2 (EU variant) was compared to that of clade20I/501Y.V1 (UK variant), clade 20H/501Y.V2 (South African variant), clade B.1.617.2 + AY.1 + AY.2 (Delta variant) as well as clade B.1.1.529 (Omicron variant). Fig. 5a indicates that the VHH-72-Fc SPR interface detects equally well the UK, South African and EU variants. In the case of the Delta strain, generally larger RU responses were obtained for viral copies >106, suggesting stronger binding to the SPR linked receptors or the presence of higher density of S1 proteins on these virions.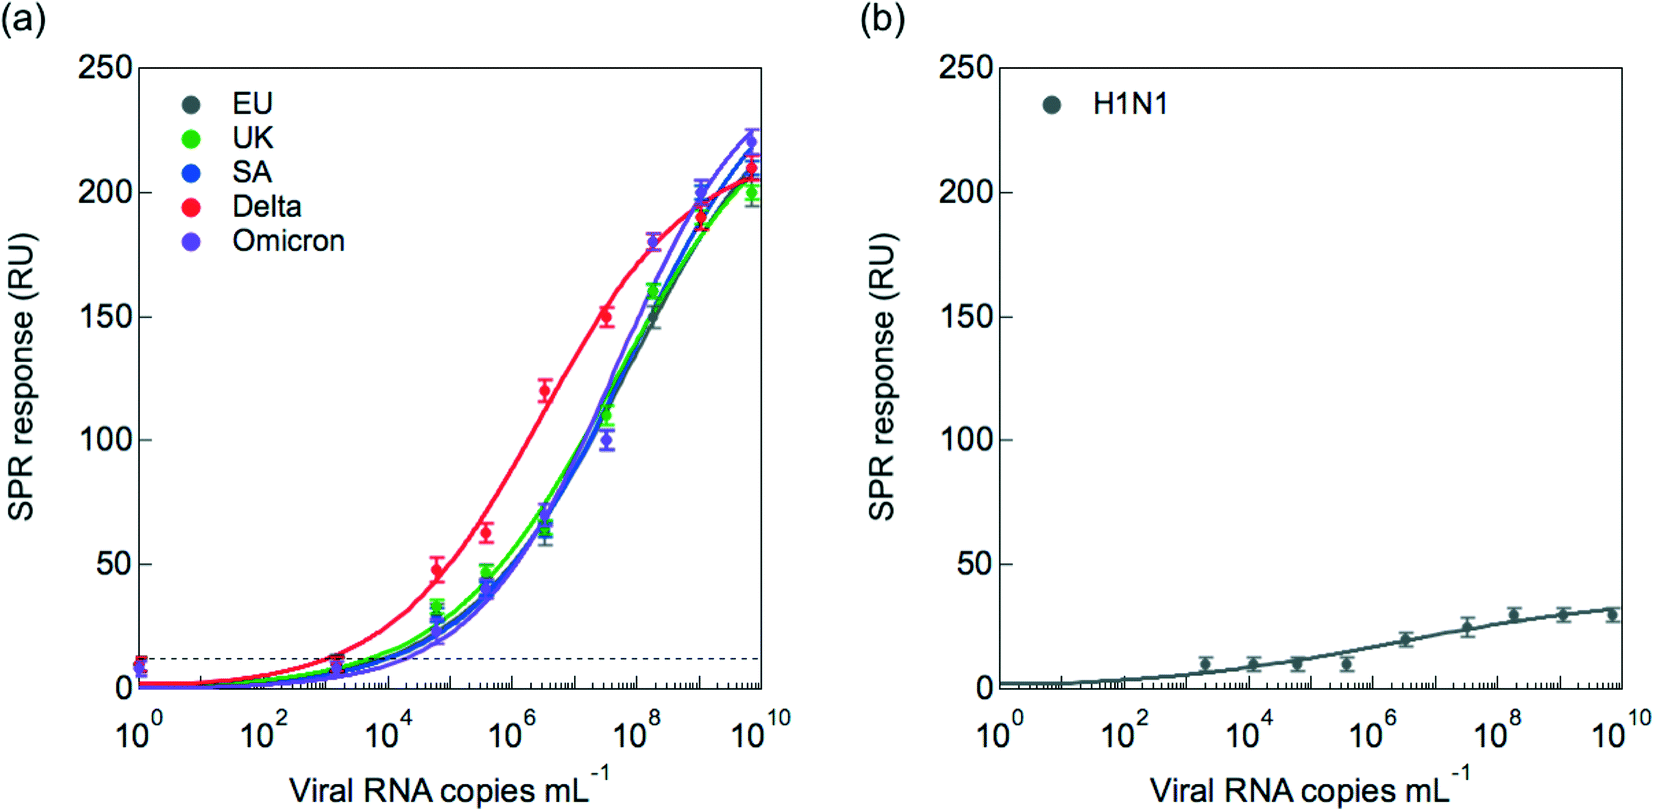 | ||
| Fig. 5 Performance of the portable SPR functionalized with VHH-72-Fc as surface receptor on cultured virus samples. (a) Dose-dependent response curve toward SARS-CoV-2 cultured virus clade 20A.EU2 (EU variant, grey), 20I/501Y.V1 (UK variant, green), 20H/501Y.V2 (South African variant, blue), B.1.617.2 + AY.1 + AY.2 (Delta variant, red) and B.1.1.529 (Omicron variant, violet). (b) Dose-dependent response curve toward H1N1 cultured virus. The results are expressed as the mean ± SEM (standard error of mean) of at least 3 independent samples for each group. | ||
The sensor was tested in addition for its selectivity in discriminating between SARS-CoV-2 and Influenza A H1N1, the causal factor of recent flu pandemics. As seen in Fig. 5b, discrimination with influenza A(N1H1) is insured even at higher viral titers of H1N1.
2.5. Sensor performance on clinical samples
To understand the clinical relevance of the developed sensor, its performance was evaluated on 119 nasopharyngeal swab samples (50 positive and 69 negative samples, as identified by RT-qPCR) collected from patients at a clinical testing facility. The collection medium for the nasopharyngeal samples was PBS (1×, pH 7.4). Before analysis, 200 μL of the collected sample was diluted with SPR running buffer in a 1/50 ratio. Indeed, a negative nasopharyngeal sample when diluted 1/50 with running buffer displays a background signal of <30 RU (Fig. S4†), while an undiluted nasopharyngeal sample and a sample diluted 1/1 exhibited a response up to 300 RU. Fig. S5† shows complete SPR sensorgrams for the 50 positive and 69 negative samples.Using a cut-off value of 186 RU (Fig. 6a), from the 50 nasal swab samples that had been confirmed by RT-qPCR to be positive (Fig. 6b), 44 were identified as COVID-19 positive. With 44 samples correctly identified out of 50, an accordance with RT-qPCR corresponding to a 88% positive percentage agreement (PPA) was determined. Out of 69 nasal samples confirmed by RT-qPCR as negative, 64 were identified as negative by SPR, revealing a 92% negative percentage agreement (NPA). The results, notably the PPA value being equivalent to the sensitivity of the system, are outperforming most commercial SARS-CoV-2 rapid antigen tests, displaying sensitivities against the gold standard RT-qPCR ranging from 65 to 89%.44 Out of the five false positive (negative nasopharyngeal samples by RT-qPCR but positive by SPR) cases, three patients could be indeed classified as confirmed COVID-19 cases (interstitial pneumoniae and/or pulmonary embolism with anti-SARS-CoV-2 specific IgM onset, positive RT-qPCR days later). For the 6 patients in the COVID-19 positive series, showing discordant results between the SPR and RT-qPCR diagnostics, the medical history was analyzed a posteriori and classified as confirmed/probable COVID-19 cases, as defined by World Health Organization.45 Only one out of the 6 samples was considered as a false RT-qPCR positive with no medical history compatible with COVID-19 disease.
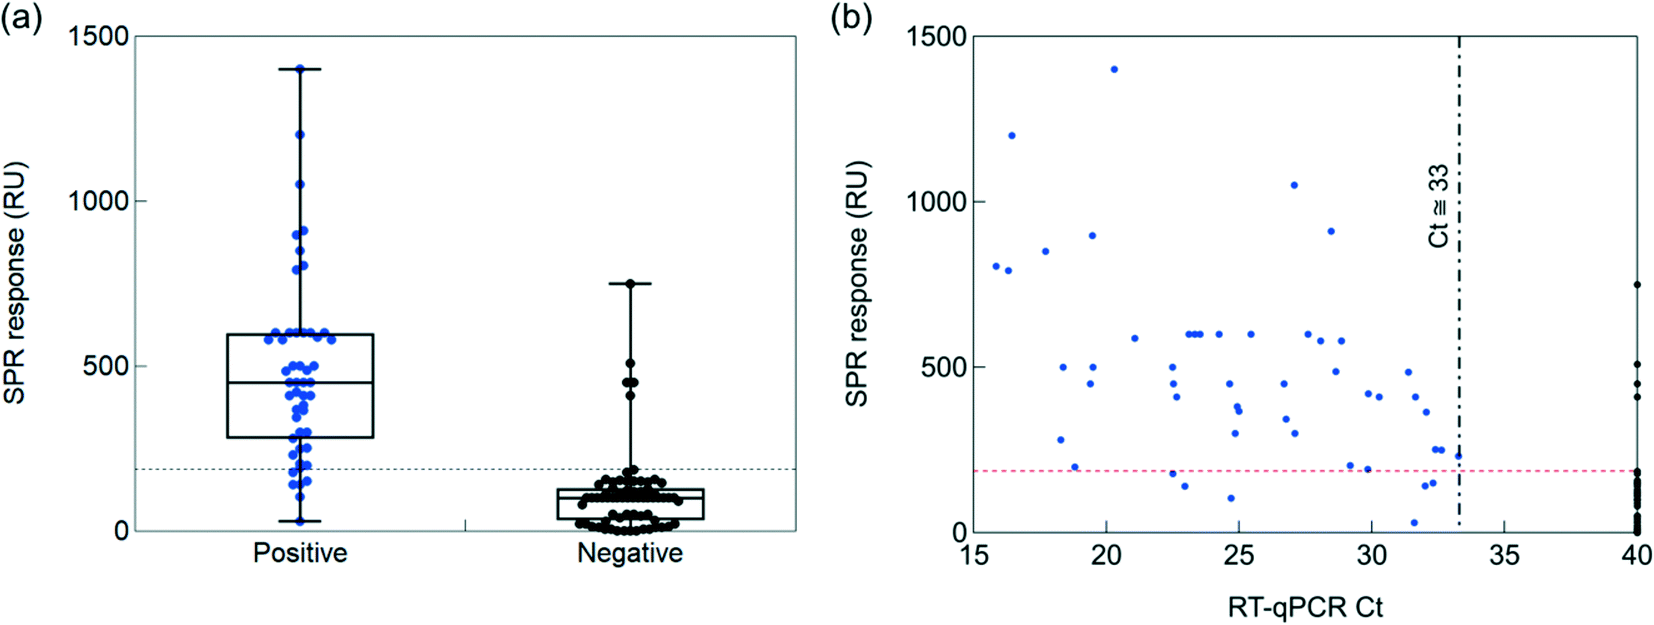 | ||
| Fig. 6 Performance of the SPR sensor on 119 clinical samples. (a) Correlation between RT-qPCR positive (50) and negative (69) nasopharyngeal samples and SPR data. (b) Ct values as a function of RU change recorded from COVID-19 patients. Cut-off between positive and negative was 186 RU (dotted red lines). | ||
To see if quantitative analysis was reached with the sensor concept, the patient samples were ordered from high viral loads (Ct = 15) to lower viral loads (Ct = 40) (Fig. 6b). Infectivity cut off was set at Ct = 33. A correlation of higher RU values with higher viral loads was crudely observed.
2.6. Machine learning analysis
To assess the influence of data acquisition and preprocessing on machine learning algorithms, the sampling time was chosen as 125, 250 and 1000 ms. Additionally, to underpin the influence that the association stage in the present SPR method has for COVID-19 diagnosis, measurement intervals of 1, 5 and 15 min have been selected. For 1 and 5 min sensorgram lengths, only the beginning of the association phase is taken into account, while the 15 min sensorgrams are composed of the full 10 min association stage and a 5 min dissociation stage. A multi-layer perceptron classifier has been used29–31 and k-fold cross validation (k = 10) has been implemented to avoid adverse effects of overtraining.32 The test database consisted of 36 sensorgrams, including 15 positive cases and 21 negative cases. Table S1† shows the performance of models trained for sensorgrams with different sampling and acquisition times. When analyzing the entire sensorgram of 15 minutes, including both association and dissociation stages, it is observed that in all cases, the specificity reaches 95%, revealing the robustness of the models for predicting negative cases by using the entire sensorgram. The accuracy increases with the sampling time. Moreover, for 1 s sampling time, the Cohen's Kappa value is 0.9434. Typically, while the specificity decreases upon reducing the acquisition time, with 250 ms sampling time and 1 min acquisition time, it is still possible to match the results obtained for 1 s sampling time and 15 min acquisition time. These results obtained for the SPR-based test corroborate findings of deep learning models that used datasets with medical images for COVID-19 diagnosis, for which the sensitivity and accuracy exceeded 90%.33Within the same data analysis framework, an estimation of the cut-off between positive and negative classes can be performed by analysing the SPR response ranges for different sampling times (Table S2 and Fig. S6†), assuming the entire 15 min sensorgram length. In the analysed raw sensorgrams, the sampling time ranges from 341 to 681 ms. For the downsampled model assuming 1 s sampling time, it was observed that sensorgrams higher than a cut-off value of 148 RU were predicted positive, while the upsampled model assuming 250 ms sampling time provided a cut-off value of 224 RU. Therefore, taking into account the distribution of the real sampling times, an average value of 186 RU can be inferred for the present dataset.
Conclusion
The RT-qPCR of nasopharyngeal swab samples is the gold standard for COVID-19 diagnostics. Even though this method is reliable and very sensitive, it is time-consuming and costly. The possibility to use SPR for sensing the SARS-CoV-2 Spike envelop protein S1 as alternative approach was investigated here. The strategy relies on the utilization of SPR chips functionalized with the nanobody VHH-72-Fc receptor. The sensing approach tested on 119 nasopharyngeal patients' samples showed a 88% PPA and 92% NPA concordance with RT-qPCR. The data collected in this work show that the developed diagnostic test has a high level of sensitivity (88%) and specificity (92%) due to its concordance with the reference PCR test, whose relevance is not in doubt. When compared to antigenic tests reputed to be >90%, most of them are established according to in vitro laboratory standards for regulation approval. Many biases reduce the capacity of the test in real life however with a real-life sensitivity well below 90% and sometimes close to 60%. The approach presented here has been validated in terms of sensitivity and specificity under real conditions of use, considering all possible inherent biases. As revealed by data analysis based on feedforward artificial networks in addition, this work opens up the possibility of point-of-care detection of SARS-CoV-2 infection due to unique sensitivity and lateral flow assay-comparable response time and could add strongly to the current COVID-19 diagnosis scenario.3. Experimental section
3.1. Materials
3-Mercaptoundecanoic acid (98%), 1-ethyl-3-(3-dimethylaminopropyl)-carbodiimide hydrochloride (EDC), N-hydroxysuccinimide (NHS), ethanolamine, tris(2-carboxyethyl)phosphine (TCEP) and ethanol were purchased from Sigma-Aldrich and used as-received. Phosphate saline solution (PBS, 1×) was obtained from Thermo Fisher Scientific. Maleimide-PEGx-amine (MW 1 kDa) was purchased from Interchim Uptima. Milli-Q (MQ) water was used throughout the whole study.Recombinant Omicron SARS-CoV-2 spike glycoprotein S1 was obtained from Acrobiosystems (Ref. S1N-C52Ha). RBD Wuhan and South African were purchased from Acrobiosystems (Ref. SPD-C52H3; SPD-C52H). RBD UK was purchased from Sinobiological (Ref. 40592-V08H8 and S1N-C52Ha).
3.2. Surface plasmon resonance (SPR)
SPR measurements were made on a portable P4 SPR platform from Affinité Instruments, Canada. The resolution of the detector is 1.34 nm full width at half maximum. The minimum in the SPR signal is followed using a proprietary algorithm that provides a final instrumental resolution of 0.004 nm. The standard deviation on the noise signal over 5 minutes is <5 RU and the peak-to-peak variation is 0.2 μRIU. As a LED is used in the setup and not a halogen lamp, there is essentially no light source drift with time. SPR curves were recorded using as running buffer HBS (0.01 M HEPES, 0.15 M NaCl and 0.05% v/v Tween 20) at a flow rate of 60 μL min−1. Surface modification of the gold dove prisms was performed outside the SPR instrument. The prisms were coated with 500 μL of an ethanol:water (8:2) solution of 5 mM HS-PEG6-COOH (MW 2000 g mol−1, Uptia-GV9852) for 24 h. The surface was then washed with MQ-water and dried at RT under an air flow. The PEG6-COOH modified interface was immersed into an aqueous solution of Fc-VHH-72 (10 μg mL−1, PBS 1×) containing EDC/NHS (1/1 molar ratio, 15 mM) and left for 1 h. The surface was further incubated for 12 min in ethanolamine (1 M), washed with MQ-water and dried at RT under an air flow and stored at 4 °C. The interaction with RBD was performed at a flow rate of 30–60 μL min−1. All experiments in this study were conducted at 25 °C and all sensorgrams were fitted using Prism v7 software.
X-ray photoelectron spectra (XPS) were recorded with an SPECSLAB II (Phoibos-Hsa 3500 150, 9 channels) SPECS spectrometer with Al Kα source (E = 1486.6 eV) operating at 12 kV, pass energy (Epass = 40 eV), 0.1 eV energy step and acquisition time of 1 s per point. The residual pressure inside the analysis chamber was ∼1 × 10⁻⁸ Torr. All XPS were referenced according to the adventitious C1s peak at 284.5 eV.
3.3. Nanobodies
VHH-72-Fc are mutated nanobodies fused with a human IgG1 FC domain. They were produced in HEK Expi293 cells cultured in Expi293 expression medium from ThermoFisher at 37 °C, 150 rpm until the cell density reached about 1 × 10⁶ cells per mL. At this stage, cells were transfected with 75 μg of DNA and 225 μg of PEI Max-transfection grade linear (Polysciences) and the cells were grown for an additional 96 h. After the first 24 h, additives were added on the cells: 0.5 mM of valproic acid, 4 g L−1 of glucose and 20% tryptone N1. After 96 h, cells were pelleted by centrifugation for 10 min, 700g, at 4 °C and the supernatant was then purified on a 5 mL Ni-NTA column (GE Healthcare) in 50 mM Tris, 5% glycerol, 5 mM imidazole, 300 mM NaCl, at pH 8.0. The fractions eluted in 250 mM imidazole were concentrated by centrifugation using an Amicon Ultra 10 kDa cutoff concentrator prior to being loaded onto a HiLoad 16/60 Superdex 75 pg gel filtration column (GE Healthcare) equilibrated in phosphate buffered saline (PBS). The purified nanobodies-FC were concentrated by centrifugation; their concentration was determined by measuring the absorbance at 280 nm with a NanoDrop 2000 (Thermo Scientific) and the denaturation curve was determined using a Tycho NT.6 from Nanotemper Technologies.3.4. Cell culture
Vero E6 cells (ATCC CRL-1586) were cultured in Dulbecco's modified Eagle medium (DMEM) supplemented with 10% fetal bovine serum (FBS), 1% L-glutamine, 1% antibiotics (100 U mL−1 penicillin, and 100 μg mL−1 streptomycin), in a humidified atmosphere of 5% CO2 at 37 °C.3.5. Virus titration
Vero E6 cells were plated in 96-well plates (2.5 × 10⁵ cells per well) 24 h before performing the virus titration. Clinical isolates, obtained from a SARS-CoV-2 positive specimen, were cultured on Vero E6 cells. Infected cell culture supernatant was centrifuged for 10 min at 1500 rpm at 4 °C to obtain a virus suspension. The virus suspension was used undiluted and in serial ten-fold dilutions (10−1 to 10−9). Virus suspensions were distributed in 6 wells in DMEM supplemented with 10% FBS to Vero E6 cells, 1% antibiotics (100 U mL−1 penicillin, and 100 μg mL−1 streptomycin), and 1% L-glutamine. The plates were incubated for 6 days in 5% CO2 atmosphere at 37 °C. The plates were examined daily using an inverted microscope (ZEISS Primovert) to evaluate the extent of the virus-induced cytopathic effect in the cell culture. The estimation of the virus concentration was carried out by the Spearman and Karber methods46,47 and expressed as TCID50 mL−1 (50% tissue culture infectious dose). The TCID50 mL−1 values were transformed to PFU mL−1 by using the formula PFU mL−1 = TCID50 mL−1 × 0.7.3.6. SARS-CoV-2 RT-qPCR analysis
A PCR method developed by the French Reference Center for respiratory viruses was used.48 This method is a duplex RT-qPCR targeting two regions in the RdRp gene, namely IP2 and IP4. G6PDH RT-qPCR using primers G6PDH-6(GAAGGTGAAGGTCGGAGT), G6PDH-231(GAAGATGGTGATGGGATTTC) and the probe G6PDH-202(5′FAM-CAAGCTTCCCGTTCTCAGCC-3′BHQ) was additionally performed to monitor for specimen quality, extraction and PCR inhibition. Undetectable SARS-CoV-2 levels were set to Ct = 40. Amplification was performed on 7500 real-time PCR system (Applied Biosystems, USA).3.7. Clinical study
CorDial-S study “Rapid, ultrasensitive and parallel COVID-19 detection” is a case control study that enrolled in total 119 participants from consultation (outpatient), hospitalisation and intensive care unit (mean age: 55 ± 16 years (min = 5 year, max = 91 years), sex ratio male/female: 1.2) including the 50 first people with a positive diagnosis of SARS-CoV-2 and the 69 first people with a negative diagnosis of SARS-CoV-2 by the medical team (from September to November 2021). The same nasopharyngeal swabs were used for COVID-19 RT-qPCR and SPR measurements under the CorDial-S study.The study (Ref. Protocol: 2021/0063; Ref. IDRCB: 2021-A00387-34; Ref. promotor CHU of Lille: 21.02.11.57302) was approved by the independent ethics committee of Ile de France Paris IX on 7th of April 2021 (No. 2021/22). The study has been registered on https://ClinicalTrials.gov ID: NCT04780334. All the persons provided written, informed consent before screening and inclusion. All experiments are performed in compliance with the CHU Lille guidelines and French ethic commissions.
3.8. Machine learning
Standard scaling was used to get all sensorgrams with the same size and with 0 as mean and 1 as variance, which allows suppressing variations due to dispersion of the signal and transforming all sensorgrams to the same scale.34 A multi-layer perceptron classifier has been used29–31 and k-fold cross validation (k = 10) has been implemented to avoid adverse effects of overtraining.32 The training was performed with the stochastic gradient descent as an optimization algorithm with 1000 epochs. The architecture of models consisted in 80 neurons with hyperbolic tangent as activation function, distributed in two hidden layers (60:20) for 1 min sampling time and in four hidden layers (30:20:20:10) for the 250 ms sampling time. The learning rate coefficient was increased from 0.001 for the 15 min sensorgram length to 0.010 for the 1 min sensorgram length. The database was splitted 70% and 30% for training and testing, respectively, and F1-score has been used as an optimization parameter.35 The test database contained 15 positive cases and 21 negative cases (36 sensorgrams). Metrics (accuracy, precision, sensitivity, specificity, F1-score, and Cohen's Kappa coefficient) were calculated from the confusion matrix obtained by execution of each model over the test database.
Conflicts of interest
There are no conflicts to declare.Acknowledgements
The project is funded by the Horizon 2020 framework programme of the European Union under grant agreement No. 101016038 (CorDial-S). This work was supported by the Belgian F.R.S. – FNRS under Grant No. R.8008.21. Financial support by ANR via CorDial-Flu is in addition acknowledged. The authors wish to thank Francoise Leal, Laurent Schwarb, Pascal Thyot, Yanick Njosse, Khadija Alioui, Zineb Beladaci, Zahoua Haddadi, Rabah Tezkratt, Laure Mariller, Hajar Chouiki.References
- J. Dinnes, J. J. Deeks, S. Berhane, M. Taylor, A. Adriano, C. Davenport, S. Dittrich, D. Emperador, Y. Takwoingi, J. Cunningham, S. Beese, J. Domen, J. Dretzke, L. Ferrante Di Ruffano, I. M. Harris, M. J. Price, S. Taylor-Phillips, L. Hooft, M. M. Leeflang, M. D. Mcinnes, R. Spijker and A. Van Den Bruel, Cochrane Database Syst. Rev., 2020, 8, CD013705 Search PubMed.
- V. M. Corman, V. C. Haage, T. Bleicker, M. L. Schmidt, B. Mühlemann, M. Zuchowski, W. K. Jo, P. Tscheak, E. Möncke-Buchner, M. A. Müller, A. Krumbholz, J. F. Drexler and C. Drosten, Lancet Microbe, 2021, 2, e311–e319 CrossRef CAS PubMed.
- Y. Mardian, H. Kosasih, M. Karyana, A. Neal and C.-Y. Lau, Front. Med., 2021, 8, 615099 CrossRef PubMed.
- A. Crozier, S. Rajan, I. Buchan and M. Mckee, BMJ, 2021, 372, n208 CrossRef PubMed.
- T. Chaibun, J. Puenpa, T. Ngamdee, N. Boonapatcharoen, P. Athamanolap, A. P. O'Mullane, S. Vongpunsawad, Y. Poovorawan, S. Y. Lee and B. Lertanantawong, Nat. Commun., 2021, 12, 802 CrossRef CAS PubMed.
- L. Fabiani, M. Saroglia, G. Galatà, R. De Santis, S. Fillo, V. Luca, G. Faggioni, N. D'Amore, E. Regalbuto, P. Salvatori, G. Terova, D. Moscone, F. Lista and F. Arduini, Biosens. Bioelectron., 2021, 171, 112686 CrossRef CAS PubMed.
- K. Guo, S. Wustoni, A. Koklu, E. Díaz-Galicia, M. Moser, A. Hama, A. A. Alqahtani, A. N. Ahmad, F. S. Alhamlan, M. Shuaib, A. Pain, I. Mcculloch, S. T. Arold, R. Grünberg and S. Inal, Nat. Biomed. Eng., 2021, 5, 666–677 CrossRef CAS PubMed.
- H. Yousefi, A. Mahmud, D. Chang, J. Das, S. Gomis, J. B. Chen, H. Wang, T. Been, L. Yip, E. Coomes, Z. Li, S. Mubareka, A. McGeer, N. Christie, S. Gray-Owen, A. Cochrane, J. M. Rini, E. H. Sargent and S. O. Kelley, J. Am. Chem. Soc., 2021, 143, 1722–1727 CrossRef CAS PubMed.
- J. Shang, G. Ye, K. Shi, Y. Wan, C. Luo, H. Aihara, Q. Geng, A. Auerbach and F. Li, Nature, 2020, 581, 221–224 CrossRef CAS PubMed.
- S. Szunerits, Q. Pagneux, A. Swaidan, V. Mishyn, A. Roussel, C. Cambillau, D. Devos, I. Engelmann, E. K. Alidjinou, H. Happy and R. Boukherroub, Anal. Bioanal. Chem., 2022, 414, 103–113 CrossRef CAS PubMed.
- O. Vandenberg, D. Martiny, O. Rochas, A. Van Belkum and Z. Kozlakidis, Nat. Rev. Microbiol., 2021, 19, 171–183 CrossRef CAS PubMed.
- G. Seo, G. Lee, M. J. Kim, S.-H. Baek, M. Choi, K. B. Ku, C.-S. Lee, S. Jun, D. Park, H. G. Kim, S.-J. Kim, J.-O. Lee, B. T. Kim, E. C. Park and S. I. Kim, ACS Nano, 2020, 14, 5135–5142 CrossRef CAS PubMed.
- C. Gil, T. Ginex, I. Maestro, V. Nozal, L. Barrado-Gil, M. Á. Cuesta-Geijo, J. Urquiza, D. Ramírez, C. Alonso, N. E. Campillo and A. Martinez, J. Med. Chem., 2020, 63, 12359–12386 CrossRef CAS PubMed.
- Q. Pagneux, H. Saada, A. Roussel, C. Cambillau, B. Amigues, V. Delauzun, I. Engelmann, E. K. Alidjinou, J. Ogiez, A. S. Rolland, E. Faure, J. Poissy, A. Duhamel, R. Boukherroub, D. Devos and S. Szunerits, Commun. Med., 2022, 2, 56 CrossRef PubMed.
- A. M. Shrivastav, U. Cvelbar and I. Abdulhalim, Commun. Biol., 2021, 4, 70 CrossRef CAS PubMed.
- A. R. Gutgsell, A. Gunnarsson, P. Forssén, E. Gordon, T. Fornstedt and S. Geschwindner, Anal. Chem., 2022, 94, 1187–1194 CrossRef CAS PubMed.
- D. Wrapp, D. De Vlieger, K. S. Corbett, G. M. Torres, N. Wang, W. Van Breedam, K. Roose, L. Van Schie, V.-C. C.-R. Team, M. Hoffmann, S. Pöhlmann, B. S. Graham, N. Callewaert, B. Schepens, X. Saelens and J. S. McLellan, Cell, 2020, 181, 1004–1015 CrossRef CAS PubMed.
- L. Zhang, X. Fang, X. Liu, H. Ou, H. Zhang, J. Wang, Q. Li, H. Cheng, W. Zhang and Z. Luo, Chem. Commun., 2020, 56, 10235–10238 RSC.
- H. Yoo, J. Shin, J. Sim, H. Cho and S. Hong, Biosens. Bioelectron., 2020, 168, 112561 CrossRef CAS PubMed.
- T. J. Park, M. S. Hyun, H. J. Lee, S. Y. Lee and S. Ko, Talanta, 2009, 79, 295–301 CrossRef CAS PubMed.
- L. Huang, L. Ding, J. Zhou, S. Chen, F. Chen, C. Zhao, J. Xu, W. Hu, J. Ji, H. Xu and G. L. Liu, Biosens. Bioelectron., 2021, 171, 112685 CrossRef CAS PubMed.
- T. B. A. Akib, S. F. Mou, M. M. Rahman, M. M. Rana, M. R. Islam, I. M. Mehedi, M. A. P. Mahmud and A. Z. Kouzani, Sensors, 2021, 21, 3491 CrossRef PubMed.
- X. Wang, Y. Zeng, J. Zhou, J. Chen, R. Miyan, H. Zhang, J. Qu, H.-P. Ho, B. Z. Gao and Y. Shao, Anal. Chem., 2021, 93, 828–833 CrossRef CAS PubMed.
- S. S. Zhao, N. Bukar, J. L. Toulouse, D. Pelechacz, R. Robitaille, J. N. Pelletier and J.-F. Masson, Biosens. Bioelectron., 2015, 64, 664–670 CrossRef CAS PubMed.
- A. Djaileb, M. Hojjat Jodaylami, J. Coutu, P. Ricard, M. Lamarre, L. Rochet, S. Cellier-Goetghebeur, D. Macaulay, B. Charron, É. Lavallée, V. Thibault, K. Stevenson, S. Forest, L. S. Live, N. Abonnenc, A. Guedon, P. Quessy, J.-F. Lemay, O. Farnós, A. Kamen, M. Stuible, C. Gervais, Y. Durocher, F. Cholette, C. Mesa, J. Kim, M.-P. Cayer, M.-J. De Grandmont, D. Brouard, S. Trottier, D. Boudreau, J. N. Pelletier and J.-F. Masson, Analyst, 2021, 146, 4905–4917 RSC.
- J. Hastanin, C. Lenaerts, P. Gailly, F. Rabecki, A. Roobroeck, S. Desprez, D. Bernier, F. Dortu, C. Dekuijper, D. Lanterbecq, K. Lecointe, B. Sendid, M. Bouazaoui, S. Maricot, M.-T. Bakouche, S. Ganesan, J.-P. Vilcot and K. Fleury-Frenette, Proc. SPIE, 2020, 11361, 113610P Search PubMed.
- P. Moitra, M. Alafeef, K. Dighe, M. B. Frieman and D. Pan, ACS Nano, 2020, 14, 7617–7627 CrossRef CAS PubMed.
- G. Moon, T. Son, H. Lee and D. Kim, Anal. Chem., 2019, 91, 9538–9545 CrossRef CAS PubMed.
- F. Cui, Y. Yue, Y. Zhang, Z. Zhang and H. S. Zhou, ACS Sens., 2020, 5, 3346–3364 CrossRef CAS PubMed.
- C. Gangloff, S. Rafi, G. Bouzillé, L. Soulat and M. Cuggia, Sci. Rep., 2021, 11, 17577 CrossRef CAS PubMed.
- S. Aktar, M. M. Ahamad, M. Rashed-Al-Mahfuz, A. Azad, S. Uddin, A. Kamal, S. A. Alyami, P.-I. Lin, S. M. S. Islam, J. M. Quinn, V. Eapen and M. A. Moni, JMIR Med. Inform., 2021, 9, e25884 CrossRef PubMed.
- B. G. Marcot and A. M. Hanea, Comput. Stat., 2021, 36, 2009–2031 CrossRef.
- Z. A. A. Alyasseri, M. A. Al-Betar, I. A. Doush, M. A. Awadallah, A. K. Abasi, S. N. Makhadmeh, O. A. Alomari, K. H. Abdulkareem, A. Adam, R. Damasevicius, M. A. Mohammed and R. A. Zitar, Expert Syst., 2021, e12759 Search PubMed.
- G. Renner, A. Nellessen, A. Schwiers, M. Wenzel, T. C. Schmidt and J. Schram, TrAC, Trends Anal. Chem., 2019, 111, 229–238 CrossRef CAS.
- S. M. Abd Elrahman and A. Abraham, J. Netw. Innov. Comput., 2013, 1, 332–340 Search PubMed.
- K. Thadson, S. Sasivimolkul, P. Suvarnaphaet, S. Visitsattapongse and S. Pechprasarn, Sci. Rep., 2022, 12, 2052 CrossRef CAS PubMed.
- S. Baidya and A. M. Hassan, IEEE Trans. Nanobiosci., 2022 DOI:10.1109/tnb.2022.3156077.
- C. Rodríguez Díaz, N. Lafuente-Gómez, C. Coutinho, D. Pardo, H. Alarcón-Iniesta, M. López-Valls, R. Coloma, P. Milán-Rois, M. Domenech, M. Abreu, R. Cantón, J. C. Galán, R. Bocanegra, L. A. Campos, R. Miranda, M. Castellanos and Á. Somoza, Talanta, 2022, 243, 123393 CrossRef PubMed.
- R. B. M. Schasfoort, in Handbook of Surface Plasmon Resonance, Royal Society of Chemistry, 2017, pp. 1–26, 10.1039/9781788010283-00001.
- M. Hojjat Jodaylami, A. Djaïleb, P. Ricard, É. Lavallée, S. Cellier-Goetghebeur, M.-F. Parker, J. Coutu, M. Stuible, C. Gervais, Y. Durocher, F. Desautels, M.-P. Cayer, M. J. De Grandmont, S. Rochette, D. Brouard, S. Trottier, D. Boudreau, J. N. Pelletier and J.-F. Masson, Sci. Rep., 2021, 11, 21601 CrossRef CAS PubMed.
- D. M. Charbonneau, A. Aubé, N. M. Rachel, V. Guerrero, K. Delorme, J. Breault-Turcot, J.-F. Masson and J. N. Pelletier, ACS Omega, 2017, 2, 2114–2125 CrossRef CAS PubMed.
- T. Brulé, G. Granger, N. Bukar, C. Deschênes-Rancourt, T. Havard, A. R. Schmitzer, R. Martel and J.-F. Masson, Analyst, 2017, 142, 2161–2168 RSC.
- M. Gdoura, I. Abouda, M. Mrad, I. Ben Dhifallah, Z. Belaiba, W. Fares, A. Chouikha, M. Khedhiri, K. Layouni, H. Touzi, A. Sadraoui, W. Hammemi, Z. Meddeb, N. Hogga, S. Ben Fadhel, S. Haddad-Boubaker and H. Triki, Virol. J., 2022, 19, 54 CrossRef CAS PubMed.
- S. Pickering, R. Batra, B. Merrick, L. B. Snell, G. Nebbia, S. Douthwaite, F. Reid, A. Patel, M. T. Kia Ik, B. Patel, T. Charalampous, A. Alcolea-Medina, M. J. Lista, P. R. Cliff, E. Cunningham, J. Mullen, K. J. Doores, J. D. Edgeworth, M. H. Malim, S. J. D. Neil and R. P. Galão, Lancet Microbe, 2021, 2, e461–e471 CrossRef CAS PubMed.
- WHO COVID-19 case definition, 2020, Last accessed February 21, 2022, https://www.who.int/publications/i/item/WHO-2019-nCoV-Surveillance_Case_Definition-2020.2.
- C. Spearman, Br. J. Psychol., 1908, 2, 227–242 Search PubMed.
- G. Kärber, Naunyn Schmiedebergs Arch. Pharmacol., 1931, 162, 480–483 CrossRef.
- Pasteur Institute RT-PCR protocol (WHO) for the detection of SARS-CoV-2, Paris, France, 2020, Last accessed January 12, 2021, https://www.who.int/docs/default-source/coronaviruse/real-time-rt-pcr-assays-for-the-detection-of-sars-cov-2-institut-pasteur-paris.pdf?sfvrsn=3662fcb6_2 Search PubMed.
Footnote |
| † Electronic supplementary information (ESI) available. See DOI: https://doi.org/10.1039/d2sd00087c |
| This journal is © The Royal Society of Chemistry 2022 |