 Open Access Article
Creative Commons Attribution 3.0 Unported Licence
Sensitive rGO/MOF based electrochemical sensor for penta-chlorophenol detection: a novel artificial neural network (ANN) application†
Hicham
Meskher
 *a,
Fethi
Achi
 a,
Sohmyung
Ha
bc,
Bahria
Berregui
a,
Fatiha
Babanini
a and
Hakim
Belkhalfa
d
a,
Sohmyung
Ha
bc,
Bahria
Berregui
a,
Fatiha
Babanini
a and
Hakim
Belkhalfa
d
aLaboratory of Valorization and Promotion of Saharian Resources (VPSR), Kasdi-Merbah University, Ouargla, 30000, Algeria. E-mail: hicham.meskher@gmail.com; hicham.meskher@g.enp.edu.dz
bDivision of Engineering, New York University Abu Dhabi, Abu Dhabi 129188, United Arab Emirates
cTandon School of Engineering, New York University, New York, NY 11201, USA
dCentre de Recherche Scientifique et Technique en Analyses Physico-chimiques (CRAPC), Bou-Ismail, Algeria
First published on 18th July 2022
Abstract
Hazardous phenols including penta-chlorophenol (5-CP) are considered an emerging global issue because they are toxic and harmful not only to the environment but also to the human health. Hence, detection of 5-CP traces is crucial for the safety. Compared to other analytical tools, electrochemical sensing approaches are cheap, fast, robust, and accurate in reliable characterization, identification, and quantification of 5-CP. For this purpose, this paper reports for the first time a novel synthesis procedure of an outstanding nanocomposite rGO/MOF and investigates its applicability to 5-CP identification. The synthesized materials were characterized by using scanning electron microscopy (SEM), X-ray diffraction (XRD), and X-ray fluorescence (XRF). The electrochemical analysis of the developed sensor using cyclic voltammetry (CV), electrochemical impedance spectroscopy (EIS), and square wave voltammetry (SWV) demonstrate that the synthesized sensor had a high electrical conductivity and a significantly high catalytic activity. At a potential of 0.7 V (vs. SCE), 5-CP exhibits distinct oxidation peaks in the measured CV curves. The sensor works well over a wide linear range of 5-CP concentrations ranging from 50 μM to 200 μM. It achieves a sensitivity of 3.4 nA nM−1 and a limit of detection of 75.63 nM, while the quantification limit is estimated to be around 254.54 nM. In addition, an artificial neural network (ANN) algorithm was developed and used to analyze the experimental data and offer an accurate estimation of 5-CP concentrations. The obtained results of the sensor are promising for the development of a low-cost 5-CP sensing system for in-field investigations (screening) of aquatic environments requiring the detection of environmental hazards.
Introduction
Organic pollution has been a global problem with substantial impacts on human health and the ecological system. Several studies showed that the presence of pentachlorophenol (5-CP), which is one of the most prominent phenol contaminants, in water is a critical issue.1,2 5-CP is extremely soluble in water, so it is much easier to pollute aquatic environments. 5-CP is also neurotoxic, mutagenic, teratogenic, and immunosuppressive due to low degradability and thermal stability. Moreover, at high doses, 5-CP can inhibit several essential enzymes and may also cause even DNA damages.3,4Quantification of 5-CP necessitates highly sensitive and selective analytical tools due to its low degradability and high toxicity. For quantitative monitoring of 5-CP, precise and reliable determination methods based on several chromatographic techniques have already been proposed.5–8 However, they are expensive and time-consuming, need a skilled operator, and are hard to implement.9,10 Alternatively, spectrophotometry has been investigated for 5-CP sensing.11 Despite their simplicity, speed, and low cost, the spectrophotometry-based methods gravely lack the selectivity.
On the contrary, electrochemical techniques provide sensitive platforms for determining phenolic compounds in a simple, quick, affordable, and selective manner.12–14 Electrochemical sensors have been widely used in the development of sensitive and selective instruments due to their high specific recognition, adsorption capacity for analytes, and chemical stability. Thus, electrochemical sensors have become a hot research topic as the nanotechnology and material science have advanced.15 As a result, electrochemical sensors based on advanced materials and novel composites have been attracting huge attention.16 Such advanced materials include metal and metal oxide,17 carbon nanotubes,18 metal–organic frameworks (MOF),19 and graphene20 and graphene oxide.21 Many of the sensors based on these materials have exhibited excellent sensitivity, low detection limit, fast response, and good selectivity in the detection of phenolic compounds.
Metal–organic frameworks (MOFs), which are one of such advanced materials, are made up of organic ligands and inorganic crystalline metal nodes.19 MOF-based electrochemical sensors have been recognized as a highly prospective instrument for determining numerous chemicals and biomolecules due to their huge specific area, numerous reactive sites, and excellent catalytic activity.22,23 Nevertheless, the isolating features of the organic ligands and the d-orbital engagement of coordination ions between the metal ions and organic ligands hinder electrons from delocalizing properly across the whole framework. As a result, MOFs have low conductivity and poor stability, limiting their applications in these domains. To avoid these problems, MOFs can be combined with other carbon-based materials, which can serve as supporting backgrounds, such as graphene, reduced graphene oxide (rGO), graphene quantum dot, and CNTs.24–30 Graphene is one of the most frequently used supports due to its remarkable properties, such as high surface area, porous structure, and good mechanical and outstanding electrical properties.31,32
As one of the popular conducting nanomaterials, rGO features its simple synthesis process, high conductivity, environmental stability, and biocompatibility.33,34 It is chemically inert and atomically smooth, thus hindering the adherence of active substances to the electrode surface and reducing electrode fouling. Hence, rGO is considered a promising material for the transportation of ions and electrons during electrochemical reactions. Moreover, rGO has benefits over graphene in the electron transfer rate, π-electron distribution, biocompatibility, density at active sites, and adsorption capacity.14
Besides, to predict and simulate the performance of the sensors quantitatively, various numerical simulations have been used, such as principal component analysis (PCA), multiple linear regression, partial least squares, and artificial neural network (ANN). Among these approaches, ANNs are considered efficient in quantitative prediction of (i) undetectable low concentrations that are too close to the sensor's detection limit (LOD) and (ii) the relationship between these concentrations and their exact responses. Moreover, ANNs have been widely employed to address the problem of response overlapping in a variety of applications, including healthcare applications,35 water acidity prediction,36 water quality analysis,37 and evaluation of the state of charge of lithium-ion batteries.38 However, no scientific papers have been published to date on 5-CP prediction using an ANN to overcome the sensor sensitivity limits. Therefore, in this work, by utilizing an ANN model, low concentrations of 5-CP from the sensor responses were predicted. The model's predictions under dynamical variables are presented and explored.
We herein present a novel three-dimensional (3D) MOF-based sensor for extremely sensitive 5-CP monitoring. The preparation methods presented in this work are quick, low-cost, and environmentally clean. In addition, they ensure the chemical stability of the synthesized nanomaterials. To improve the conductivity and the electron transfer of the sensing platform, the prepared MOF was doped with rGO. Furthermore, this paper also describes an ANN model that predicts 5-CP concentrations.
Methods
Chemicals
Monosodium and disodium phosphate, pentachlorophenol (5-CP), graphite, and other chemicals including ethanol and sodium hydroxide (NaOH) were obtained from Sigma-Aldrich. All the chemicals used in this work were at the analytical grade, and all the solutions were prepared using deionized water (DW).Instrumentation
The electrochemical experiments were conducted with a dynamic potentiostat (Metroohm Nova 2.0). A typical three-electrode system was used for the electrochemical detection of 5-CP. The integrated gold electrode (AuE) was used as the working electrode, a platinum electrode as the counter electrode, and an aqueous saturated calomel electrode (SCE) as the reference electrode. The synthesized nanoparticles and nanocomposites were confirmed and characterized by XRD and XFR (OLYMPUS BTX-716). Their surface morphology was studied using SEM analysis (ZEISS Ultra-55).Nanomaterial synthesis
To reduce GO, two solutions were prepared. The first one was obtained by dissolving 43 mg of NaOH in 43 ml of distilled water while the second solution consisted of 1 mg ml−1 of GO. Next, GO was carefully dropped onto the NaOH solution after heating for 3 minutes. The final mixture was kept under stirring for 30 minutes at 90 °C until the appearance of a black color indicated the formation of GO. To recover the rGO, the solution was filtered three times. The resulting mass was washed with distilled water and ethanol. This washing was carried out to clean the rGO from the amount which is not reduced and also to remove the excess of the reducing agent to neutralize the pH up to the value 7. The final mass obtained was dried for 12 hours at 60 °C.
Preparation of the modified gold electrodes (AuEs)
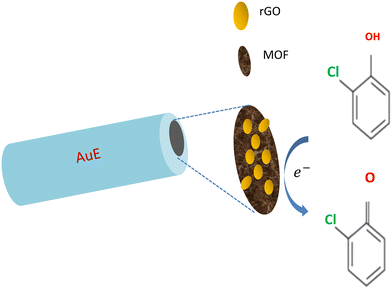
Bare AuEs were sequentially polished on a piece of cloth suede with 0.3 μM alumina slurry and were ultrasonically washed with water. The as-prepared rGO, MOF, and rGO/MOF were made into separate dispersions (3 mg mL−1) using ethanol. 3 μL of each of the above dispersions was separately coated on the surface of AuEs to obtain rGO/AuE, MOF/AuE, and rGO/MOF/AuE for further use. Scheme 1 shows the preparation procedure of rGO/MOF/AuE and its application for electrochemical sensing analysis of 5-CP.Electrochemical measurements
5-CP detection using the electrochemical sensor was performed as follows. First, appropriate amount of 5-CP standard solution was added into 0.1 M PBS (pH 7.0). Cyclic voltammetry (CV) and square voltammograms (SWV) measurements were performed over a potential range from 0.0 to 1.0 V at a scan rate of 100 mV s−1.Artificial neural network (ANN) data fitting procedure
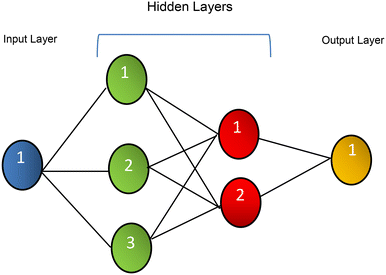
An artificial neural network (ANN) model was constructed to accurately estimate very low concentrations of 5-CP, extending the sensitivity limit of the 5-CP sensor. The model and the program were based on the Neural Network Toolbox of MATLAB R2017a (Mathworks, Natick, MA). The learning model of the developed ANN is illustrated in Scheme 2. Detailed implementation of the model is presented in section 3. | ||
| Scheme 2 The learning model of the ANN.39 Reproduced with permission from IEEE. | ||
Results and discussion
Characterization of the prepared monometallic MOF nanosheets
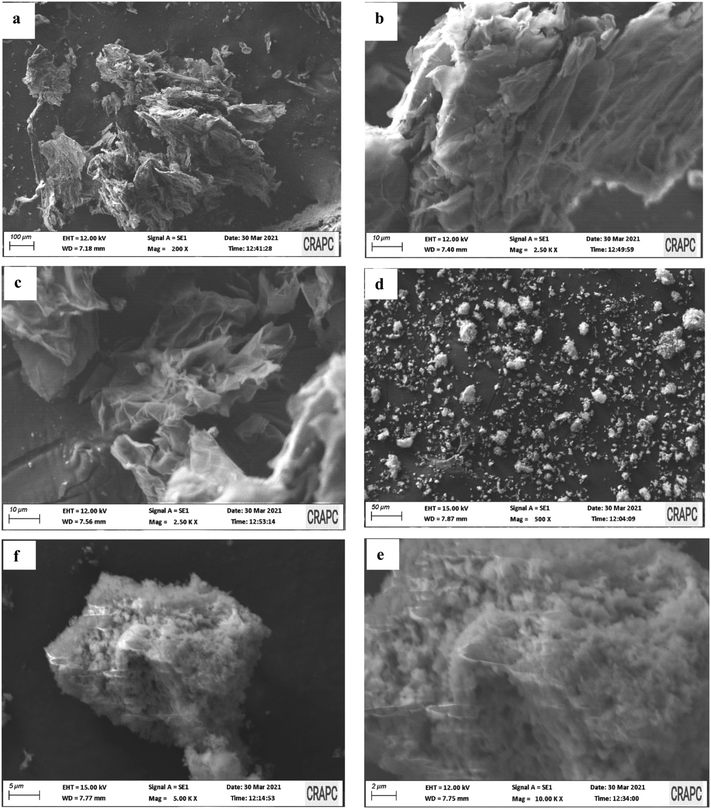
This section presents characterization process and results of the proposed synthesis method, including the proposed reduction process of GO and the nanostructure of as-synthesized MOF nanosheets. SEM, XRD, and XRF were used to analyze the rGO and MOF nanohybrids.SEM was next used to analyze the morphology of MOF nanosheets (NSs) and rGO, revealing the leaf-like structure of rGO as shown in Fig. 1(a–c). On the other hand, Fig. 1(d–f) presents the 3D sphere-like cluster structure of MOF NSs. The clusters are a few microns in size and are made up of ultrathin 3D spherical nanosheets.
Powder XRD patterns of the synthesized MOF NSs are shown in Fig. S1.† The major peaks are located at 9.3°, 15.6°, 18.3°, and 19.1°, which are in excellent accordance with those of the iron oxide phase,40 demonstrating that the MOF NSs were successfully synthesized. XRF measurements were also undertaken to investigate the presence of pure iron in the synthesized framework. As shown in Fig. S2,† an indication of pure iron appears as a strong peak of 300 Å with an energy of 6.5 KeV. Another less intense iron peak at 7 KeV was also present. In addition, extremely low-intensity peaks of other metals, such as chromium (Cr), copper (Vu), and cobalt (Co), are shown, revealing that the organometallic complex synthesized in this work is primarily based on iron oxide. As a result, the XRD and XRF data confirm that the synthesized composite is produced purely from the MOF framework.
Characterization of the electrode matrix
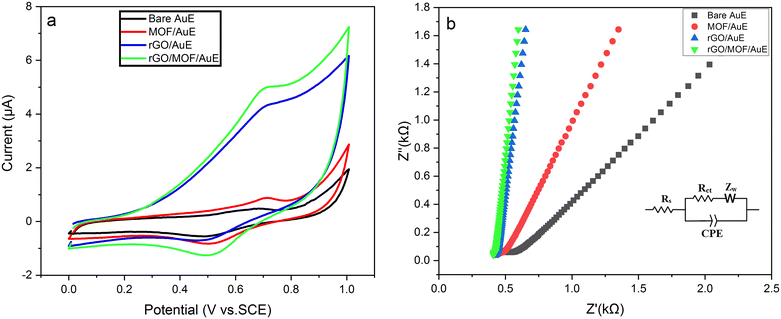
The properties of the sensor interfaces were also investigated by electrochemical impedance spectroscopy (EIS) using 0.1 M PBS with pH of 7.0 containing 5 mM of [Fe(CN)6]3−/4−. The Nyquist plot of EIS typically comes with two distinctive segments. The first one is the semicircular segment at higher frequencies expressing the load transfer resistance (Rct), and the other one is the linear portion at lower frequencies expressing the diffusion capacity. Diameter of the semicircle of the Nyquist plot is proportional to the charge transfer resistance (Rct value), which was obtained by the electrochemical circle fit option of Nova 2.0 software using the equivalent circuit model consisting of Rct, solution resistance (Rs), and Warburg impedance (Zw) (inset of Fig. 2b). The Rct value of the bare AuE is much higher than the other electrodes, and it is estimated to be around 550 Ω. It was observed that the semicircle diameter decreased after the electrode modification with MOF (Rct ≈ 280 Ω) and rGO (Rct ≈ 70 Ω), demonstrating that the electron transfer rate was accelerated. However, the Rct value of the rGO/MOF/AuE is around 55 Ω, suggesting a lower electron transfer rate compared with other electrodes. Hence, the rGO/MOF/AuE has a significantly decreased semi-circular segment, indicating a reduced charge transfer resistance and improved electron transfer rate due to the conductive nature of the rGO and high electron transfer rate of the MOF. These results agree with the CV curves and show that the proposed sensor has a lower load transfer resistance and a higher electron transfer rate compared to the other electrodes. This may be attributed also to the existence of the synergistic effect of the rGO and the MOF nanocomposites, which promote the electron transfer rate between the electrolytic solution and the electrode surface.
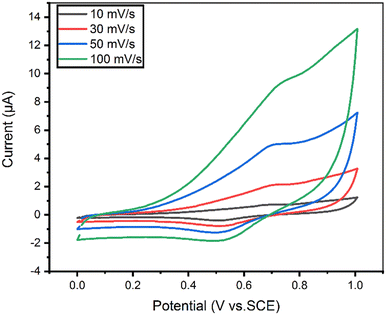 | ||
| Fig. 3 Effect of CV scan rate on 100 μM 5-CP in 0.1 M PBS for the rGO/MOF/AuE. The scan rate was varied to be 10, 30, 50, and 100 mV s−1. | ||
Fig. S3a† shows the relation between the peak current (I) and the scan rate (v). The redox peak currents of 5-CP are directly related to the scan rate values. The correlation coefficient value (R2) is 0.991 in the obtained result, indicating high linearity. The fitted linear equation is Ipa = 0.097 × ν − 0.368. Fig. S3b† shows the peak current (I) versus square root of the scan rate (v1/2). Here the correlation coefficient value (R2) is 0.97, and the fitted linear equation is Ipa = 1.30 × ν1/2 − 4.04. Consequently, the results indicate that the electron transfer mechanism is dominated by 5-CP controlled adsorption process. Moreover, the anodic peak potential (Epa) of 5-CP has a linear relationship with ln![[thin space (1/6-em)]](https://www.rsc.org/images/entities/char_2009.gif) ν, and the equation is Epa = 0.78 + 0.02 ln
ν, and the equation is Epa = 0.78 + 0.02 ln![[thin space (1/6-em)]](https://www.rsc.org/images/entities/char_2009.gif) ν (R2 = 0.9986, Fig. S3C† (see ESM)). Based on Laviron equation,41Epa is given as follows:
ν (R2 = 0.9986, Fig. S3C† (see ESM)). Based on Laviron equation,41Epa is given as follows:
Epa = E0 + (RT/αnF)ln(RTKs) + (RT/αnF)ln![[thin space (1/6-em)]](https://www.rsc.org/images/entities/char_2009.gif) V V |
where E0 is standard potential; n is the transferred electron number; α refers to the charge transfer coefficient; ks is the standard rate coefficient. Since α was equal to 0.5, n was calculated as 1.
Electrochemical detection of 5-CP
Square wave voltammetry (SWV) measurements with the rGO/MOF/AuE were done for various 5-CP concentrations ranging from 50 μM to 200 μM (Fig. 4a) using a standard addition technique in 0.1 M PBS with a scan rate of 100 mV s−1. As seen in Fig. 4b, Ipa is fitted to a linear equation as follows: Ipa (A cm−2) = 0.003 × C (μM) + 2.025 (R2 = 0.982), where the concentrations of 5-CP were in the range of 50–200 μM. The obtained detection limit (LOD) of the developed sensor is 75.63 nM, while the quantification limit (LOQ) is 254.54 nM. In addition, the fabricated sensor responds to a wide linear range of 5-CP concentrations from 50 μM to 200 μM with a sensitivity of 3.4 nA nM−1.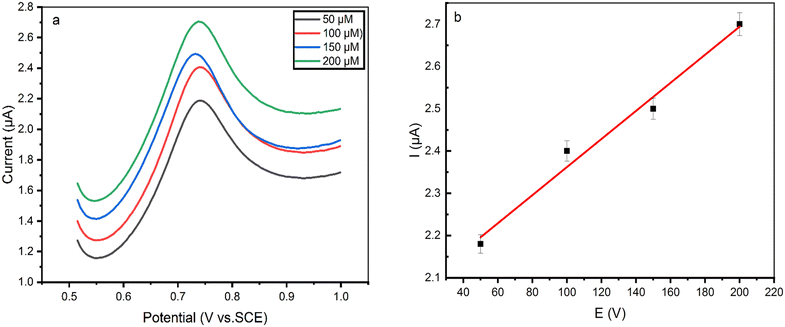 | ||
| Fig. 4 (a) SWV of rGO/MOF/AuE for various concentrations (50–200 μM 5-CP) in a 0.1 M PBS at a sweep rate of 0.05 V s−1. (b) Ipaversus 5-CP concentration. | ||
Compared to other MOF-based electrochemical 5-CP sensors, the presented rGO/MOF/AuE has a wider linear range and a lower LOD (as shown in Table 1) due to the enhanced electron transfer, high conductivity of rGO, and large specific surface area of MOF.
| Sensing interface | Linear range (μM) | LOD (μM) S/N = 3 | Ref. |
|---|---|---|---|
| FeOx/TiO2@mC | 5–310 | 0.18 | 42 |
| Zr-based UiO-66 | 0.0–1.0 | 0.18 | 43 |
| Zn-MOF | 0.2–12 | 0.12 | 44 |
| Nafion/ER-GO/GCE | 0.1–1.5 | 0.091 | 45 |
| WCrGO | 10–100 | 3.1 | 46 |
| MOF-818@RGO/MWCNTs-3 | 0.1–3 | 0.18 | 47 |
| N,P-rGO | 10–100 | 0.0997 | 48 |
| ZIF-8C@rGO | 0.5–70 | 0.076 | 49 |
| rGO/MOF | 50–200 | 0.075 | This work |
Reproducibility and repeatability of the rGO/MOF/AuE
As shown in Fig. 5a, reproducibility of the sensor was also investigated using 5 different modified electrodes. The relative standard deviation (RSD) of the electrodes was 3.858%, indicating good reproducibility of the sensor. In addition, repeatability of the developed 5-CP sensor was investigated by analyzing the response of 5 successive measurements using the same modified AuE in PBS containing 200 μM of 5-CP. The results are presented in Fig. 5b. The RSD was 5.1% for 5-CP, thereby exhibiting appreciable repeatability of the produced sensor.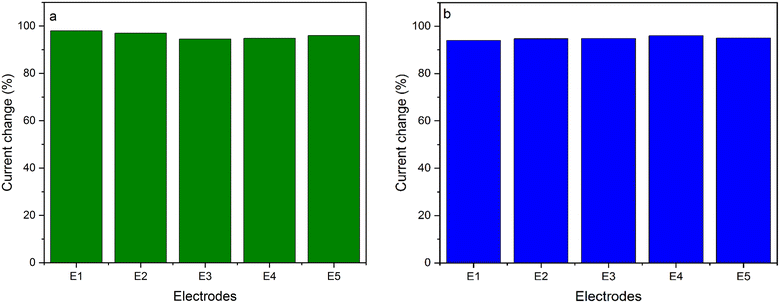 | ||
| Fig. 5 (a) Reproducibility test for 5 rGO/MOF/AuE in the presence of 200 μM of 5-CP. (b) Repeatability test for 5 rGO/MOF/AuE in the presence of 200 μM of 5-CP. | ||
Data analysis of 5-CP using ANN
In this work, we used an artificial neural network (ANN) algorithm created in MATLAB 6.1 (Mathworks, Natick, MA) utilizing the Neural Network Toolbox, version 4.0, for more accurate detection. As depicted in Scheme 3, the ANN model is composed of three layers: (i) the input layer of analyte responses; (ii) two hidden layers, the first of which contains three neurons and the second of which contains two neurons; and (iii) the output layer, which represents a three-digit value that identifies the concentration of 5-CP. Table 2 shows the ANN model's detailed structure and architecture. The developed ANN model was trained to identify 5-CP and provide an approximate estimate of the concentration by rounding the output to the nearest quantized concentration number, ranging from LOD (75 nM) to 200 μM.| 5-CP ANN | |
|---|---|
| Inputs | 5-CP concentrations (μM) |
| Output | Current response (μA) |
| Layers | 4 |
| Hidden layer | 2 |
| Hidden neurons | 5 |
| Transfer functions | Logsig/Logsig/purelin |
| Train function | Traingdm (batch gradient descent with momentum algorithm) |
| Learning rate | 0.1 (10%) |
| Train epochs | 8000 |
| Mean squad error (MSE) | 10−30 |
| Number of training data | 100% |
| MSE saturation (best) | 9.4744 × 10⁻¹² |
| Performance epochs (best) | 1358 |
The ANN was trained by repeatedly inputting the experimental results including the sensor channel responses to 5-CP at four concentrations (50 μM, 100 μM, 150 μM, and 200 μM). The Levenberg–Marquardt approach was used in the ANN training method to maximize the neurons' weights in the hidden layers. Using the limited experimental results of this research, this algorithm appears to be the fastest way for network training. The activation function for the hidden neurons was a log-sigmoid, while the activation function for the output neurons was a log-purelin function. The training was performed for 8000 epochs with a mean square error (MSE) goal set to 10−20 and a learning rate set to 0.1 (10%). However, 1358 epochs were enough to reach ESM saturation at 9.4744 × 10⁻¹², as shown in Fig. 6.
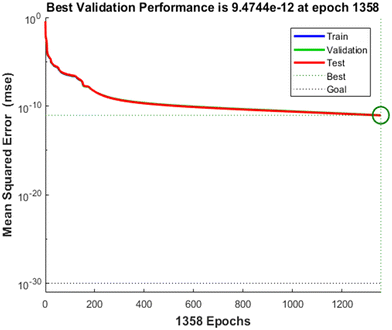 | ||
| Fig. 6 Mean squared error (MSE) over the trained epochs of the ANN. The learning rate (LR) was set to 10%. | ||
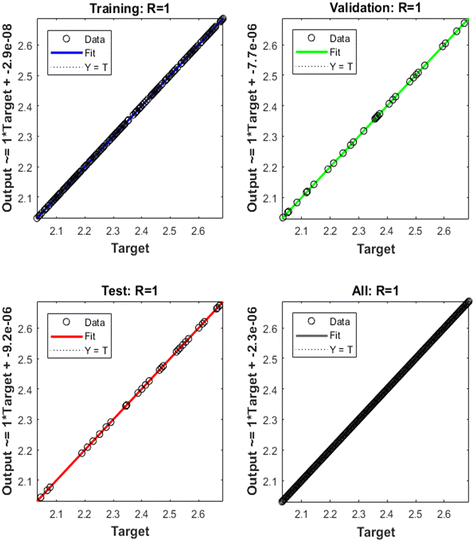
Fig. 7 shows the training, validation, and testing data. The solid line holds the best fit regression analysis line between the outputs and targets in each plot, while the dashed line represents the perfect result for the case where outputs = targets. The correlation factor R-value presents the relationship between the outputs and targets for 5-CP concentrations. The training data show that the ANN model fits to the 5-CP sensor well. The validation and test data have a very high R-value as well. The scatter plots demonstrate that great fitting is achieved with the constructed ANN in this work. Following the training, the ANN algorithm was put to the test by feeding it with data from the proposed sensor for PBS solutions with a specific concentration of the pollutant chosen randomly from the LOD (75 nM) to 200 μM. Table 3 summarizes the outcomes of each test.
| Real 5-CP concentration (μM) | 5-CP oxidation current (μA) | Estimated 5-CP concentration (μM) | 5-CP oxidation current (μA) |
|---|---|---|---|
| 0.075 | Not applicable (NA) at the lab | 0.075 | 2.0303 |
| 0.25 | NA | 0.25 | 2.0308 |
| 0.50 | NA | 0.50 | 2.0317 |
| 0.75 | NA | 0.75 | 2.0325 |
| 1.00 | NA | 1.00 | 2.0333 |
| 5.00 | NA | 5.00 | 2.0465 |
| 10.0 | NA | 10.0 | 2.0630 |
| 20.0 | NA | 20.0 | 2.0960 |
| 30.0 | NA | 30.0 | 2.1290 |
| 40.0 | NA | 40.0 | 2.1620 |
| 50.0 | 2.187 | 50.0 | 2.1950 |
| 65.0 | NA | 65.0 | 2.2445 |
| 80.0 | NA | 80.0 | 2.2940 |
| 93.0 | NA | 93.0 | 2.3369 |
| 100 | 2.400 | 100 | 2.3600 |
| 110 | NA | 110 | 2.3930 |
| 130 | NA | 130 | 2.4590 |
| 140 | NA | 140 | 2.4920 |
| 150 | 2.500 | 150 | 2.5250 |
| 160 | NA | 160 | 2.5580 |
| 170 | NA | 170 | 2.5910 |
| 190 | NA | 190 | 2.6570 |
| 200 | 2.702 | 200 | 2.6900 |
The ANN's final result is a three-digit code that indicates the concentration of 5-CP rounded to the closest quantized concentration value. Despite having a limited quantity of data for the ANN training, the model can accurately estimate the pollutant concentration with a tiny inaccuracy, as shown in Fig. 8. The comparison of values in the last two columns indicating the obtained and actual concentrations of pollutants reveals that the concentration was accurately estimated. For the sample with 5-CP concentration of 200 μM, the detected concentration with the ANN is 199 μM. Similarly, for the sample with 5-CP concentration of 50 μM, the estimated concentration from the ANN is 50.15 μM. As shown, the proposed ANN can accurately detect the 5-CP concentrations.
 | ||
| Fig. 8 (a) ANN prediction error; (b) and (c) comparison between the real concentration values (green) and the predicted ones (red) obtained by the developed ANN. | ||
The results are quite encouraging since simple electrochemical measurements of the anodic current combined with the ANN-based data processing allow for the identification of the contaminants and a reasonably accurate estimate of their quantities.
Conclusion
In this paper, we presented a new electrochemical sensor based on rGO/MOF for 5-CP measurements. The rGO/MOF hybrid offers sufficient reactive sites and electrocatalytic activity toward 5-CP as a sensor matrix. For the detection of 5-CP, the proposed sensor performs well with excellent sensitivity and a low detection limit. Then, based on this composite, an electrochemical sensing platform with excellent sensitivity and potential applicability was built. As a result of the research, the proposed sensing element may open up new avenues for the design and production of other sensitive sensing systems for various applications in the future.Moreover, the current study reported the usage of ANN to tackle the sensor's problem of detecting low 5-CP concentrations near the LOD. The difficulty of monitoring and identifying 5-CP in aqueous systems were improved by using the ANN. Using the experimental findings of the proposed sensor toward 5-CP, the analysis and control procedure were carried out. The use of the ANN for data processing allows for more accurate detection of low-concentration 5-CP instantaneously, allowing for real-time monitoring of the pollutant from LOD to 200 μM.
The usage of ANN is capable of increasing the sensor sensitivity and evaluating real-world data. The ANN program should be able to identify contaminants in complicated samples with a combination of contaminants. Pollutant concentration evaluation should also be more exact, so more ANN algorithms implementing a polynomial approximation of concentration dependence of sensor responses should be constructed.
Conflicts of interest
The authors declare no competing interests.Acknowledgements
We acknowledge the Algerian Ministry of Higher Education and Scientific Research and also the general Aagency of Scientific Research and Technological Development (DGRSDT) for their support.References
- D. P. Daswat and M. Mukhopadhyay, Effect of UV Input on Degradation of 4-Chlorophenol by Peroxy Acetic Acid, Arabian J. Sci. Eng., 2014, 39(8), 5873–5881, DOI:10.1007/s13369-014-1257-6.
- F. S. Arghavan, A. Hossein Panahi, N. Nasseh and M. Ghadirian, Adsorption-photocatalytic processes for removal of pentachlorophenol contaminant using FeNi3/SiO2/ZnO magnetic nanocomposite under simulated solar light irradiation, Environ. Sci. Pollut. Res., 2021, 28(6), 7462–7475, DOI:10.1007/s11356-020-10927-5.
- M. Zhang, D. Yin and F. Kong, The changes of serum testosterone level and hepatic microsome enzyme activity of crucian carp (Carassius carassius) exposed to a sublethal dosage of pentachlorophenol, Ecotoxicol. Environ. Saf., 2008, 71(2), 384–389, DOI:10.1016/j.ecoenv.2007.10.014.
- N. Maheshwari, F. H. Khan and R. Mahmood, pentachlorophenol-induced cytotoxicity in human erythrocytes: enhanced generation of ROS and RNS, lowered antioxidant power, inhibition of glucose metabolism, and morphological changes, Environ. Sci. Pollut. Res., 2008, 26(13), 12985–13001, DOI:10.1007/s11356-019-04736-8.
- Z. R. Roberson and J. V. Goodpaster, Optimization of the qualitative and quantitative analysis of cocaine and other drugs of abuse via gas chromatography – Vacuum ultraviolet spectrophotometry (GC – VUV), Talanta, 2021, 222, 121461, DOI:10.1016/j.talanta.2020.121461.
- M. B. Ali, et al., Co 2 SnO 4 nanoparticles as a high performance catalyst for oxidative degradation of rhodamine B dye and pentachlorophenol by activation of peroxymonosulfate, Phys. Chem. Chem. Phys., 2017, 19(9), 6569–6578, 10.1039/C6CP08576H.
- Y.-Q. Wang, et al., In vitro and in silico investigations of the binding interactions between chlorophenols and trypsin, J. Hazard. Mater., 2014, 278, 55–65, DOI:10.1016/j.jhazmat.2014.05.092.
- F. Chen, L. Zhao, W. Yu, Y. Wang, H. Zhang and L.-H. Guo, Dynamic monitoring and regulation of pentachlorophenol photodegradation process by chemiluminescence and TiO2/PDA, J. Hazard. Mater., 2020, 399, 123073, DOI:10.1016/j.jhazmat.2020.123073.
- J.-Q. Qiao, et al., Determination of catalytic oxidation products of phenol by RP-HPLC, Res. Chem. Intermed., 2012, 38(2), 549–558, DOI:10.1007/s11164-011-0370-3.
- L. Gámiz-Gracia, A. M. García-Campaña, J. F. Huertas-Pérez and F. J. Lara, Chemiluminescence detection in liquid chromatography: Applications to clinical, pharmaceutical, environmental and food analysis—A review, Anal. Chim. Acta, 2009, 640(1–2), 7–28, DOI:10.1016/j.aca.2009.03.017.
- P. Xiao and R. Kondo, Biodegradation and biotransformation of pentachlorophenol by wood-decaying white rot fungus Phlebia acanthocystis TMIC34875, J. Wood Sci., 2020, 66(1), 2, DOI:10.1186/s10086-020-1849-6.
- L. Fu, Y. Zheng, A. Wang, W. Cai, B. Deng and Z. Zhang, An Electrochemical Sensor Based on Reduced Graphene Oxide and ZnO Nanorods-Modified Glassy Carbon Electrode for Uric Acid Detection, Arabian J. Sci. Eng., 2016, 41(1), 135–141, DOI:10.1007/s13369-015-1621-1.
- C. Karaman, O. Karaman, N. Atar and M. L. Yola, Tailoring of cobalt phosphide anchored nitrogen and sulfur co-doped three dimensional graphene hybrid: Boosted electrocatalytic performance towards hydrogen evolution reaction, Electrochim. Acta, 2021, 380, 138262, DOI:10.1016/j.electacta.2021.138262.
- H. Meskher, F. Achi, A. Zouaoui, S. Ha, M. Peacock and H. Belkhalfa, Simultaneous and Selective Electrochemical Determination of Catechol and Hydroquinone on A Nickel Oxide (NiO) Reduced Graphene Oxide (rGO) Doped Multiwalled Carbon Nanotube (fMWCNT) Modified Platinum Electrode, Anal. Lett., 2022, 55(9), 1466–1481, DOI:10.1080/00032719.2021.2008951.
- A. Fethi and M. Hicham, Carbon Electrodes as Emerging Platforms for Miniaturization of Electrochemical Biosensors, in Miniaturized Biosensing Devices, ed. P. Chandra and K. Mahato, Springer Nature Singapore, Singapore, 2022, pp. 39–55, DOI:10.1007/978-981-16-9897-2_2.
- M. A. Deshmukh, M. D. Shirsat, A. Ramanaviciene and A. Ramanavicius, Composites Based on Conducting Polymers and Carbon Nanomaterials for Heavy Metal Ion Sensing (Review), Crit. Rev. Anal. Chem., 2018, 48(4), 293–304, DOI:10.1080/10408347.2017.1422966.
- H. Boyacıoğlu, B. B. Yola, C. Karaman, O. Karaman, N. Atar and M. L. Yola, A novel electrochemical kidney injury molecule-1 (KIM-1) immunosensor based covalent organic frameworks-gold nanoparticles composite and porous NiCo2S4@CeO2 microspheres: The monitoring of acute kidney injury, Appl. Surf. Sci., 2022, 578, 152093, DOI:10.1016/j.apsusc.2021.152093.
- M. Hicham, A. Fethi, S. Ha and B. Khaldoun, Antifouling double layers of functionalized-multi-walled carbon nanotubes coated ZnO for sensitive and selective electrochemical detection of catechol, Fullerenes, Nanotubes, Carbon Nanostruct., 2022, 30(3), 334–347, DOI:10.1080/1536383X.2021.1940150.
- M. H. A. Tajuddin, et al., Metal Organic Framework in Membrane Separation for Wastewater Treatment: Potential and Way Forward, Arabian J. Sci. Eng., 2021, 46(7), 6109–6130, DOI:10.1007/s13369-021-05509-7.
- C. Karaman, O. Karaman, B. B. Yola, İ. Ülker, N. Atar and M. L. Yola, A novel electrochemical aflatoxin B1 immunosensor based on gold nanoparticle-decorated porous graphene nanoribbon and Ag nanocube-incorporated MoS 2 nanosheets, New J. Chem., 2021, 45(25), 11222–11233, 10.1039/D1NJ02293H.
- O. Karaman, N. Özcan, C. Karaman, B. B. Yola, N. Atar and M. L. Yola, Electrochemical cardiac troponin I immunosensor based on nitrogen and boron-doped graphene quantum dots electrode platform and Ce-doped SnO2/SnS2 signal amplification, Mater. Today Chem., 2022, 23, 100666, DOI:10.1016/j.mtchem.2021.100666.
- A. Banerjee, et al., MOF derived porous carbon–Fe3O4 nanocomposite as a high performance, recyclable environmental superadsorbent, J. Mater. Chem., 2012, 22(37), 19694, 10.1039/c2jm33798c.
- X. Chen, et al., In situ pyrolysis of Ce-MOF to prepare CeO2 catalyst with obviously improved catalytic performance for toluene combustion, Chem. Eng. J., 2018, 344, 469–479, DOI:10.1016/j.cej.2018.03.091.
- T. Noor, N. Zaman, H. Nasir, N. Iqbal and Z. Hussain, Electro catalytic study of NiO-MOF/rGO composites for methanol oxidation reaction, Electrochim. Acta, 2019, 307, 1–12, DOI:10.1016/j.electacta.2019.03.116.
- N. A. Travlou, K. Singh, E. Rodríguez-Castellón and T. J. Bandosz, Cu–BTC MOF–graphene-based hybrid materials as low concentration ammonia sensors, J. Mater. Chem. A, 2015, 3(21), 11417–11429, 10.1039/C5TA01738F.
- S. Rani, B. Sharma, R. Malhotra, S. Kumar, R. S. Varma and N. Dilbaghi, Sn-MOF@CNT nanocomposite: An efficient electrochemical sensor for detection of hydrogen peroxide, Environ. Res., 2020, 191, 110005, DOI:10.1016/j.envres.2020.110005.
- Y.-C. Chen, W.-H. Chiang, D. Kurniawan, P.-C. Yeh, K. Otake and C.-W. Kung, Impregnation of Graphene Quantum Dots into a Metal–Organic Framework to Render Increased Electrical Conductivity and Activity for Electrochemical Sensing, ACS Appl. Mater. Interfaces, 2019, 11(38), 35319–35326, DOI:10.1021/acsami.9b11447.
- A. M. P. Peedikakkal, A. A. Jimoh, M. N. Shaikh and B. E. Ali, Mixed-Metal Metal–Organic Frameworks as Catalysts for Liquid-Phase Oxidation of Toluene and Cycloalkanes, Arabian J. Sci. Eng., 2017, 42(10), 4383–4390, DOI:10.1007/s13369-017-2452-z.
- M. Zhang, et al., MOF/PAN nanofiber-derived N-doped porous carbon materials with excellent electrochemical activity for the simultaneous determination of catechol and hydroquinone, New J. Chem., 2019, 43(9), 3913–3920, 10.1039/C9NJ00417C.
- W. Dang, Y. Sun, H. Jiao, L. Xu and M. Lin, AuNPs-NH2/Cu-MOF modified glassy carbon electrode as enzyme-free electrochemical sensor detecting H2O2, J. Electroanal. Chem., 2020, 856, 113592, DOI:10.1016/j.jelechem.2019.113592.
- L. Zhang, et al., Porous 3D graphene-based bulk materials with exceptional high surface area and excellent conductivity for supercapacitors, Sci. Rep., 2013, 3(1), 1408, DOI:10.1038/srep01408.
- N. Atar and M. L. Yola, A novel QCM immunosensor development based on gold nanoparticles functionalized sulfur-doped graphene quantum dot and h-ZnS-CdS NC for Interleukin-6 detection, Anal. Chim. Acta, 2021, 1148, 338202, DOI:10.1016/j.aca.2021.338202.
- Y. Liu, et al., Biocompatible, High-Performance, Wet-Adhesive, Stretchable All-Hydrogel Supercapacitor Implant Based on PANI@rGO/Mxenes Electrode and Hydrogel Electrolyte, Adv. Energy Mater., 2021, 11(30), 2101329, DOI:10.1002/aenm.202101329.
- C. Karaman, O. Karaman, N. Atar and M. L. Yola, Sustainable electrode material for high-energy supercapacitor: biomass-derived graphene-like porous carbon with three-dimensional hierarchically ordered ion highways, Phys. Chem. Chem. Phys., 2021, 23(22), 12807–12821, 10.1039/D1CP01726H.
- I. Khelfaoui, Y. Xie, M. Hafeez, D. Ahmed, H. E. Degha and H. Meskher, Information Communication Technology and Infant Mortality in Low-Income Countries: Empirical Study Using Panel Data Models, Int. J. Environ. Res. Public Health, 2022, 19(12), 7338, DOI:10.3390/ijerph19127338.
- A. Habibi-Yangjeh, M. Danandeh-Jenagharad and M. Nooshyar, Application of artificial neural networks for predicting the aqueous acidity of various phenols using QSAR, J. Mol. Model., 2006, 12, 338–347, DOI:10.1007/s00894-005-0050-6.
- M. Hemmat Esfe and S. Alidoust, Modeling and Precise Prediction of Thermophysical Attributes of Water/EG Blend-Based CNT Nanofluids by NSGA-II Using ANN and RSM, Arabian J. Sci. Eng., 2021, 46(7), 6423–6437, DOI:10.1007/s13369-020-05086-1.
- Y. Liu, R. Zhang and W. Hao, Evaluation of the state of charge of lithium-ion batteries using ultrasonic guided waves and artificial neural network, Ionics, 2022, 28(7), 3277–3288, DOI:10.1007/s11581-022-04568-6.
- A. Begum, F. Fatima and A. Sabahath, Implementation of Deep Learning Algorithm with Perceptron using TenzorFlow Library, in 2019 International Conference on Communication and Signal Processing (ICCSP), Chennai, India, 2019, pp. 0172–0175, DOI:10.1109/ICCSP.2019.8697910.
- S. Bhattacharjee, J.-S. Choi, S.-T. Yang, S. B. Choi, J. Kim and W.-S. Ahn, Solvothermal Synthesis of MOF-74 and Its Catalytic Properties in Phenol Hydroxylation, J. Nanosci. Nanotechnol., 2010, 10(1), 135–141, DOI:10.1166/jnn.2010.1493.
- A. K. Rai, N. D. Kaushika, B. Singh and N. Agarwal, Simulation model of ANN based maximum power point tracking controller for solar PV system, Sol. Energy Mater. Sol. Cells, 2011, 95(2), 773–778, DOI:10.1016/j.solmat.2010.10.022.
- M. Wang, et al., Bimetallic metal–organic framework derived FeO /TiO2 embedded in mesoporous carbon nanocomposite for the sensitive electrochemical detection of 4-nitrophenol, Sens. Actuators, B, 2019, 281, 1063–1072, DOI:10.1016/j.snb.2018.11.083.
- A. Shahat, H. M. A. Hassan and H. M. E. Azzazy, Optical metal-organic framework sensor for selective discrimination of some toxic metal ions in water, Anal. Chim. Acta, 2013, 793, 90–98, DOI:10.1016/j.aca.2013.07.012.
- Y. Pan, J. Wang, X. Guo, X. Liu, X. Tang and H. Zhang, A new three-dimensional zinc-based metal-organic framework as a fluorescent sensor for detection of cadmium ion and nitrobenzene, J. Colloid Interface Sci., 2018, 513, 418–426, DOI:10.1016/j.jcis.2017.11.034.
- H. Filik, G. Çetintaş, A. A. Avan, S. Aydar, S. N. Koç and İ. Boz, Square-wave stripping voltammetric determination of caffeic acid on electrochemically reduced graphene oxide–Nafion composite film, Talanta, 2013, 116, 245–250, DOI:10.1016/j.talanta.2013.05.031.
- D. M. Stanković, M. Ognjanović, F. Martin, Ľ. Švorc, J. F. M. L. Mariano and B. Antić, Design of titanium nitride- and wolfram carbide-doped RGO/GC electrodes for determination of gallic acid, Anal. Biochem., 2017, 539, 104–112, DOI:10.1016/j.ab.2017.10.018.
- Y. Yan, X. Bo and L. Guo, MOF-818 metal-organic framework-reduced graphene oxide/multiwalled carbon nanotubes composite for electrochemical sensitive detection of phenolic acids, Talanta, 2020, 218, 121123, DOI:10.1016/j.talanta.2020.121123.
- Y. Liu, et al., A Sensitive Electrochemical Sensor Based on Dual Co-Doped N, P-rGO for Simultaneous Determination of Hydroquinone and Catechol, J. Electrochem. Soc., 2021, 168(1), 017514, DOI:10.1149/1945-7111/abdc67.
- H. Chen, X. Wu, C. Lao, Y. Li, Q. Yuan and W. Gan, MOF derived porous carbon modified rGO for simultaneous determination of hydroquinone and catechol, J. Electroanal. Chem., 2019, 835, 254–261, DOI:10.1016/j.jelechem.2019.01.027.
Footnote |
| † Electronic supplementary information (ESI) available. See DOI: https://doi.org/10.1039/d2sd00100d |
| This journal is © The Royal Society of Chemistry 2022 |

