
 Open Access Article
 This Open Access Article is licensed under a
 Creative Commons Attribution 3.0 Unported Licence
Opportunities and limitations of membrane-based preconcentration for rapid and continuous diagnostic applications†
Amy
Drexelius
 a,
Steve
Kim
b,
Saber
Hussain
b and
Jason
Heikenfeld
*a
a,
Steve
Kim
b,
Saber
Hussain
b and
Jason
Heikenfeld
*a
aNovel Devices Laboratory, University of Cincinnati, Cincinnati, OH 45221, USA. E-mail: heikenjc@ucmail.uc.edu
b711 Human Performance Wing, Air Force Research Laboratory, Wright-Patterson Air Force Base, OH 45433, USA
First published on 24th February 2022
Abstract
Modern rapid diagnostic tests have continued to improve in performance and convenience, including the proliferation of point-of-care and the emergence of continuous wearable diagnostics. Frequently, rapid diagnostic tests are challenged in their sensitivity and their limit of detection, especially for disease detection in its early stages where analyte concentration can be lower, leading to false negative test results. In response, preconcentration methods have been explored to increase analyte concentration in the collected sample. In theory, a particularly attractive approach is simple membrane preconcentration, whereby the membrane retains the analyte through size-selective filtration while removing water from the sample. This article reviews two leading methods for membrane-based preconcentration, high-pressure pneumatic and osmotic preconcentration, which have the greatest potential because they can operate with the speed (minutes) required for rapid diagnostic tests. Using these simple yet effective methods, analyte concentration can be rapidly increased by a factor of 100× or more, both in buffer and in biofluids. Data from previous studies and new data found only in this article now allows preliminary conclusions on the benefits and limitations of each method. Preconcentration amounts of 10× were achieved for bovine serum albumin and glucose using osmotic pressure, while preconcentration amounts of >160× were achieved for pregnancy hormone and >70× for flu using pneumatic pressure. While each method is more limited in utility than originally speculated, each method will be shown to have merit for niche applications of both point-of-care and continuous diagnostics, with particular value found in early disease detection.
Introduction
Rapid diagnostics are now ubiquitous; there are thousands of tests used to diagnose everything from the simpler ailments of daily life, such as urinary tract infections1 and strep throat,2 to complex disorders, such as diabetes3 and cancer.4 However, there are caveats to nearly every diagnostic test, including low accuracy in many cases.5,6 Low accuracy can either be the result of a lack of specificity (false positive) or lack of sensitivity (false negative).7 A tests' sensitivity is a measure of how often a test provides a ‘true positive’ result in comparison to a gold standard method of testing. For example, the sensitivity of rapid flu tests is often determined by comparing the number of positive tests to the number of actual flu cases as determined using a much slower approach of viral culture or more complex approach of polymerase chain reaction (PCR).8 The sensitivity of many rapid diagnostic tests, especially rapid tests such as point-of-care (POC) tests9–11 is often fairly poor due to low analyte load in the body, such as during the early stages of a viral infection. Therefore, researchers have been working for decades to determine methods which increase diagnostic test sensitivity.12 An alternative, arguably simpler, method of effectively increasing the test sensitivity is to increase the amount of analyte in the sample. Even though the detection limit of the assay remains the same, the amount of analyte in the sample could be brought above the limit of detection without modification of the test itself.Sample preconcentration has been pursued by many research groups,13–26 but currently there is no universal method being used in the market without drawbacks in time consumption, cost, or the required use of bulky lab equipment. For example, a paper-based method has been demonstrated to preconcentrate influenza ribonucleic acid to increase the accuracy of Influenza A detection.27 While the device was low-cost and increased the concentration of the viral load by 10×, the device required 45 minutes to operate, making it impractical for many instances of clinical use where a rapid answer is required. Another example demonstration sought to preconcentrate the bacteria in an aqueous sample for PCR using magnetic ionic liquids and an external magnetic field.28 The process demonstrated impressive preconcentration quantities of nearly 50× in under 10 minutes; however, this method required the use of several separate steps and peripheral equipment, rendering it impractical for many use cases of rapid diagnostics.
In response, our research group has been investigating several methods of sample preconcentration in recent years which use a membrane filter to concentrate analyte as the bulk fluid in the sample is removed. The basics of the process are quite simple. An initial volume of fluid is decreased by moving most of the fluid through a membrane filter, which has pores small enough to retain the biomolecule of interest in the smaller volume of fluid, thereby increasing the potency of the fluid sample. This process can be used in devices which are quite small, or extremely large. For example, microchips with embedded membrane filtration modules have been used to concentrate many biomolecules, such as proteins, viruses, and bacteria;13,14,21,29 on the other hand, water treatment facilities often use huge sheets of membrane to filter salt water for drinking purposes.30,31 The methods used to drive fluid through the membrane can vary quite a bit in functionality and complexity. For example, some methods include osmotic pressure,29 electrokinetics,20,21 and pneumatic pressure.32
In our work, methods of fluid removal included osmosis,29 vacuum,32 wicking, and pneumatic pressure.32 Our goal was to find a method which is rapid, reliable, and cost effective to create a device which could easily be integrated into rapid diagnostic tests or continuous diagnostics which require rapid preconcentration to enable ‘real time’ data. Based on our cumulative findings, in this article we will discuss the major challenges facing membrane-based concentration and important elements that must be considered for such a device to be successful. We will focus on the two preconcentration methods that we found to be most successful in detail, high-pressure pneumatic and osmotic driven preconcentration. We will further provide speculation on the types of analytes/diagnostic tests for which these membrane-based preconcentration approaches have the most potential for improving clinical outcomes in rapid diagnostics.
Considerations/issues with membrane-based concentration
We will first review several aspects of membrane-based preconcentration that must be considered regardless of application. Membrane-based preconcentration, in practice, requires very high pressures (10![[thin space (1/6-em)]](https://www.rsc.org/images/entities/char_2009.gif) 000's to 100000's of Pascals). The need for high pressures to generate high flow rates for removal of water from the sample then creates additional challenges that compromise the ability to maintain that high pressure, leading to loss of analyte at or near the membrane surface.
000's to 100000's of Pascals). The need for high pressures to generate high flow rates for removal of water from the sample then creates additional challenges that compromise the ability to maintain that high pressure, leading to loss of analyte at or near the membrane surface.
Practical devices require very large pressures
The first and foremost item to consider with any membrane preconcentration module for diagnostics is flux, or the amount of fluid which moves through a unit area of the membrane over a unit time (for example: mL cm−2 min−1).33 A preconcentration module is impractical and unlikely to be used if it takes too long to complete its run-time for use with a rapid diagnostic test. Generally, if the preconcentration takes too long (10's of minutes to hours) then in many applications it is simpler to just use a conventional benchtop diagnostic technique with higher sensitivity and lower limit of detection (e.g., enzyme-linked immunoassay, or ELISA). Therefore, preconcentration methods which can be completed in several minutes are the most desirable in real applications.Overall, there were four membrane-based preconcentration methods which were considered over the course of our research group's work (Table 1):1 wicking of fluid through the membrane using a fibrous material such as paper or a cotton ball,2 pulling fluid through the membrane using a vacuum,3 moving fluid through the membrane using osmotic pressure, and4 driving fluid through the membrane using pneumatic pressure. Table 1 demonstrates the main characteristics of each of these four methods of membrane-based preconcentration.
| Pneumatic pressure | Osmotic pressure | Wicking pressure | Vacuum pressure | |
|---|---|---|---|---|
| Pressure gradient / flux | >5.7 MPa | >23 MPa | Challenging | 101.3 kPa |
| Time to complete preconcentration | Minutes | Minutes | Hours | Hours – days |
| Complexity | Low | Low | Low | Medium |
In our own early work, we initially explored what we expected to be the simplest and yet still effective approaches: wicking pressure and vacuum pressure. Although wicking using materials with small capillary features can result in extremely high pressure gradients (Young–Laplace pressure) and high initial water fluxes, having small capillary features also creates a significant hydraulic resistance to fluid flow. Simply, hydraulic resistance quickly starts to dominate and diminish any advantages brought by the high capillary wicking pressure. Furthermore, many wicking materials such as paper have a rough surface and will have limited contact area with the membrane, further reducing the water flux regardless of wicking pressure. Vacuum pressure is more complex than wicking pressure (requires a pump or vacuum chamber), but it does not suffer from the resistance to fluid flow that exists for wicking pressure. However, vacuum pressure is limited to atmospheric pressure (101.3 kPa) which when coupled with the hydraulic resistance of membranes results in preconcentration times that require hours to days.
In our pursuit of membrane preconcentration for rapid and continuous diagnostics, we eventually concluded that much higher pressures, up to hundreds of thousands of Pascals, would be required. This led to a focus on the only two methods we believe to be feasible to maintain such high pressures during preconcentration: pneumatic pressure and osmotic pressure. Each of these methods is now presented with a brief description of operation and challenges for each. For rapid diagnostics (Fig. 1a), pneumatic preconcentration with looser membrane molecular weight cut-offs (MWCO's) (kDa's or greater) was found to be preferred because it is the only combination of pressure and membrane which can quickly preconcentrate large (mL's) initial sample volumes into a preconcentrated sample of 10's to 100's of μL remaining for the diagnostic assay. For continuous diagnostics, biosensors are required and existing continuous biosensors (enzymatic34–37 and aptamer38–40) are limited mainly to small molecule analytes. If the analyte is a small molecule, the membrane must be much tighter (small MWCO) which increases the hydraulic resistance of the membrane, which in turn requires even higher pressures that are most easily generated by osmotic pressure.
 | ||
| Fig. 1 Schematics of two viable membrane-based preconcentration methods: a) pneumatic-driven preconcentration for rapid diagnostics – compressed gas is used to pressurize the device and force the bulk of the sample fluid through an ultrafiltration membrane, concentrating the analyte in the sample. The sample is then transferred to a rapid diagnostic test device; (b) osmotic preconcentration – an osmotic draw solution with a higher osmolality (salt concentration) than the sample solution is used to draw fluid through a forward osmosis membrane, concentrating the analyte as it flows through the channel. An example application for osmotic preconcentration is continuous sweat biosensing where most analytes of interest are highly diluted in the sweat.27 | ||
Basics of membrane preconcentration with high pneumatic and osmotic pressures
Challenges with caking (reversible fouling) and pore blocking (irreversible fouling)
Fouling, or deposition of molecules into the pores or onto the surface of the membrane, is one of the biggest barriers to success in any membrane filtering process.42 The two primary types of fouling are pore blocking, also referred to as ‘irreversible fouling’, and caking, also referred to as ‘reversible fouling’. Pore blocking, seen in Fig. 2a, occurs when analyte particles are lodged into the pores of the membrane such that it partially or completely blocks fluid flow through that pore. When this occurs, it is extremely difficult to remove the particles. If a large amount of pore blocking occurs, fluid will struggle to move through the membrane and additional particles will begin to build up on the membrane surface in a process called caking. Caking, seen in Fig. 2b, can also occur independently of pore blocking and can be reversed using methods such as membrane cleaning or swiping.43–46 The positive effects of membrane swiping are demonstrated later in this article (see ‘Example success for pneumatic preconcentration’). Some caking can even be prevented by pre-filtering the sample fluid with a larger-pore membrane to remove the largest unwanted proteins and particles. However, since some amount of fouling from concentration polarization, pore blocking, or caking is inevitable, models have been created by various groups to better quantify the flux decrease which will occur due to fouling in particular environments and conditions.47–49 | ||
| Fig. 2 Illustrations of prominent issues facing membrane-based concentration processes: a) pore blocking occurs when analyte becomes lodged onto the surface of pores or into membrane pores, decreasing flux over time; b) caking occurs to some extent in all types of membrane-based filtration processes and is increased after pore blocking has occurred, but can be reversed by membrane cleaning; c) analyte size must be considered in choosing which membrane-based preconcentration process to use, as this affects the amount of analyte which will be present near the membrane surface, ultimately affecting fouling and flux; d) concentration polarization, common in osmotic preconcentration, causes analyte to build up at the membrane surface, decreasing the net flux which occurs. | ||
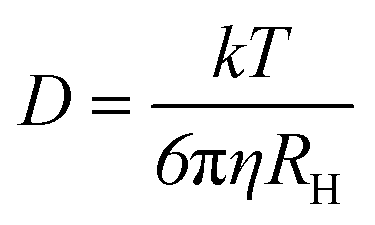
Over time, all membrane filtration processes will result in fouling due to pore blocking and/or caking, and care must be taken to decrease these effects as much as possible. There are some simple, feasible fouling improvement strategies that can be used. For example, if attempting to concentrate a larger analyte, a membrane with larger pores can be chosen such that smaller solutes, such as ions or small molecules, can easily pass through the pores of the membrane, reducing pore blocking. Additionally, if attempting to concentrate smaller analytes, one can mix the fluid during preconcentration using mechanical means such as vibration to prevent analyte from accumulating at the membrane surface and causing caking. Caking also has a strong dependence on the size or molecular weight of the particles which will be present in the sample solution. Small particles are more likely to get trapped in membrane pores and cause irreversible pore blocking. Larger particles are less likely to block membrane pores but have a higher affinity to cake onto the membrane and block fluid flow.50 Therefore, the size of particles in the sample fluid plays a substantial role in the amount of analyte which is near or caked onto the membrane surface. As seen in Fig. 2c, bulkier particles have a larger cross-sectional area and therefore the applied pressure results in a larger applied force in the direction of fluid flow. In addition, larger particles have smaller diffusion coefficients, and therefore less diffusion away from the membrane surface, resulting in a concentration build up at the membrane surface. Smaller particles, on the other hand, have less cross-sectional area, less applied force towards the membrane, and larger diffusion coefficients. This results in more diffusion away from the membrane, making them much less susceptible to caking. As a rough estimate, assuming a spherical shape for a solute, the applied force due to the pressure applied is simply proportional to the square of the radius of the particle. Diffusion is directly associated with molecular weight, as shown in the Stokes–Einstein relation:51
 | (1) |
Challenges for continuous osmotic preconcentration: concentration polarization
In addition to pore blocking and caking, osmotic preconcentration can be further limited by reduced water flux through the membrane due to concentration polarization (Fig. 2d).31,41,50 Generally, the flux through a membrane can be estimated using the following equation:| Jw = A(ΔΠ − ΔP) | (2) |
Without considering concentration polarization, the osmotic pressure difference across the membrane can be estimated by:
| ΠTotal = ΠDraw − ΠFeed = iRT(MDraw − MFeed) | (3) |
| ΠTotal = iRT(MDrawe−JwK − MFeedeJwk) | (4) |
 | (5) |
As water flows through the membrane into the draw solution reservoir, a build-up of solutes in the sample fluid accumulates near the surface of the membrane (Fig. 2d). This larger concentration of solutes is called the boundary layer. The larger concentration of solutes in the boundary layer can approach the concentration of solutes in the draw solution, which decreases the osmotic pressure difference across the membrane, significantly decreasing flux and increasing the time needed for preconcentration. The negative effects of concentration polarization cannot be completely avoided but can be diminished by mixing the fluid during concentration or increasing the turbidity of the flow to disperse solutes that are concentrating near the membrane surface.
Concentration polarization is generally not an issue in pneumatic pressure preconcentration because, as stated previously, a membrane with a larger MWCO is utilized, allowing the smaller molecular weight solutes that dominate total osmolality to simply pass through the membrane (the osmotic pressure difference caused by larger particles in the solution can be considered negligible in comparison).
Example success for osmotic concentration
As previously stated, investigation of analyte preconcentration using a high osmolality draw solution has been investigated in our laboratory. As the results of this study (all of the work in this section) have already been published, the full details of the study have been omitted and can be found in the original publication.29 However, the main testing procedure and results are summarized here in order to allow for a thoughtful discussion on the method's potential in diagnostics.Membrane and analyte selection
Glucose (∼180 Da) was chosen as an analyte for osmotic preconcentration testing, as it is a small sugar which is simple to measure and which has high biological relevance. A review of commonly used membrane types was conducted, and a plot was made overlaying various membranes' MWCOs with certain analytes to demonstrate membrane/analyte size compatibility (Fig. 3a).29 Considering glucose's small size, the forward osmosis Rainstick (FTS H20) membrane was selected for testing in this study because the membrane blocks even the passage of common salts (NaCl, KCl, etc.). Bovine serum albumin (BSA) was also used as an analyte in later testing because it is a sticky protein (∼66.5 kDa) which could be used to test osmotic preconcentration's limits with larger analytes that may be more prone to fouling the membrane. | ||
| Fig. 3 Continuous osmotic preconcentration device and results: a) various membrane types and their MWCOs are plotted with various analytes and their molecular weights to show compatible membrane/analyte combinations; b) completed device fabricated using cut-design-assemble approach with compact serpentine microchannel; c) concentration of glucose achieved using various input flowrates overlaid with theoretical model prediction (four different colors represent different test runs); d) concentration of BSA achieved using various input flowrates overlaid with theoretical model prediction (two different colors represent different test runs).28 | ||
Testing procedures
A representative osmotic preconcentration device prototype is shown in Fig. 3b. Because the forward osmosis membrane is very tight, even with very high osmotic pressures of >23 MPa, the water flux through the membrane is low. Therefore, a long 10 cm channel was experimentally required to allow for complete preconcentration of the sample fluid. The osmotic preconcentration devices were fabricated using a rapid method, the design-cut-assemble approach, in which the device is assembled using layer by layer lamination. Complete fabrication details can be found in the original article.29Glucose was preconcentrated by using 1× PBS (phosphate buffered saline) as the draw solution, and 0.1× PBS in the sample solution (10× osmolality difference). In this manner, the sample solution, containing a glucose concentration of 100 μM, would ideally be concentrated 10× to 1 mM. In a similar manner, a 10× PBS draw solution was used to attempt to concentrate a sample solution of BSA with a starting concentration of 0.39 mg mL−1 and 1× PBS to a final concentration of 3.9 mg mL−1, a 10× increase. A syringe and the device channel were filled with the sample solution being tested using techniques which avoided the formation of air bubbles (details can be found in original publication29) and the syringe was connected to the tubing at the inlet of the device. Then, a syringe pump was used to infuse the sample solution into the device at various flow rates. Samples of the concentrated solution were taken at the outlet of the device for later concentration quantification. In a fully integrated, commercial device, the sensors for the diagnostic assay could be placed in the channel itself for continuous monitoring.
Results
For laboratory testing, to determine the amount of glucose preconcentration at each flow rate, electrochemical glucose test strips were used due to their extremely low volume requirement of 1 μL. BSA concentrations were tested using a UV-vis spectrophotometer (NanoDrop One), which also required only 1 μL of solution. The results of these tests for glucose and BSA can be seen in Fig. 3c and d, respectively. These results are plotted over the predicted concentration curve using a theoretical model, the details of which can be found in the original publication.29 The decreasing slope of the predicted curves is due to the fact that lower flow rates are required to achieve full osmotic equilibration and therefore maximum concentration before fluid exits the channel. The preconcentration results for glucose matched the theoretical predictions extremely closely. The BSA concentration results also followed the same overall curve as the predictive model but did not fit the theoretical curve as well as glucose did. This is potentially because BSA is sticky and likely adhered to the channel walls and the membrane. The lack of adherence of the BSA curve to the theoretical curve may also be the result of increased fouling and caking onto the membrane due to the larger size of BSA, as was discussed in the previous section of this article (Fig. 2c).Example success for pneumatic preconcentration
Next, the pneumatic preconcentration technique, which involved applying large amounts of positive pressure using compressed gas, was used. It should be noted that all of the work summarized in this section of the article is original work which has not been published.Test setup
For testing the pneumatic preconcentration technique, a setup was created which used a carbon dioxide tank as the pressure source. Carbon dioxide was chosen for testing in this study because it is one of the most ubiquitous gases used as a pressure source on the market, and because carbon dioxide can be stored as a liquid while providing a large 5.7 MPa vapor pressure at room temperature. The carbon dioxide tank was coupled to a regulator and release valve, which was then routed to the concentration setup shown in Fig. 4a.1–2 The concentration setup itself consisted of a commercial flange as well as a custom designed steel holder for the preconcentration membrane. The flange and steel holder were bolted together along with an expanded polytetrafluoroethylene (EPTFE) gasket. The membrane itself was cut to an appropriate size using a laser cutter and placed into the bottom of the custom steel holder. In addition, a steel mesh (120 mesh, 304 stainless steel) was placed underneath the membrane to preserve the membrane integrity while pressure was being applied. A thin layer of putty (Dicor Butyl Tape, Part No. BT-1834-1) was used to occlude a small portion on one side of the membrane to stop the concentration process when the fluid volume dipped below a certain amount (the putty simply blocks further water flux). Without the putty, one would have to precisely time when the experiment would be stopped else all the water in the sample fluid would be removed. With the putty the device can be easily designed to have an ‘auto-stop’ such that a predictable final preconcentrated sample volume is achieved each time. The entire steel holder/flange piece was tilted to an angle of 45 degrees to position the device with respect to gravity such that the putty would catch the final concentrated volume of sample fluid. A beaker was placed below the steel holder to catch the waste fluid, and a scale was placed underneath the beaker in order to weigh the amount of waste fluid leaving the device. The weight measurement of the waste fluid then allowed the fluid flux to be monitored throughout the preconcentration process. | ||
| Fig. 4 Pneumatic pressure preconcentration device and results: a1) photo of the completed setup; a2) schematic of components inside steel holder; b) membrane flux characterization for membranes with various pore sizes (adapted from Drexelius 2020); c) concentration results for pneumatic pressure setup using PBS and urine; d) flux of PBS through a membrane which is 10 cm2 and using 5.7 MPa (red box shows time needed to concentrate 10 mL of PBS); e) flux of urine through a membrane which is 10 cm2 and using 5.7 MPa (red box shows time needed to concentrate 10 mL of urine). | ||
Testing procedures
For initial pneumatic pressure preconcentration testing, 1× PBS (phosphate buffered saline) was chosen as the sample fluid type to emulate the extraction buffer fluid used in many nasopharyngeal swab rapid diagnostic tests. Influenza A nucleoprotein was chosen as the target analyte, as influenza is historically one of the most prevalent and deadly viruses. Many rapid influenza tests use a nasopharyngeal swab and extraction buffer to release the nucleoprotein, and therefore test sensitivities could be improved with preconcentration. Multiple membranes were tested in the lab to determine their flux (see original publication for membrane characterization procedure detail32), and plotted as seen in Fig. 4b. The membrane chosen for use in this study was a 5 kDa polyethersulfone (PES) membrane, as it could easily reject all of the nucleoprotein (∼56 kDa) and still maintain a high flux.For each test, PBS was spiked with influenza A nucleoprotein to a concentration of 16 ng mL−1. 10 mL of the fluid was deposited into the custom steel holder before the holder was bolted onto the commercial flange. A transparent blast shield was placed around the setup for safety with this research-only device, the carbon dioxide tank was opened, and the system became rapidly pressurized to 5.7 MPa. The weight of fluid which had passed through the membrane and fallen into the waste beaker was recorded every 10 seconds, and later converted to a flux value and normalized to the amount of pressure, in mL min−1 cm−2 per Pascal.
Recordings continued every 10 seconds in this manner until flux had completely stopped as the final sample volume settled over the putty-covered membrane. At this point, the carbon dioxide tank was shut, and the release valve opened to depressurize the setup. The final volume of the concentrated sample was measured (in the range of 50–200 μL's). Using this volume, the maximum theoretical concentration amount was calculated. (e.g. 10 mL initial volume/100 μL final volume = 100×).
After these tests were complete, because of analyte loss due to caking, an additional step was introduced at the end of the concentration process to try to improve analyte recovery. After the system was depressurized, a cotton swab was used to wipe the membrane to mechanically disturb analyte which had been caked onto the surface. The cotton swab was then placed into a microcentrifuge tube with the concentrated fluid sample and centrifuged to release the recovered analyte back into the fluid. In real-world application, a more automated method will likely be required, such as piezoelectric vibration of the membrane during preconcentration to continuously prevent caking. The results are reported in the next section.
A second set of tests was also conducted using urine to determine the potential of the pneumatic pressure preconcentration with real biofluid samples. Human chorionic gonadotropin (HCG), or pregnancy hormone, was used as the target analyte for these tests, as it is one of the most commonly used rapid tests available for urine. Urine samples (purchased from Innovative Research, Inc.) were spiked with HCG to a concentration of 20 mIU mL−1. Similarly to the PBS–influenza tests, 10 mL of spiked fluid was placed into the concentration setup, and the test procedure was repeated as before. Recordings of waste fluid weight were taken every five minutes rather than every 10 seconds (due to the lower flux of urine and its numerous fouling solutes, Fig. 2). Again, since a much lower analyte recovery was expected using a biofluid which has more solutes to cause caking on the membrane, all of the membranes were swabbed with a cotton swab after testing to recover as much analyte as possible. The cotton swabs were then spun in a centrifuge with the final fluid sample as before to release the analyte from the swab back into the sample.
Concentration results for the influenza/PBS and HCG/urine tests were determined using ELISA kits. Using these results, the concentration amounts for each test were determined. From these values, the “% of theoretical concentration achieved” was calculated by dividing the actual concentration values by the maximum theoretical concentration values for each test. For example, if the actual concentration as measured by ELISA for a test was 100×, and the maximum theoretical concentration was 200×, then the ‘% of theoretical concentration achieved’ would be 100×/200× = 50%.
Flux values recorded at each timepoint were normalized into values of mL min−1 cm−2 Pa−1, by dividing the flux values by the exposed surface area of the membrane (2.29 cm2) and the amount of pressure applied (5.7 MPa). The average value of the fluxes which were observed at each time point were calculated, and then used to determine how much fluid would be able to travel through a membrane of practical size (10 cm2) over time at 5.7 MPa.
Results
The concentration test results can be seen in Fig. 4c. The concentration results show that swabbing the membrane and releasing analyte trapped on the surface greatly increases (∼2×, from 34% to 76%) the amount of preconcentration which is achievable. Simply, the cotton swab recovers analyte lost due to caking. The ‘percent of maximum theoretical concentration achieved’ with the biofluid, urine, is also very high at 59%, but is lower than PBS samples which had been swabbed. This is likely because there are many more interferents and other small molecules present in urine which foul the membrane and bind to the analyte, making releasing the analyte back into the sample fluid more difficult. Impressive preconcentration amounts up to 165× were achieved, even using urine (all preconcentration data can be found in the ESI†).The flux results can be seen in Fig. 4d and e for PBS and urine, respectively. When using PBS, one can concentrate 10 mL of fluid in only 52 seconds if using a membrane which is 10 cm2 and a carbon dioxide pressure source. If using urine, one can concentrate the same amount of fluid in 8.3 minutes, which is much slower but still adequate for a rapid diagnostic test. When comparing the flux data of PBS and urine, the effect of fouling on membrane preconcentration can be seen. While the flux curve for PBS is rather straight and shows only a slight decrease in fluid flow over time, the flux curve for urine shows a large decrease in fluid flow over time, as represented by the flattening of the curve. However, a large volume of urine would still be able to be concentrated before the flux decreases significantly, implying that real biofluids remain a viable option for pneumatic preconcentration. It should be mentioned that fluxes have the potential to be even higher if using an alternative source of gas with a higher vapor pressure, such as oxygen or nitrogen. These gases can be purchased for use in mini cartridges, which have filling pressures up to 3000 psi, potentially increasing the flux >3×. The preconcentration time can also be reduced by using a larger membrane area, something not performed here because it likely requires optimization for each application due to analyte-specific caking.
Summary of utility and challenges for membrane-based preconcentration
Based on preliminary results, both osmotic pressure and pneumatic pressure methods of preconcentration have potential applied value. However, each method has its own caveats and is more strongly suited to work under certain conditions, a summary of which can be seen in Table 2. Pneumatic pressure preconcentration is more suited for rapid diagnostic applications such as point-of-care tests, whereas osmotic preconcentration is more suited to in-line, continuous monitoring of analytes.| Pneumatic pressure | Osmotic pressure | |
|---|---|---|
| General | • Point-of-care tests | • Continuous/in-line monitoring |
| • Larger molecules | • Small molecules | |
| • Viral and disease detection in urine/buffer, toxins in water | • Continuous detection of dilute analytes in biofluids such as sweat and toxin detection in water and food processing | |
| • Point-of-care tests | • Continuous/in-line monitoring | |
| Positive aspects | • Easier to re-use device casing | • Larger potential pressure gradient |
| • More portable | • Continuous | |
| Negative aspects | • Caking may require mechanical agitation | • Concentration polarization |
| • Adds an extra step for user to point-of-care tests | • Pore blocking | |
| • Generally more complex (requires sample dispenser, etc.) |
As stated in a previous section, for rapid diagnostics, pneumatic preconcentration with looser membrane MWCO's (kDa or greater) provides a combination of pressure and membrane which can quickly preconcentrate large (mL's) initial sample volumes into a preconcentrated sample of 10's to 100's of μL for the diagnostic assay. Continuous diagnostics are mainly limited mainly to small molecule analytes,55 where the membrane must be much tighter (small MWCO) which increases the hydraulic resistance of the membrane, requiring even higher pressures that are most easily generated by osmotic pressure. Furthermore, the osmotic preconcentration is better suited to a continuous operating format because it would be highly complex to continuously introduce sample into a high-pressure chamber.
Although preconcentration has tremendous potential for use in clinical diagnostics, there are some additional application-specific challenges. Firstly, there are some biofluids such as saliva or blood which may be too viscous to be successfully filtered. In cases such as this, it is not impossible to work with the fluid, but fluid pretreatment may be necessary before preconcentration occurs, adding an extra step to the process for the clinician or home user. For example, for saliva there are devices available which use a fiberglass-like substance to filter the mucins and other large viscosity-increasing solutes out of the saliva.56 However, this pretreated fluid would still be much more viscous than buffer and would still preconcentrate slowly (10's of minutes or more). Multiple studies have found that saliva may be a viable fluid for the diagnoses of respiratory viruses as well as other conditions.57–63 One potential solution to using more viscous/analyte-heavy fluids such as saliva, plasma, or whole blood may be using conical pored membranes. These membranes are created by etching the cylindrical pores found on track-etched membranes even further by using methods such as chemical etching or plasma etching.64–66 The shape of the conical pore, including the cone base diameter and cone angle, can be controlled by continuously etching one side of the membrane until the desired shape is achieved.65 Studies have found that membranes with these pores have a significantly decreased resistance, and therefore a higher rate of fluid transport.64,67 This means that preconcentration could theoretically be achieved using less applied pressure,67 increasing the number of potential applications for this preconcentration technology.
Another potential factor to consider when preconcentrating fluid samples, particularly biofluids, is how the sample will be affected by the preconcentration process itself. For example, concentrating urine with a tight membrane such as a forward osmosis membrane can alter pH and salinity which can then interfere with the measurement sensor or assay. Each of these types of changes may affect the functionality of the assay, as the assays are often developed to perform most accurately at very specific conditions which are similar to the natural form of the biofluid. It may be possible to add a post-treatment step to the preconcentrated sample, such as adding powdered buffer to restore the original pH of the solution. However, it is extremely costly for companies to alter any process for tests because they must obtain FDA approval for the new process as well as all test components. The FDA must also determine that the new version of the test performs equal to, or better than before. Therefore, diagnostic companies will ideally require significant performance gains and a simple route forward for FDA.
Conclusions
In conclusion, when considering the work of others15,17,19–21,27,28 and our groups work,29,32 membrane preconcentration remains attractive due to its simplicity compared other preconcentration techniques.13,14,16,18 However, the applied value of membrane-based preconcentration is limited by the alternative of being able to use a more sensitive laboratory or clinic-based test. Therefore we speculate that membrane-based preconcentration's primary value is limited to applications where portability and detection speed are important. Even within that applications' space, numerous challenges such as interferents, membrane caking, and other practical issues will further limit the utility of this approach. Although it seems a potentially ubiquitous solution for creating higher sensitivity diagnostic tests in theory, membrane preconcentration will require further development before achieving greater practical use in rapid and continuous diagnostic applications. That said, in this work, we conclude that pneumatic and osmotic driven preconcentration have the most promise, with clear demonstrations of their utility including use with real biofluids.Conflicts of interest
There are no conflicts to declare.Acknowledgements
The University of Cincinnati would like to acknowledge support from the Air Force Research Labs (USAF Contract No. FA8650-16-C-6760 and No. FA9550-20-1-0117) and the Ohio Federal Research Network (No. PO FY16-049 and WSARC-1077-700). The 711th Human Performance Wing authors acknowledge the Air Force Research Laboratory for funding. The authors would also like to acknowledge support from NDSEG (the National Defense Science and Engineering Graduate Fellowship Program). The authors also acknowledge Dr. Andrew Jajack for the work in his publication which is heavily referenced in this article.References
- G. J. Williams, P. Macaskill, S. F. Chan, R. M. Turner, E. Hodson and J. C. Craig, Absolute and relative accuracy of rapid urine tests for urinary tract infection in children: a meta-analysis, Lancet Infect. Dis., 2010, 10(4), 240–250 CrossRef PubMed.
- E. Stefaniuk, K. Bosacka, M. Wanke-Rytt and W. Hryniewicz, The use of rapid test QuikRead go® Strep A in bacterial pharyngotonsillitis diagnosing and therapeutic decisions, Eur. J. Clin. Microbiol. Infect. Dis., 2017, 36(10), 1733–1738 CrossRef CAS PubMed.
- The Canadian Agency for Drugs and Technologies in Health (CADTH), Systematic Review of Use of Blood Glucose Test Strips for the Management of Diabetes Mellitus, CADTH Technol Overv., 2010, vol. 1, no. 2, p. e0101 Search PubMed.
- T. Mahmoudi, M. de la Guardia and B. Baradaran, Lateral flow assays towards point-of-care cancer detection: A review of current progress and future trends, TrAC, Trends Anal. Chem., 2020, 125, 115842 CrossRef CAS.
- A. Scohy, A. Anantharajah, M. Bodéus, B. Kabamba-Mukadi, A. Verroken and H. Rodriguez-Villalobos, Low performance of rapid antigen detection test as frontline testing for COVID-19 diagnosis, J. Clin. Virol., 2020, 129, 104455 CrossRef CAS PubMed.
- A. H. L. Bruning, M. M. G. Leeflang, J. M. B. W. Vos, R. Spijker, M. D. de Jong and K. C. Wolthers, et al., Rapid Tests for Influenza, Respiratory Syncytial Virus, and Other Respiratory Viruses: A Systematic Review and Meta-analysis, Clin. Infect. Dis., 2017, 65(6), 1026–1032 CrossRef PubMed.
- T. M. Uyeki, R. Prasad, C. Vukotich, S. Stebbins, C. R. Rinaldo and Y. Ferng, et al., Low Sensitivity of Rapid Diagnostic Test for Influenza, Clin. Infect. Dis., 2009, 48(9), e89–e92 CrossRef PubMed.
- J. Merckx, R. Wali, I. Schiller, C. Caya, G. C. Gore and C. Chartrand, et al., Diagnostic Accuracy of Novel and Traditional Rapid Tests for Influenza Infection Compared With Reverse Transcriptase Polymerase Chain Reaction, Ann. Intern. Med., 2017, 167(6), 394–409 CrossRef PubMed.
- V. Gubala, L. F. Harris, A. J. Ricco, M. X. Tan and D. E. Williams, Point of Care Diagnostics: Status and Future, Anal. Chem., 2012, 84(2), 487–515 CrossRef CAS PubMed.
- L. Bissonnette and M. G. Bergeron, Diagnosing infections—current and anticipated technologies for point-of-care diagnostics and home-based testing, Clin. Microbiol. Infect., 2010, 16(8), 1044–1053 CrossRef CAS PubMed.
- M. Sajid, A.-N. Kawde and M. Daud, Designs, formats and applications of lateral flow assay: A literature review, J. Saudi Chem. Soc., 2015, 19(6), 689–705 CrossRef.
- O. Moldovan, B. Iñiguez, M. J. Deen and L. F. Marsal, Graphene electronic sensors– review of recent developments and future challenges, IET Circuits, Devices & Systems, 2015, 9(6), 446–453 Search PubMed.
- B. C. Giordano, D. S. Burgi, S. J. Hart and A. Terray, On-line sample pre-concentration in microfluidic devices: A review, Anal. Chim. Acta, 2012, 718, 11–24 CrossRef CAS PubMed.
- C.-C. Lin, J.-L. Hsu and G.-B. Lee, Sample preconcentration in microfluidic devices, Microfluid. Nanofluid., 2011, 10(3), 481–511 CrossRef.
- H. Chun, T. D. Chung and J. M. Ramsey, High Yield Sample Preconcentration Using a Highly Ion-Conductive Charge-Selective Polymer, Anal. Chem., 2010, 82(14), 6287–6292 CrossRef CAS PubMed.
- L.-M. Fu, H.-H. Hou, P.-H. Chiu and R.-J. Yang, Sample preconcentration from dilute solutions on micro/nanofluidic platforms: A review, Electrophoresis, 2018, 39(2), 289–310 CrossRef CAS PubMed.
- T. Kawai, N. Ota, K. Okada, A. Imasato, Y. Owa and M. Morita, et al., Ultrasensitive Single Cell Metabolomics by Capillary Electrophoresis–Mass Spectrometry with a Thin-Walled Tapered Emitter and Large-Volume Dual Sample Preconcentration, Anal. Chem., 2019, 91(16), 10564–10572 CrossRef CAS PubMed.
- S.-J. Liang, J.-K. Mao, C. Gong, D.-D. Yu and J.-G. Zhou, Research and Application Progress of Paper-based Microfluidic Sample Preconcentration, Chin. J. Anal. Chem., 2019, 47(12), 1878–1886 CAS.
- B. Soledad-Rodríguez, P. Fernández-Hernando, R. M. Garcinuño-Martínez and J. S. Durand-Alegría, Effective determination of ampicillin in cow milk using a molecularly imprinted polymer as sorbent for sample preconcentration, Food Chem., 2017, 224, 432–438 CrossRef PubMed.
- Y.-C. Wang, A. L. Stevens and J. Han, Million-fold Preconcentration of Proteins and Peptides by Nanofluidic Filter, Anal. Chem., 2005, 77(14), 4293–4299 CrossRef CAS PubMed.
- N. Yanagisawa and D. Dutta, Enhancement in the Sensitivity of Microfluidic Enzyme-Linked Immunosorbent Assays through Analyte Preconcentration, Anal. Chem., 2012, 84(16), 7029–7036 CrossRef CAS PubMed.
- L.-H. Hung, H.-L. Wang and R.-J. Yang, A portable sample concentrator on paper-based microfluidic devices, Microfluid. Nanofluid., 2016, 20(5), 80 CrossRef.
- R.-J. Yang, H.-H. Pu and H.-L. Wang, Ion concentration polarization on paper-based microfluidic devices and its application to preconcentrate dilute sample solutions, Biomicrofluidics, 2015, 9(1), 014122 CrossRef PubMed.
- S.-H. Yeh, K.-H. Chou and R.-J. Yang, Sample pre-concentration with high enrichment factors at a fixed location in paper-based microfluidic devices, Lab Chip, 2016, 16(5), 925–931 RSC.
- G. S. Shyam Sunder, A. Rohanifar, N. Alipourasiabi, J. G. Lawrence and J. R. Kirchhoff, Synthesis and Characterization of Poly(pyrrole-1-carboxylic acid) for Preconcentration and Determination of Rare Earth Elements and Heavy Metals in Water Matrices, ACS Appl. Mater. Interfaces, 2021, 13(29), 34782–34792 CrossRef CAS PubMed.
- Y. Bu, X. Zhang, A. Zhu, L. Li, X. Xie and S. Wang, Inside-Out-Oriented Cell Membrane Biomimetic Magnetic Nanoparticles for High-Performance Drug Lead Discovery, Anal. Chem., 2021, 93(22), 7898–7907 CrossRef CAS PubMed.
- N. M. Rodriguez, J. C. Linnes, A. Fan, C. K. Ellenson, N. R. Pollock and C. M. Klapperich, Paper-Based RNA Extraction, in Situ Isothermal Amplification, and Lateral Flow Detection for Low-Cost, Rapid Diagnosis of Influenza A(H1N1) from Clinical Specimens, Anal. Chem., 2015, 87(15), 7872–7879 CrossRef CAS PubMed.
- K. D. Clark, J. A. Purslow, S. A. Pierson, O. Nacham and J. L. Anderson, Rapid preconcentration of viable bacteria using magnetic ionic liquids for PCR amplification and culture-based diagnostics, Anal. Bioanal. Chem., 2017, 409(21), 4983–4991 CrossRef CAS PubMed.
- A. Jajack, I. Stamper, E. Gomez, M. Brothers, G. Begtrup and J. Heikenfeld, Continuous, quantifiable, and simple osmotic preconcentration and sensing within microfluidic devices, PLoS One, 2019, 14(1), e0210286 CrossRef CAS PubMed.
- G. Kang and Y. Cao, Development of antifouling reverse osmosis membranes for water treatment: A review, Water Res., 2012, 46(3), 584–600 CrossRef CAS PubMed.
- L. Malaeb and G. M. Ayoub, Reverse osmosis technology for water treatment: State of the art review, Desalination, 2011, 267(1), 1–8 CrossRef CAS.
- A. Drexelius, A. Hoellrich, A. Jajack, E. Gomez, M. Brothers and S. Hussain, et al., Analysis of pressure-driven membrane preconcentration for point-of-care assays, Biomicrofluidics, 2020, 14(5), 054101 CrossRef CAS PubMed.
- J. Wagner, Membrane filtration handbook, Practical Tips and Hints, Osmonics, 2001 Search PubMed.
- W. Jia, A. J. Bandodkar, G. Valdés-Ramírez, J. R. Windmiller, Z. Yang and J. Ramírez, et al., Electrochemical Tattoo Biosensors for Real-Time Noninvasive Lactate Monitoring in Human Perspiration, Anal. Chem., 2013, 85(14), 6553–6560 CrossRef CAS PubMed.
- K. Y. Goud, C. Moonla, R. K. Mishra, C. Yu, R. Narayan and I. Litvan, et al., Wearable Electrochemical Microneedle Sensor for Continuous Monitoring of Levodopa: Toward Parkinson Management, ACS Sens., 2019, 4(8), 2196–2204 CrossRef CAS PubMed.
- R. K. Mishra, K. Y. Goud, Z. Li, C. Moonla, M. A. Mohamed and F. Tehrani, et al., Continuous Opioid Monitoring along with Nerve Agents on a Wearable Microneedle Sensor Array, J. Am. Chem. Soc., 2020, 142(13), 5991–5995 CrossRef CAS PubMed.
- H. Teymourian, A. Barfidokht and J. Wang, Electrochemical glucose sensors in diabetes management: an updated review(2010–2020), Chem. Soc. Rev., 2020, 49(21), 7671–7709 RSC.
- N. Arroyo-Currás, P. Dauphin-Ducharme, G. Ortega, K. L. Ploense, T. E. Kippin and K. W. Plaxco, Subsecond-Resolved Molecular Measurements in the Living Body Using Chronoamperometrically Interrogated Aptamer-Based Sensors, ACS Sens., 2018, 3(2), 360–366 CrossRef PubMed.
- N. Arroyo-Currás, J. Somerson, P. A. Vieira, K. L. Ploense, T. E. Kippin and K. W. Plaxco, Real-time measurement of small molecules directly in awake, ambulatory animals, Proc. Natl. Acad. Sci. U. S. A., 2017, 114(4), 645–650 CrossRef PubMed.
- C. Parolo, A. Idili, G. Ortega, A. Csordas, A. Hsu and N. Arroyo-Currás, et al., Real-Time Monitoring of a Protein Biomarker, ACS Sens., 2020, 5(7), 1877–1881 CrossRef CAS PubMed.
- P. Nicoll, Forward Osmosis - A brief introduction, 2013 Search PubMed.
- W. Guo, H.-H. Ngo and J. Li, A mini-review on membrane fouling, Bioresour. Technol., 2012, 122, 27–34 CrossRef CAS PubMed.
- Z. Wang, J. Ma, C. Y. Tang, K. Kimura, Q. Wang and X. Han, Membrane cleaning in membrane bioreactors: A review, J. Membr. Sci., 2014, 468, 276–307 CrossRef CAS.
- J. M. Arnal, B. García-Fayos and M. Sancho, Membrane cleaning, Expand Issues Desalination, 2011, ch. 3, pp. 63–84 Search PubMed.
- M. Aslam, A. Charfi, G. Lesage, M. Heran and J. Kim, Membrane bioreactors for wastewater treatment: A review of mechanical cleaning by scouring agents to control membrane fouling, Chem. Eng. J., 2017, 307, 897–913 CrossRef CAS.
- J. C.-T. Lin, D.-J. Lee and C. Huang, Membrane Fouling Mitigation: Membrane Cleaning, Sep. Sci. Technol., 2010, 45(7), 858–872 CrossRef CAS.
- G. Bolton, D. LaCasse and R. Kuriyel, Combined models of membrane fouling: Development and application to microfiltration and ultrafiltration of biological fluids, J. Membr. Sci., 2006, 277(1), 75–84 CrossRef CAS.
- I. M. Griffiths, A. Kumar and P. S. Stewart, A combined network model for membrane fouling, J. Colloid Interface Sci., 2014, 432, 10–18 CrossRef CAS PubMed.
- X. Tong, Y.-H. Wu, Y.-H. Wang, Y. Bai, X.-H. Zhao and L.-W. Luo, et al., Simulating and predicting the flux change of reverse osmosis membranes over time during wastewater reclamation caused by organic fouling, Environ. Int., 2020, 140, 105744 CrossRef CAS PubMed.
- Q. She, R. Wang, A. G. Fane and C. Y. Tang, Membrane fouling in osmotically driven membrane processes: A review, J. Membr. Sci., 2016, 499, 201–233 CrossRef CAS.
- D. P. Valencia and F. J. González, Estimation of diffusion coefficients by using a linear correlation between the diffusion coefficient and molecular weight, J. Electroanal. Chem., 2012, 681, 121–126 CrossRef CAS.
- J. C. Araque, S. K. Yadav, M. Shadeck, M. Maroncelli and C. J. Margulis, How Is Diffusion of Neutral and Charged Tracers Related to the Structure and Dynamics of a Room-Temperature Ionic Liquid? Large Deviations from Stokes–Einstein Behavior Explained, J. Phys. Chem. B, 2015, 119(23), 7015–7029 CrossRef CAS PubMed.
- D. A. Turton and K. Wynne, Stokes–Einstein–Debye Failure in Molecular Orientational Diffusion: Exception or Rule?, J. Phys. Chem. B, 2014, 118(17), 4600–4604 CrossRef CAS PubMed.
- J. R. Mccutcheon and M. Elimelech, Modeling water flux in forward osmosis: Implications for improved membrane design, AIChE J., 2007, 53(7), 1736–1744 CrossRef CAS.
- J. Heikenfeld, A. Jajack, J. Rogers, P. Gutruf, L. Tian and T. Pan, et al., Wearable sensors: modalities, challenges, and prospects, Lab Chip, 2018, 18(2), 217–248 RSC.
- K. L. Helton, K. E. Nelson, E. Fu and P. Yager, Conditioning saliva for use in a microfluidic biosensor, Lab Chip, 2008, 8(11), 1847–1851 RSC.
- Y. Kim, S. G. Yun, M. Y. Kim, K. Park, C. H. Cho and S. Y. Yoon, et al., Comparison between Saliva and Nasopharyngeal Swab Specimens for Detection of Respiratory Viruses by Multiplex Reverse Transcription-PCR, J. Clin. Microbiol., 2017, 55(1), 226–233 CrossRef PubMed.
- K. K. To, L. Lu, C. C. Yip, R. W. Poon, A. M. Fung and A. Cheng, et al., Additional molecular testing of saliva specimens improves the detection of respiratory viruses, merging Microbes Infect., 2017, 6(1), 1–7 CrossRef PubMed.
- L. Bilder, E. E. Machtei, Y. Shenhar, Z. Kra-Oz and F. Basis, Salivary Detection of H1N1 Virus: A Clinical Feasibility Investigation, J. Dent. Res., 2011, 90(9), 1136–1139 CrossRef CAS PubMed.
- J. H. Jeong, K. H. Kim, S. H. Jeong, J. W. Park, S. M. Lee and Y. H. Seo, Comparison of sputum and nasopharyngeal swabs for detection of respiratory viruses, J. Med. Virol., 2014, 86(12), 2122–2127 CrossRef CAS PubMed.
- A. Sueki, K. Matsuda, A. Yamaguchi, M. Uehara, M. Sugano and T. Uehara, et al., Evaluation of saliva as diagnostic materials for influenza virus infection by PCR-based assays, Clin. Chim. Acta, 2016, 453, 71–74 CrossRef CAS PubMed.
- J. Yoon, S. G. Yun, J. Nam, S.-H. Choi and C. S. Lim, The use of saliva specimens for detection of influenza A and B viruses by rapid influenza diagnostic tests, J. Virol. Methods, 2017, 243, 15–19 CrossRef CAS PubMed.
- C.-Z. Zhang, X.-Q. Cheng, J.-Y. Li, P. Zhang, P. Yi and X. Xu, et al., Saliva in the diagnosis of diseases, Int. J. Oral Sci., 2016, 8(3), 133–137 CrossRef CAS PubMed.
- N. Li, S. Yu, C. C. Harrell and C. R. Martin, Conical Nanopore Membranes, Preparation and Transport Properties, Anal. Chem., 2004, 76(7), 2025–2030 CrossRef CAS PubMed.
- C. C. Harrell, Z. S. Siwy and C. R. Martin, Conical Nanopore Membranes: Controlling the Nanopore Shape, Small, 2006, 2(2), 194–198 CrossRef CAS PubMed.
- C. Wang, Q. Fu, X. Wang, D. Kong, Q. Sheng and Y. Wang, et al., Atomic Layer Deposition Modified Track-Etched Conical Nanochannels for Protein Sensing, Anal. Chem., 2015, 87(16), 8227–8233 CrossRef CAS PubMed.
- C. Wang, S. Senapati and H.-C. Chang, Liquid biopsy technologies based on membrane microfluidics: High-yield purification and selective quantification of biomarkers in nanocarriers, Electrophoresis, 2020, 41(21–22), 1878–1892 CrossRef CAS PubMed.
Footnote |
| † Electronic supplementary information (ESI) available: Pneumatic preconcentration device data. See DOI: 10.1039/d2sd00002d |
| This journal is © The Royal Society of Chemistry 2022 |