 Open Access Article
Zr4+ solution structures from pair distribution function analysis†
Magnus
Kløve
 a,
Rasmus Stubkjær
Christensen
 a,
Ida Gjerlevsen
Nielsen
 a,
Sanna
Sommer
a,
Mads Ry Vogel
Jørgensen
a,
Sanna
Sommer
a,
Mads Ry Vogel
Jørgensen
 ab,
Ann-Christin
Dippel
 c and
Bo Brummerstedt
Iversen
 *a
*a
aCenter for Integrated Materials Research, Department of Chemistry, Interdisciplinary Nanoscience Center (iNANO), Aarhus University, Langelandsgade 140, 8000 Aarhus C, Denmark. E-mail: bo@chem.au.dk
bMAX IV Laboratory, Lund University, Fotongatan 2, 225 94, Lund, Sweden
cDeutsches Elektronen-Synchrotron DESY, D-22607 Hamburg, Germany
First published on 15th October 2022
Abstract
The structures of metal ions in solution constitute essential information for obtaining chemical insight spanning from catalytic reaction mechanisms to formation of functional nanomaterials. Here, we explore Zr4+ solution structures using X-ray pair distribution function (PDF) analysis across pH (0–14), concentrations (0.1–1.5 M), solvents (water, methanol, ethanol, acetonitrile) and metal sources (ZrCl4, ZrOCl2·8H2O, ZrO(NO3)2·xH2O). In water, [Zr4(OH)8(OH2)16]8+-tetramers are predominant, while non-aqueous solvents contain monomeric complexes. The PDF analysis also reveals second sphere coordination of chloride counter ions to the aqueous tetramers. The results are reproducible across data measured at three different beamlines at the PETRA-III and MAX IV synchrotron light sources.
Introduction
Metal ion solution species are fundamental chemical objects since they are the initial precursors in chemical processes and their explicit nature impacts both solvent reaction chemistry and mechanisms of nanocrystal nucleation.1 The formation of nanocrystals in solvent-based reactions is widespread in natural science, but the current chemical understanding of crystallization is poor, and recent in situ studies of solution synthesis processes have revealed significant shortcomings in classical nucleation theory.2–4 Classically, crystallization should occur through assembly/disassembly of monomeric species until a nucleus of a critical size is formed, but this view neglects the presence of stable metal ion clusters prior to nucleation.5–7In situ pair distribution function (PDF) studies have shown the importance of stable solution species as structure-directing building units in solvothermal synthesis.4,8,9Here, we explore the rich solution chemistry of Zr4+ ions using PDF analysis across different pH, different metal ion concentrations, different solvents and different metal precursors (and thereby counterions) to provide a basis for understanding the multitude of chemical processes that involve these species. We establish the reliability of the PDF technique by analyzing data measured with different energies at three different beamlines at the PETRA-III (P21.1 and P02.1) and the MAX IV (DanMAX) synchrotron light sources.
ZrO2-based nanoparticles are commonly synthesized in hydrothermal or solvothermal processes, and they are important in technological applications such as high-temperature ceramics10 and catalysis as a pure compound,11 or in CexZr1−xO2 as three-way catalysts12 and in yttria-stabilized ZrO2 for fuel cell membranes.13 Zirconium solution species are also precursors for archetypical metal–organic framework materials such as UiO-66.14
As a hard Lewis-acid, Zr4+ is highly prone to hydrolysis even in strongly acidic solutions, and thus it readily forms poly-metal oxo-clusters.15 In aqueous solutions Zr4+ presumably exists as square hydroxo-bridged tetramers, [Zr4(OH)8(H2O)16]8+, as suggested by Muha and Vaughan in 1960 using low Q-resolution X-ray total scattering (TS) data,16 which were compared with a theoretical pattern calculated from the crystal structure of ZrOCl2·8H2O.17 The Zr4+ solution tetramer has been confirmed using EXAFS,18,19 NMR,20 SAXS,21 high-resolution PDF22 and computational methods.23 Furthermore, as the chemistry of Hf4+ is quite similar to Zr4+ due to similar electron configuration and charge density owing to the lanthanide contraction of the f-block, it is not surprising that Hf4+ ions also exist as a [Hf4(OH)8(H2O)16]8+-tetramer in aqueous Hf4+ solutions.16,24 The addition of bidentate ligands to aqueous zirconium solutions tend to change the coordination of the Zr4+ species,22,25–27 thereby rendering speciation control possible, if the underlying assembly mechanisms are better understood.
Solvothermal syntheses with non-aqueous solvents allow tailoring of nanoparticles with narrow size distribution and limited agglomeration,28,29 and solvent effects have provided polymorph control in the synthesis of ZrO2.30 In organic chemistry, inorganic Zr4+ salts are used as promotors and catalysts in non-aqueous reaction media.31 Potential understanding of these reactions requires information about the solution speciation, but the literature on Zr4+ in non-aqueous solvents is limited to a few structures in alcohols.32,33
Here we report the first comprehensive study of Zr4+ solution chemistry by examining structures of ZrCl4 in various solvents (water, methanol, ethanol, acetonitrile), at pH ranging from 0 to 14, in concentrations ranging from 0.1 M to 1.5 M, and we also compare with other zirconium precursor salts (ZrOCl2·8H2O, ZrO(NO3)2·xH2O).
Results and discussion
Aqueous solution structures of ZrCl4
The PDF of ZrCl4 in water (1 M) confirms that the dominant solution species is the [Zr4(OH)8(OH2)16]8+-tetramer (Fig. 1). Here, fits of different tetramer models all based on the initial tetramer structure taken from the single crystal structure of ZrOCl2·8H2O34 are shown. Due to the low X-ray scattering power of hydrogen, these atoms were neglected in the fits, and the OH−/H2O ratio within the tetramer was assumed to be the same as in the crystalline state.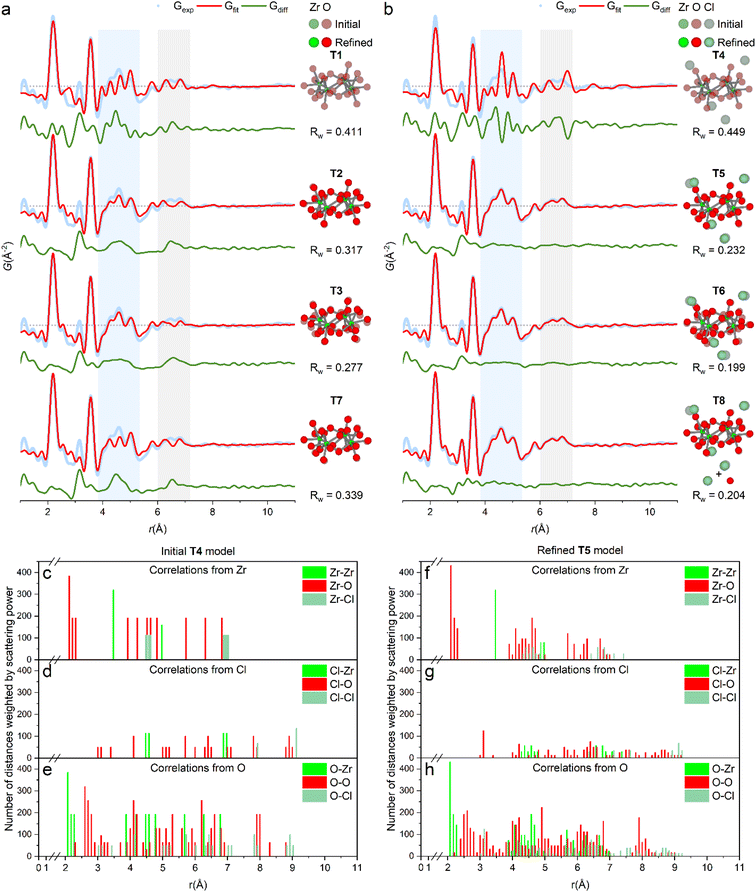 | ||
| Fig. 1 (a and b) PDF of ZrCl4 in water fitted with different tetramer models (see also Table S1†). (a) Models without direct chloride coordination. T1: fixed crystal geometry. T2: refined with box restraint for (Zr, O) of (0.1 Å, 0.1 Å). T3: refined with box restraint for (Zr, O) of (0.5 Å, 0.5 Å). T7: refined T5-model with chlorides removed. (b) Models with direct chloride coordination. T4: fixed crystal geometry. T5: refined with box restraints for (Zr, O, Cl) of (0.1 Å, 0.1 Å, 2 Å). T6: refined with box restraints for (Zr, O, Cl) of (0.5 Å, 0.5 Å, 2 Å). T8: refined T5-model together with a simulation of the 1st hydration shell of chloride by a single Cl–O distance. Shaded and solid atoms correspond to crystal positions and refined positions, respectively. (c–e) Histograms of interatomic correlations in the initial model (T4), and (f–h) the refined T5-model. Refinements are based on data collected at beamline P21.1@PETRA-III. | ||
Fig. 1a shows the fit of this initial, single crystalline model to the experimental PDF (T1), i.e. where no atomic positions are refined. This simple model provides a decent description of all the main features of the PDF and clearly settles that the primary motif found in 1 M aqueous solutions of ZrCl4 is indeed the tetramer, as expected. In fact, the tetramer motif is observed across Zr concentrations of 0.1–1.5 M, which cover the range commonly used in solution-based synthesis (Fig. S2†). Thus, the tetramer is the initial precursor for many common aqueous synthesis pathways.
While the initial tetramer (T1) accounts for the main features of the experimental PDF, the crystalline model is too rigid to describe the PDF data of the solution species in full. This is unsurprising, as the tetramers are prone to both static and temporal disorder in the dynamic environment of the solvent state. Assuming the average composition of [Zr4(OH)8(OH2)16]8+ and retaining the topology of the tetramer using box restraints of 0.1 Å (T2) and 0.5 Å (T3), the atomic positions can be refined to “relax” the initial model to the PDF data with an improved agreement factor (Rw) from 0.411 (T1) to 0.317 (T2) and 0.277 (T3). Note that these refinements, while they result in a better mathematical description of the PDF, are overdetermined and as such not statistically different from the initial model (T1). However, as the atomic movements are greatly limited by box restraints, the tetramer topology is unchanged and the models can therefore to some extent give insight into undescribed features of the PDF.
Evidently, both initial (T1) and relaxed (T2 and T3) models do not account for the PDF features around ∼4.5 Å and ∼6.5 Å (blue and gray region, Fig. 1a) as well as at 3.17 Å. In the ZrOCl2·8H2O crystal structure, chloride ions coordinate to the tetramer with distances at ∼4.5 Å and ∼6.5 Å (Fig. 1c–e),33 indicating a possible similar favorable attraction in solution. Model T4, T5 and T6 include chloride ion coordination with initial positions taken from the same single crystal model for the sake of modelling remanent features in the PDF. When included in the model the different chloride ions only move between 0.2 and 1.0 Å away from the initial crystal positions, and the most relaxed model (T6, 0.5 Å box restraint) achieves an Rw value of 0.199 (Fig. 1b). However, for this model, the oxygen atoms attain unphysical positions when attempting to fit the peak at 3.17 Å. The rigid box restraint of 0.1 Å (T5) appears to be the best compromise between describing the PDF and having a physically credible model.
The peak at 3.17 Å is consistent with the Cl–O distances for the hydration shell of chloride ions (3.1–3.34 Å).35–37 Fig. S5† shows that hydrated chloride ions give sharp PDF correlations at ∼3.2 Å. This effect is included in the final model (T8) by adding a simulation of isolated, hydrated chloride ions by a simple Cl–O distance to the T5-model improving Rw from 0.232 (T5) to 0.204 (T8). In the T7 model, the chloride ions from the T5/T8 models have been removed to highlight their effect on the PDF. The chloride ion positions match distances exactly in the regions where models T1–T3 lack intensity. While again being a result from an overdetermined refinement, the physical soundness of the final model is further evaluated through histograms of all interatomic correlations, which are compared with values for the initial single crystal model (Fig. 1c–h). Most correlations agree well with the crystalline state, but with slightly larger spread as expected for a dynamic solution environment.
Reported low Q-resolution TS16 and SAXS21 experiments also indicated chloride ion coordination to the solution tetramer. Hu et al. hypothesized some contribution to the PDF from chlorides in their study of ZrOCl2 solutions, but without explicit modelling of the PDF.22
Effect of pH on the aqueous solution structure of ZrCl4
Base addition to the zirconium-based precursor solutions is used in synthesis of CeO2–ZrO2 solid solutions,38–40 YSZ,41,42 or to control polymorphism of ZrO2.43,44 Low pH conditions (pH < 3) should give the thermodynamically stable monoclinic polymorph of ZrO2, whereas high pH (pH > 9) should favor the formation of the metastable tetragonal phase. In the synthesis of the multicomponent systems, CeO2–ZrO2 and YSZ, the precipitation of the metal ions at high pH is utilized to ensure homogenous mixing of the cations before subsequent calcination treatment.Since the as-prepared aqueous ZrCl4 solution is highly acidic (pH 0), the full pH range of 0–14 can be achieved by dissolving ZrCl4 in alkaline NaOH solutions. The alkalinity has limited influence on the macroscopic appearance of the precursor solution, which is translucent until pH 12, where it becomes a white gel. At pH 9, some turbidity is present possibly indicating minor precipitation (Fig. S6†).
PDFs at different pH are shown in Fig. 2. Below pH 9, all the main features can be ascribed to the tetramer. SAXS experiments have suggested that base addition results in stacking of tetramers to form the cubed [Zr8(OH)20(H2O)24]8+-octamer.21 These observations are not reproduced here, since this would give PDF peaks corresponding to body-diagonal Zr–Zr distances in the cubed octamer, and a change in relative intensity between the nearest neighbor Zr–O and Zr–Zr peaks with the latter increasing.
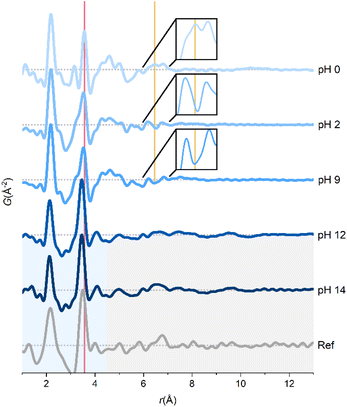 | ||
| Fig. 2 PDFs of aqueous ZrCl4 solutions across pH. A reference PDF of an amorphous intermediate in the solvothermal synthesis of ZrO2 is taken from Dippel et al.27 Red and yellow lines correspond to Zr–Zr and chloride coordination peaks, respectively. The data were collected at beamlines P21.1@PETRA-III (pH 0) and P02.1@PETRA-III (pH 2–14). | ||
The only observed changes in the PDFs at pH 2 and pH 9 compared with pH 0 are marked with lines in Fig. 2. The peak corresponding to nearest-neighbor Zr–Zr correlation (red line) is slightly broadened, making it overlap with the Cl–O peak at ∼3.2 Å. The broader Zr–Zr peak could indicate a slight distortion of the tetramers, but some partial conversion of the tetramer to another species is equally possible. The slightly turbid pH 9 solution could indicate small amounts of precipitated zirconium species, thus explaining the broader Zr–Zr peak in both the pH 2 and 9 solutions.
Notably, the peak at ∼6.5 Å (yellow line) originating from the chloride coordination to the tetramer as argued in the previous section disappears at higher pH. The lack of direct chloride coordination is a result of deprotonation in the tetramer upon addition of NaOH:
| [Zr4(OH)8(H2O)16]8+ + nOH− ↔ [Zr4(OH)8+n(H2O)16−n](8−n)+ + nH2O |
Deprotonation lowers the charge on the tetramer making direct chloride coordination less electrostatically favorable.
At pH 12 and above, the tetramers break down, and sharp correlations only remain up to 4.3 Å (blue region, Fig. 2). The peaks at 2.13 and 3.45 Å are from Zr–O and nearest neighbor Zr–Zr interactions, respectively, although slightly shorter than in the tetramer. The relative intensity of the Zr–Zr peak (compared to the Zr–O peak) has increased indicating a more condensed local coordination environment in the precipitated gel. The highly broadened peaks at 5.0, 6.6 and 9.6 Å presumably originate from disordered Zr–Zr correlations between the rigid structural units in the amorphous gel (gray region, Fig. 2).
In situ TS experiments revealed an amorphous intermediate in the solvothermal formation mechanism of ZrO2,27 YSZ2 and HfO2.45 The PDF of the amorphous intermediate observed by Dippel et al.27 is strikingly similar to the PDFs at pH 12 and 14 (Fig. 2). Thus, high-pressure, high-temperature water mimics alkaline reaction chemistry illustrating the versatility of solvothermal reactions.
Aqueous solution structures of other zirconium salts
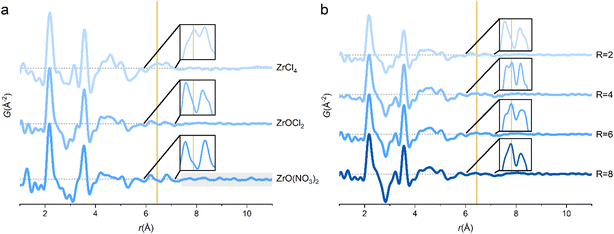
The tetramer persists for ZrOCl2·8H2O and ZrO(NO3)2·xH2O dissolved in water, and the main PDF features resemble the 1 M ZrCl4 solution (Fig. 3a). Since the tetramer already exists in the crystal structure of ZrOCl2·8H2O, it is not surprising that it is also observed in aqueous ZrOCl2 solution. However, the chloride coordination peak at ∼6.5 Å is almost absent for the ZrOCl2 solution (insets, Fig. 3a). This indicates that chloride ions coordinate less to the tetramer in the ZrOCl2 solution compared with the ZrCl4 solution. The chloride ion feature is subtle, but it is reproducible across measurements on different solutions, at different beamlines (P02.1, P21.1 and DanMAX) and at different synchrotron facilities (PETRA-III and MAX IV), clearly suggesting that it is not a data artifact (Fig. S7†).The ZrCl4 and ZrOCl2 solutions differ in their R = [Cl−]/[Zr4+]-ratios of 4 and 2, respectively, but both solutions are very acidic with pH ∼ 0. The dissolution and subsequent hydrolysis reactions of ZrCl4 in water explain the strongly acidic nature of this solution since:
| 4ZrCl4 + 24H2O → [Zr4(OH)8(H2O)16]8+ + 16Cl− + 8H+ |
This is in contrast to the dissolution of ZrOCl2·8H2O (with the compound more correctly expressed as [Zr4(OH)8(H2O)16]Cl8·12H2O), where no H+ ions are generated:
| [Zr4(OH)8(H2O)16]Cl8·12H2O → [Zr4(OH)8(H2O)16]8+ + 8Cl− + 8H2O |
For ZrOCl2·8H2O to obtain a pH of 0, further deprotonation of the water molecules within the tetramer must occur:
| [Zr4(OH)8(H2O)16]8+ ↔ [Zr4(OH)8+n(H2O)16−n](8−n)+ + nH+ |
This lowers the charge of the tetramer and makes chloride coordination less favorable.
Muha and Vaughan observed direct chloride ion coordination to the tetramer in 6 M HCl solutions of ZrOCl2,16 and here the huge excess of H+ ions reverses the deprotonation reaction. In fact similar conditions are required for crystallization of chloride/perchlorate coordinated zirconium tetramers from solution.17,22,46 The coordination of chloride ions to the tetramer in aqueous ZrOCl2 solutions can be controlled by adjusting the R-ratio using HCl (Fig. 3b). At increased chloride ion concentration, the 6.5 Å peak increases in relative intensity, whereas the reference experiment of aqueous HCl solutions do not show sharp correlations in this region (Fig. S5†). Thus, the peak at 6.5 Å must originate from direct coordination of the chloride ions to the tetramer as also seen in the fitting of ZrCl4 PDFs.
For ZrO(NO3)2 in water, the tetramer accounts for the majority of the PDF peaks, but distinct features are seen above 10 Å, i.e. exceeding distances in the tetramer. Zr4+ exists as infinite chains of edge-sharing polyhedra in the crystal structure of ZrO(NO3)2·xH2O,47 and the longer-range correlations may be untransformed chains in the solution. However, the primary structural motif is still the tetramer and as expected there is no 6.5 Å chloride coordination peak in the ZrO(NO3)2 solution. Due to the low X-ray scattering power of nitrogen and oxygen, it is not possible to determine if nitrate ions coordinate to the tetramer in a manner similar to the chloride ions in the ZrCl4 solution.
The structural similarity between the different precursor salts in water could indicate that the precursor salt plays a minor role for the synthesis outcome. However, the effect of the anion species during particle formation cannot be neglected, and future in situ X-ray scattering studies advantageously could investigate this aspect.
Non-aqueous solution structures of ZrCl4
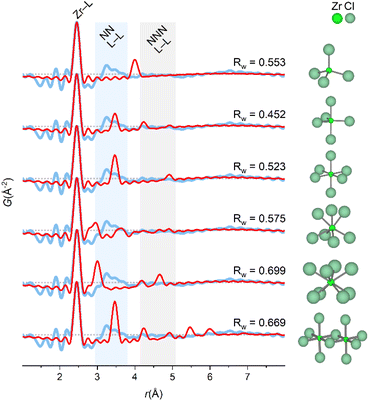
The coordination chemistry of Zr4+ in the non-aqueous solvents is different from the aqueous tetramer, but it is noteworthy that the structural correlations observed in methanol, ethanol and acetonitrile are very similar with peaks in three regions only (Fig. 4).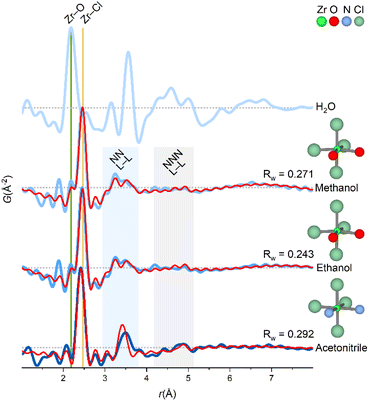 | ||
| Fig. 4 PDFs of ZrCl4 dissolved in different solvents. The experimental PDF matches a monomer-model with an octahedral coordination of the ligands for non-aqueous solvents. Green and yellow lines at ∼2.2 Å and ∼2.5 Å match Zr–O and Zr–Cl correlations, respectively. Shaded blue and gray regions corresponds to nearest neighbor (NN L–L) and next-nearest neighbor (NNN L–L) ligand–ligand correlations, respectively. An exponentially damped sinusoidal function is included in the models to account for long-period modulation of the intensity in the PDF for methanol and ethanol (see ESI Section 6†). Data collected at P21.1@PETRA-III (H2O, methanol and ethanol) and P02.1@PETRA-III (acetonitrile). | ||
When ZrCl4 is dissolved in the non-aqueous solvents, Zr4+ preserves primary coordination to chloride, and since the extent of the PDF signal is limited, Zr4+ must exist as monomers in these solutions (indeed a dimer would have correlations far exceeding those observed experimentally, Fig. 5).
In Fig. 5, model PDFs of common coordination geometries are superimposed on the experimental PDF of the ZrCl4/methanol solution. The bond lengths in the model structures are manually adjusted to match the first sharp pair correlation observed in the experimental PDF at ∼2.5 Å, which agrees well with a Zr–Cl distance. The other peaks originate from ligand–ligand correlations, which are distinctly different for the various monomeric motifs.
Both the trigonal bipyramidal and octahedral models qualitatively agree with the experimental PDF with peaks in same three regions as the experimental PDF. Yet, both structures do not account for the broad nature of the ∼3.2 Å peak. For the other models, the nearest-neighbor ligand–ligand (NN L–L) correlations are either too long (tetrahedral model) or too short (capped trigonal prismatic and square antiprismatic). As stated previously, a model structure extending beyond a monomeric motif e.g. a dimer predicts correlations greatly exceeding those observed experimentally.
Studies on simple coordination complexes of Zr4+ have found a preference for cis-ZrCl4X2 (X = pinacolone, pyridine, THF) octahedral complexes,48–50 and in the crystalline state of ZrCl4, Zr4+ is coordinated to Cl− in zig-zag chains of edge-sharing irregular octahedra.51 Models based on the irregular octahedra from the crystal structure of ZrCl4 are fitted to the experimental PDF without refining atomic positions in Fig. 6.
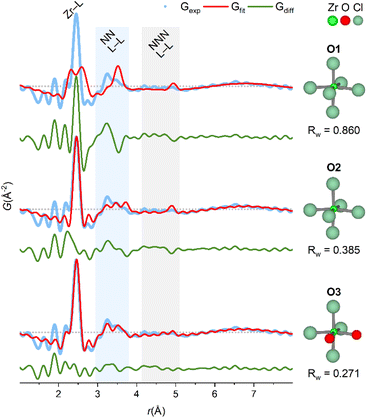 | ||
| Fig. 6 PDF of ZrCl4 in methanol fitted with octahedral models derived from crystal structure of ZrCl4 (see also Table S10†). O1: fixed crystal geometry, i.e. both bond lengths and angles are preserved. O2: fixed bond angles from crystal geometry, but bond lengths manually adjusted to 2.46 Å to match the first sharp correlation in the PDF. O3: based on O2, but with two chlorides exchanged with oxygen and bond lengths manually adjusted to 2.25 Å. For all fits, an exponentially damped sinusoidal function is included in the models to account for long-period modulation of the intensity in the PDF (see ESI Section 6†) with parameters obtained from the fit of O3 model. Data collected at P21.1@PETRA-III. | ||
In the O1 model, bond lengths and angles are preserved from the crystalline state, however, there is a clear mismatch, since the experimental PDF has a single, sharp Zr–Cl peak at ∼2.5 Å, whereas the model has three distinct Zr–Cl distances of 2.655 Å, 2.498 Å and 2.307 Å. In the O2 model, these three distances are manually adjusted to match the first sharp peak in the PDF while preserving the bond angles from the crystalline state. Adjusting the bond lengths improves Rw from 0.860 (O1) to 0.385 (O2) and describes the NN L–L peak better.
If the Zr4+ monomers are in fact octahedrally coordinated in the ZrCl4/methanol, some ligand exchange with the solvent must occur to balance the stoichiometry of four chloride ions per Zr4+ ion. In the O3 model, two chloride ions are exchanged with oxygen (as a proxy for coordinating methanol molecules) to produce a cis-ZrCl4O2 octahedron. Notably, the Zr–Cl peak in the experimental PDF has a weak shoulder matching a Zr–O distance (yellow and green lines, Fig. 4), and so the Zr–O bond lengths are adjusted to 2.25 Å to match this. This model achieves an Rw value of 0.271 and provides a good visual description of all the main features in the experimental PDF.
From the above considerations, it is probable that the Zr4+ monomers are in large part octahedrally coordinated to chloride ions and solvent molecules to balance the stoichiometry. Note that since the experimental PDF is both a temporal and static average of the whole ensemble of structures in the solution, several other structures with different coordination geometries can exist and contribute to the PDF.
Relation to materials synthesis
In general, solvothermal synthesis of ZrO2 nanoparticles results in the thermodynamically stable monoclinic polymorph, when water is used as a solvent (hydrothermal),43,52–54 whereas alcoholic solvent mixtures results in mixtures of particles with the monoclinic and the (metastable) tetragonal polymorph.27,55,56 By tuning the water/ethanol ratio, the ratio of monoclinic/tetragonal phase can be tuned with less monoclinic phase formed in the absence of added water.55 In borderline non-hydrolytic sol–gel syntheses, the ratio of formed ZrO2 phase can even be tuned by choosing alcohols of different thermal stability or by lowering the reaction temperature, so the in situ formation of water molecules are reduced.57 This suggests that the availability of water molecules is crucial in determining the reaction outcome.The fact that the Zr4+ is found to exist as hydroxy-bridged tetramers in water regardless of precursor salt and concentration corroborates well with the fact that the monoclinic phase exclusively forms in hydrothermal syntheses. In these solutions, all zirconium species will already be saturated with the required amount of water molecules and connected in larger (“prenucleation”) assemblies, and so the monoclinic phase can readily form. In the non-aqueous solvents (disregarding acetonitrile in the current discussion of ZrO2 synthesis), the Zr4+ ions maintain their coordination to chloride from the crystal structure in isolated monomers and only partially coordinate to the oxygen source (methanol/ethanol). Inevitably, the nucleation of ZrO2 nanoparticles from these solutions will involve more chemical steps (solvent decomposition, ligand exchange, monomer assembly), thus possibly creating reaction conditions suitable for forming the tetragonal phase. To investigate the formation mechanism from these non-aqueous ZrCl4 solutions, in situ X-ray scattering experiments could advantageously be utilized.
Conclusions
Zr4+ ions in solution are precursors in many chemical reactions either to produce important zirconia-based nanomaterials or to carry out catalytic chemical transformations in organic chemistry, and the structures of the ions in solution should therefore form core chemistry textbook material.When dissolving ZrCl4 in methanol, ethanol and acetonitrile, Zr4+ exists as monomers primarily preserving the coordination to the chloride ions. An octahedral model provides the best description of the features in the experimental PDF. Based on stoichiometry consideration and features in the PDF some ligand exchange must have occurred. Yet, it cannot be ruled out that multiple other structures coexist.
Zr4+ exists as [Zr4(OH)8(OH2)16]8+-tetramers in aqueous solutions regardless of concentration (0.1–1.5 M), precursor salt (ZrCl4, ZrOCl2·8H2O, ZrO(NO3)2·xH2O) and within the pH range of 0–9. At higher pH, Zr4+ precipitates as disordered, amorphous gels with nearest neighbor Zr–Zr correlations only. Second sphere coordination of chloride counter ions to the tetramers is demonstrated by structural modelling of the experimental PDFs in combination with chemical manipulation either by base addition or by changing the [Cl−]/[Zr4+]-ratio of the solution. The subtle features in the PDFs related to the chloride coordination are consistent across repeated measurements at different synchrotron facilities, strongly supporting that modern PDF analysis is a reliable and powerful tool for structural analysis of complex solution systems.
The systematic study of Zr4+ solution structures across a wide parameter space provides a baseline understanding for synthesis of zirconia-based functional nanomaterials and solution-based zirconium chemistry in general.
Experimental
Solution preparation
Anhydrous ZrCl4 (Sigma Aldrich, 99.99%), ZrOCl2·8H2O (Sigma Aldrich, 99.5%) and ZrO(NO3)2·xH2O (Sigma Aldrich, 99%) were used without further purification. The zirconium salts were dissolved in either deionized water, absolute ethanol, methanol or anhydrous acetonitrile to a total metal concentration of 1 M. Since the exact degree of hydration is unknown for ZrO(NO3)2·xH2O, only an approximate 1 M concentration was obtained. Upon dissolution, translucent solutions were obtained with no sign of gelation. For all 1 M aqueous solutions, the pH was 0. A series of aqueous ZrCl4 solutions with concentrations ranging from 0.1–1.5 M was made to study the effect of dilution on the solution structures.A pH series was made by dissolving ZrCl4 in diluted aqueous NaOH solutions with concentrations of 1, 2, 3 and 6 M such that pH values of 2, 9, 12 and 14, respectively, were obtained. The total zirconium concentration was maintained at 1 M. For pH 12 and 14, the alkalinity of the solutions resulted in gelation (Fig. S6†).
Another series was made by dissolving ZrOCl2·8H2O in aqueous HCl solutions with concentration of 2, 4 and 6 M while maintaining the total zirconium concentration at 1 M.
All samples were prepared immediately prior to measurement.
Total scattering experiments
Total scattering (TS) experiments were conducted at the P02.1 and P21.1 beamlines at PETRA-III (DESY, Hamburg, Germany) using photon energies of ∼60 keV (λ = 0.2072 Å) and ∼103 keV (λ = 0.1204 Å), respectively, as well as at the DanMAX beamline at MAX IV (Lund, Sweden) using photon energy of ∼35 keV (λ = 0.3553 Å). Both PETRA-III beamlines feature 2D PerkinElmer XRD 1621 area detectors for data acquisition, whereas DanMAX features a Dectris PILATUS3 X CdTe 2 M area detector. At P02.1, the sample-to-detector distance was ∼20 cm allowing for an instrumental Qmax of 23 Å−1, whereas the distance was ∼30 cm at P21.1 giving a Qmax of 28.8 Å−1 and it was ∼9.3 cm at DanMAX giving a Qmax of 20.5 Å−1.The solutions were loaded into 1.45 mm and 1.00 mm Kapton capillary tubes sealed with epoxy at PETRA-III and MAX IV, respectively. Data acquisition was performed at ambient conditions with an acquisition time of 5–10 min per experiment. Background measurements of the solvent loaded into Kapton capillaries were performed to account for air, capillary and solvent scattering.
The procedure for data treatment and details on the refinements can be found in the ESI.†
Author contributions
MK designed the project, measured data, carried out data analysis, wrote the initial draft and did review and editing. RSC, IGN, and SS measured data and carried out data analysis, discussion, review and editing. ACD and MRVJ measured data and contributed discussion, review and editing. BBI designed the project, conducted supervision, discussion, resource acquisition, validation, review and editing.Conflicts of interest
There are no conflicts to declare.Acknowledgements
The work was supported by the Villum Foundation. We gratefully acknowledge DESY (Hamburg, Germany), a member of the Helmholtz Association HGF, for granting beamtime at PETRA-III. We acknowledge MAX IV Laboratory for time on beamline DanMAX under proposal 20200749. Research conducted at MAX IV is supported by the Swedish Research Council under contract 2018-07152, the Swedish Governmental Agency for Innovation Systems under contract 2018-04969, and Formas under contract 2019-02496. DanMAX is funded by the NUFI grant no. 4059-00009B. We thank Michael Wharmby, Oleh Ivashko, Olof Gutowski and Martin Von Zimmermann for providing assistance at P02.1 and P21.1, as well as Innokenty Kantor for assistance at DanMAX. We furthermore thank Andreas D. Bertelsen, Nils L. N. Broge, Frederik N. Søndergaard-Pedersen, Martin Roelsgaard, Xenia H. Hansen, Niels F. Juhl and Andy S. Anker for assistance during beamtime and for fruitful discussions.References
- L. Soderholm and J. F. Mitchell, APL Mater., 2016, 4, 053212 CrossRef.
- C. Tyrsted, N. Lock, K. M. Ø. Jensen, M. Christensen, E. D. Bøjesen, H. Emerich, G. Vaughan, S. J. L. Billinge and B. B. Iversen, IUCrJ, 2014, 1, 165–171 CrossRef CAS PubMed.
- D. Saha, E. D. Bøjesen, K. M. Ø. Jensen, A.-C. Dippel and B. B. Iversen, J. Phys. Chem. C, 2015, 119, 13357–13362 CrossRef.
- D. Saha, E. D. Bøjesen, A. H. Mamakhel and B. B. Iversen, Inorg. Chem., 2020, 59, 9364–9373 CrossRef CAS PubMed.
- A. Navrotsky, Proc. Natl. Acad. Sci. U. S. A., 2004, 101, 12096–12101 CrossRef CAS PubMed.
- D. Gebauer and H. Cölfen, Nano Today, 2011, 6, 564–584 CrossRef CAS.
- D. Gebauer, M. Kellermeier, J. D. Gale, L. Bergström and H. Cölfen, Chem. Soc. Rev., 2014, 43, 2348–2371 RSC.
- S. Sommer, I. G. Nielsen and B. B. Iversen, Chem.–Eur. J., 2020, 26, 1022–1026 CrossRef CAS PubMed.
- H. Xu, S. Sommer, N. L. N. Broge, J. Gao and B. B. Iversen, Chem.–Eur. J., 2019, 25, 2051–2058 CrossRef CAS PubMed.
- M. H. Bocanegra-Bernal, J. Mater. Sci., 2002, 37, 4947–4971 CrossRef CAS.
- T. Yamaguchi, Catal. Today, 1994, 20, 199–217 CrossRef CAS.
- Q. Wang, B. Zhao, G. Li and R. Zhou, Environ. Sci. Technol., 2010, 44, 3870–3875 CrossRef CAS PubMed.
- J. W. Fergus, J. Power Sources, 2006, 162, 30–40 CrossRef CAS.
- Y. Bai, Y. Dou, L.-H. Xie, W. Rutledge, J.-R. Li and H.-C. Zhou, Chem. Soc. Rev., 2016, 45, 2327–2367 RSC.
- C. F. Baes and R. E. Mesmer, The Hydrolysis of Cations, John Wiley & Sons, New York, 1976 Search PubMed.
- G. M. Muha and P. A. Vaughan, J. Chem. Phys., 1960, 33, 194–199 CrossRef CAS.
- A. Clearfield and P. A. Vaughan, Acta Crystallogr., 1956, 9, 555–558 CrossRef CAS.
- C. Hagfeldt, V. Kessler and I. Persson, Dalton Trans., 2004, 2142–2151 RSC.
- V. V. Kanazhevskii, B. N. Novgorodov, V. P. Shmachkova, N. S. Kotsarenko, V. V. Kriventsov and D. I. Kochubey, Mendeleev Commun., 2001, 11, 211–212 CrossRef.
- M. Åberg and J. Glaser, Inorg. Chim. Acta, 1993, 206, 53–61 CrossRef.
- A. Singhal, L. M. Toth, J. S. Lin and K. Affholter, J. Am. Chem. Soc., 1996, 118, 11529–11534 CrossRef CAS.
- Y.-J. Hu, K. E. Knope, S. Skanthakumar, M. G. Kanatzidis, J. F. Mitchell and L. Soderholm, J. Am. Chem. Soc., 2013, 135, 14240–14248 CrossRef CAS PubMed.
- N. Rao, M. N. Holerca, M. L. Klein and V. Pophristic, J. Phys. Chem. A, 2007, 111, 11395–11399 CrossRef CAS PubMed.
- F. C. N. Firth, M. W. Gaultois, Y. Wu, J. M. Stratford, D. S. Keeble, C. P. Grey and M. J. Cliffe, J. Am. Chem. Soc., 2021, 143, 19668–19683 CrossRef CAS PubMed.
- V. V. Kanazhevskii, V. P. Shmachkova, N. S. Kotsarenko, V. N. Kolomiichuk and D. I. Kochubei, J. Struct. Chem., 2006, 47, 860–868 CrossRef CAS.
- C. Hennig, S. Weiss, W. Kraus, J. Kretzschmar and A. C. Scheinost, Inorg. Chem., 2017, 56, 2473–2480 CrossRef CAS PubMed.
- A.-C. Dippel, K. M. Ø. Jensen, C. Tyrsted, M. Bremholm, E. D. Bøjesen, D. Saha, S. Birgisson, M. Christensen, S. J. L. Billinge and B. B. Iversen, Acta Crystallogr., Sect. A: Found. Adv., 2016, 72, 645–650 CrossRef CAS PubMed.
- Z. Hua, X. M. Wang, P. Xiao and J. Shi, J. Eur. Ceram. Soc., 2006, 26, 2257–2264 CrossRef CAS.
- X. M. Wang, PhD thesis, The University of Manchester, United Kingdom, 2004.
- W. Li, H. Huang, H. Li, W. Zhang and H. Liu, Langmuir, 2008, 24, 8358–8366 CrossRef CAS PubMed.
- H. Firouzabadi and M. Jafarpour, J. Iran. Chem. Soc., 2008, 5, 159–183 CrossRef CAS.
- V. V. Kanazhevskii, V. P. Shmachkova, N. S. Kotsarenko, V. N. Kolomiichuk and D. I. Kochubei, J. Struct. Chem., 2006, 47, 453–457 CrossRef CAS.
- D. Peter, T. S. Ertel and H. Bertagnolli, J. Sol-Gel Sci. Technol., 1994, 3, 91–99 CrossRef CAS.
- T. C. W. Mak, Can. J. Chem., 1968, 46, 3491–3497 CrossRef CAS.
- S. Cummings, J. E. Enderby, G. W. Neilson, J. R. Newsome, R. A. Howe, W. S. Howells and A. K. Soper, Nature, 1980, 287, 714–716 CrossRef CAS.
- K. W. Chapman, S. H. Lapidus and P. J. Chupas, J. Appl. Crystallogr., 2015, 48, 1619–1626 CrossRef CAS.
- N. Ohtomo and K. Arakawa, Bull. Chem. Soc. Jpn., 1980, 53, 1789–1794 CrossRef CAS.
- S. Letichevsky, C. A. Tellez, R. R. de Avillez, M. I. P. da Silva, M. A. Fraga and L. G. Appel, Appl. Catal., B, 2005, 58, 203–210 CrossRef CAS.
- A. Ahniyaz, T. Watanabe and M. Yoshimura, J. Phys. Chem. B, 2005, 109, 6136–6139 CrossRef CAS PubMed.
- J. Deng, S. Yuan, L. Xiong, S. Li, J. Wang and Y. Chen, Mater. Charact., 2019, 155, 109808 CrossRef CAS.
- M. Yoshimura, T. Hiuga and S. Sōmiya, J. Cryst. Growth, 1985, 71, 277–279 CrossRef CAS.
- H. Hayashi, A. Ueda, A. Suino, K. Hiro and Y. Hakuta, J. Solid State Chem., 2009, 182, 2985–2990 CrossRef CAS.
- H. Ouyang, C. Li, K. Li, H. Li and Y. Zhang, J. Wuhan Univ. Technol., Mater. Sci. Ed., 2016, 31, 68–73 CrossRef CAS.
- R. Srinivasan, M. B. Harris, S. F. Simpson, R. J. D. Angelis and B. H. Davis, J. Mater. Res., 1988, 3, 787–797 CrossRef CAS.
- R. S. Christensen, M. Kløve, M. Roelsgaard, S. Sommer and B. B. Iversen, Nanoscale, 2021, 13, 12711–12719 RSC.
- J. A. Sommers, D. C. Hutchison, N. P. Martin, K. Kozma, D. A. Keszler and M. Nyman, J. Am. Chem. Soc., 2019, 141, 16894–16902 CrossRef CAS PubMed.
- P. Bénard, M. Louër and D. Louër, J. Solid State Chem., 1991, 94, 27–35 CrossRef.
- B. Galeffi, M. Simard and J. D. Wuest, Inorg. Chem., 1990, 29, 951–954 CrossRef CAS.
- T. C. Ray and A. D. Westland, Inorg. Chem., 1965, 4, 1501–1504 CrossRef CAS.
- A. D. Westland and V. Uzelac, Can. J. Chem., 1970, 48, 2871–2876 CrossRef CAS.
- B. Krebs, Z. Anorg. Allg. Chem., 1970, 378, 263–272 CrossRef CAS.
- F. Masoodiyeh, J. Karimi-Sabet, A. R. Khanchi and M. R. Mozdianfard, Powder Technol., 2015, 269, 461–469 CrossRef CAS.
- M. Bremholm, J. Becker-Christensen and B. B. Iversen, Adv. Mater., 2009, 21, 3572–3575 CrossRef CAS.
- L. Kumari, W. Li and D. Wang, Nanotechnology, 2008, 19, 195602 CrossRef PubMed.
- A. Auxéméry, G. Philippot, M. R. Suchomel, D. Testemale and C. Aymonier, Chem. Mater., 2020, 32, 8169–8181 CrossRef.
- C. Tyrsted, B. R. Pauw, K. M. Ø. Jensen, J. Becker, M. Christensen and B. B. Iversen, Chem.–Eur. J., 2012, 18, 5759–5766 CrossRef CAS.
- G. Philippot, M. Kløve, A. Auxéméry, C. Aymonier and B. B. Iversen, manuscript in preparation.
Footnote |
| † Electronic supplementary information (ESI) available: Additional details on PDF modelling (Fig. S1 and S7–S11 and Tables S1–S15) including repetitions of data. PDFs of HCl solutions (Fig. S2). PDFs of concentration variation including sample images (Fig. S3–S6). Experimental section including details on how all PDFs were generated (Section 9, Fig. S12–S39). See DOI: https://doi.org/10.1039/d2sc04522b |
| This journal is © The Royal Society of Chemistry 2022 |

