DOI:
10.1039/D2SC03587A
(Edge Article)
Chem. Sci., 2022,
13, 12987-12995
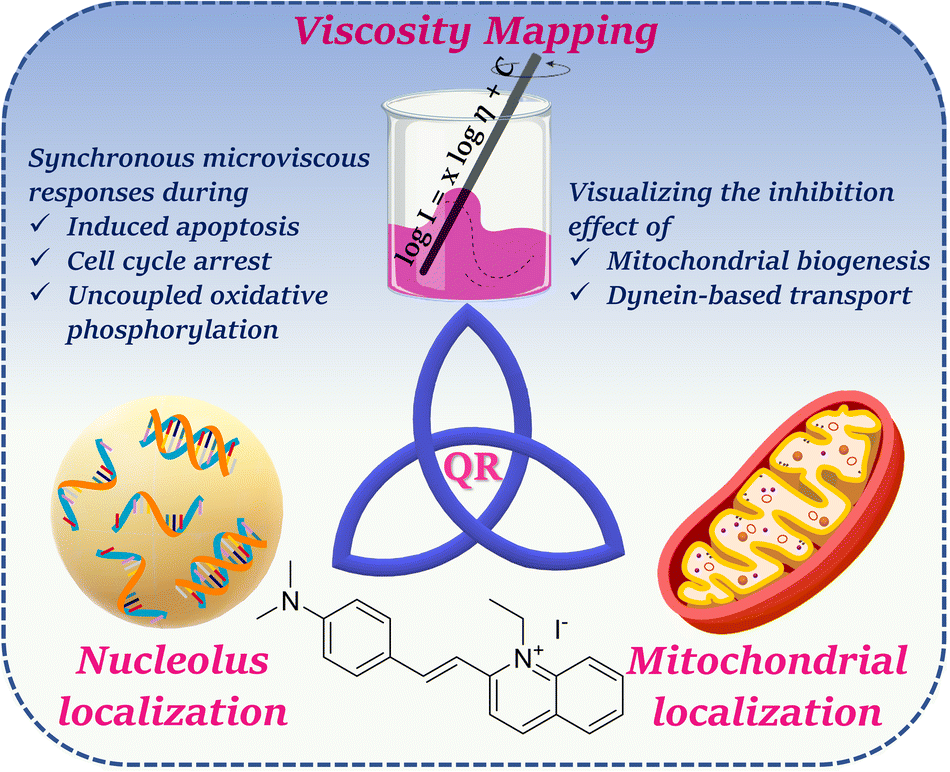
Construing the metaxin-2 mediated simultaneous localization between mitochondria and nucleolus using molecular viscometry†
Received
27th June 2022
, Accepted 6th October 2022
First published on 6th October 2022
Abstract
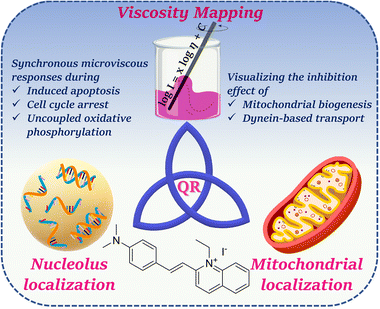
Fluorescent probes for specific inter-organelle communication are of massive significance as such communication is essential for a diverse range of cellular events. Here, we present the microviscosity-sensitive fluorescence marker, Quinaldine Red (QR), and its dual organelle targeting light-up response in live cells. This biocompatible probe was able to localize in mitochondria and nucleolus simultaneously. While QR was able to sense the viscosity change inside these compartments under the induced effect of an ionophore and ROS-rich microenvironment, the probe's ability to stain mitochondria remained unperturbed even after protonophore-induced depolarization. Consequently, a systematic quantification was performed to understand the alteration of microviscosity. Similar behavior in two distinct organelles implied that QR binds to metaxin-2 protein, common to mitochondrial and nucleolar proteomes. We believe this is the first of its kind investigation that identifies the inter-organelle communications marker and opens up a new dimension in this field.
Introduction
Cellular organelles, since their discovery, are primarily considered as individual entities of particular composition that are entitled to specific roles and functions to implement several intracellular events. Nevertheless, such solitary roles are no longer pertinent as defied by the recent scientific advancements in inter-organelle communication.1–4 Organelles exchange information via certain biomolecules and metabolites to maintain long-term cellular homeostasis through different modes of communication: inter-organelle signaling, intracellular trafficking, membrane contact sites (MCS), and inter-organelle transient connections.3,5 In terms of organelle connectivity, mitochondria have remained in the center stage of communication being well-connected to the endoplasmic reticulum, lipid droplets, peroxisomes, and nucleus.6 Such mitochondria-centric communication is responsible for calcium signaling and transport, phospholipid synthesis and transfer, maintaining lipid balance through β-oxidation, and transfer of noncoding RNA.6,7 In this contribution, we took a specific interest to explore the simultaneous localization of a molecular viscometer probe in mitochondria and nucleolus which can lead us to decipher the communication between these two organelles. Upon investigation, it becomes apparent that the fluorescent signal, a function of microviscosity, acts as a tool to quantify the effect in both mitochondria and nucleolus in certain homeostatic and non-homeostatic conditions.
Mitochondria, often referred to as the ‘powerhouse of the cell’, are present in the cytoplasm of most eukaryotes and employed to produce cellular energy, participate in metabolic activities, cell signaling, and mediate cell differentiation.8,9 Additionally, the production of ROS and related oxidative stress alters microenvironmental viscosity and polarity at a specific region.10 Although protein cross-linking by ROS and subsequent formation of protein aggregates are suspected to be the main factor for increasing microenvironmental viscosity, the exact evidence remains unclear.11 Therefore, monitoring mitochondrial viscosity during various biological processes proves to be of enormous importance in providing valuable insight into disease surveillance, thus making the evolution of simpler mitochondria-targeted precise fluorescent probes crucial. Investigation of mitochondrial viscosity copiously utilizes fluorescent probes working on the molecular rotor principle.12,13 These are π-conjugated fluorescent molecules, usually containing electron donor and acceptor moieties connected via a π-bridge/flexible linker.14 Intramolecular free rotation of the connected moieties (often termed as ‘rotators’), around the π-conjugated bridge in a low-viscous environment, induces non-radiative thermal relaxation of excitation energy and quenching of fluorescence while inhibition of the rotation in high viscous media restores the fluorescence.15,16 Now, the most popular mitochondria targeting moiety is the lipophilic cation-triphenylphosphonium (TPP) attached with a fluorescent core.17,18 Commercially available MitoTracker dyes also possess a delocalized positive charge to assist their plasma membrane potential-dependent accumulation in mitochondria. Despite the evolution of numerous mitochondria targeting molecular probes, the discovery of selective probes remains challenging, as we extend our understanding and unfold the function and involvement of the organelle in several diseases and health conditions.
The nucleolus, known as the ‘ribosomal factory of the cell’, is one of the most conspicuous and distinct membraneless substructures inside the nucleus primarily involved in ribosome biogenesis and monitoring proteins for cell cycle regulation. It is a dynamic entity with a highly dense domain as compared to the surrounding nucleoplasm.14 Mainly, it consists of three distinct structural components-fibrillar center, dense fibrillar component, and granular center. The nucleolus is also involved in cell cycle regulation, growth, and development.19 However, little is known about the microviscous response of nucleolus during intracellular events. The probe of interest, QR is also capable of staining nucleolus alongside mitochondria owing to the interaction with a protein, namely metaxin-2. This dual organelle localization brings a new dimension to studying the synchronous behavior of the corresponding cellular compartments during non-homeostatic events such as induced stress and apoptosis, and arrested cell cycle checkpoints. With this report, we introduce a well-known indicator dye, QR, as an efficient fluorescent viscometer and aim to invigorate the field of inter-organelle communication (Scheme 1). For this study, a small molecular organic dye, QR was selected having an electron-donating N,N-dimethylaminophenyl group connected to an electron-deficient quaternized quinoline moiety through a C–C double bond as depicted in the FMO picture (Fig. S1†). QR, a dark red solid, has been proved useful as an indicator,20,21 and a fluorescent tag.22 The electron-withdrawing quinoline moiety present in the molecule was hypothesized to be the key aspect of its targeting ability towards mitochondria. The quaternized nitrogen present in the dye may interact with the phospholipids of the mitochondrial membrane and although the aggregated state of the molecule may experience some change,23 the targeting ability of the molecule would experience little to no change as pH gradient across the membrane is affected. At the outset, we became inquisitive to examine the photophysical behavior, viscosity-dependent emission enhancement of the dye, and understand its usability. The dye working on the molecular rotor principle showed 57-fold fluorescence emission enhancement as viscosity increased from 1 to 480 cP. Alongside being photostable, the probe showed excellent sensitivity as a response to the change in viscosity. The probe was found to be non-cytotoxic, and it simultaneously stains mitochondria and nucleolus. The probe, based on its optical response, can distinguish between the homeostatic and induced viscosity state of the mitochondrial matrix of living cells upon various sub-cellular stress conditions.
 |
| | Scheme 1 Schematic representation of the present work involving simultaneous dual organelle localization and viscosity mapping using Quinaldine Red (QR) as a probe. | |
Results and discussion
QR as a molecular viscometer: the spectroscopic point-of-view
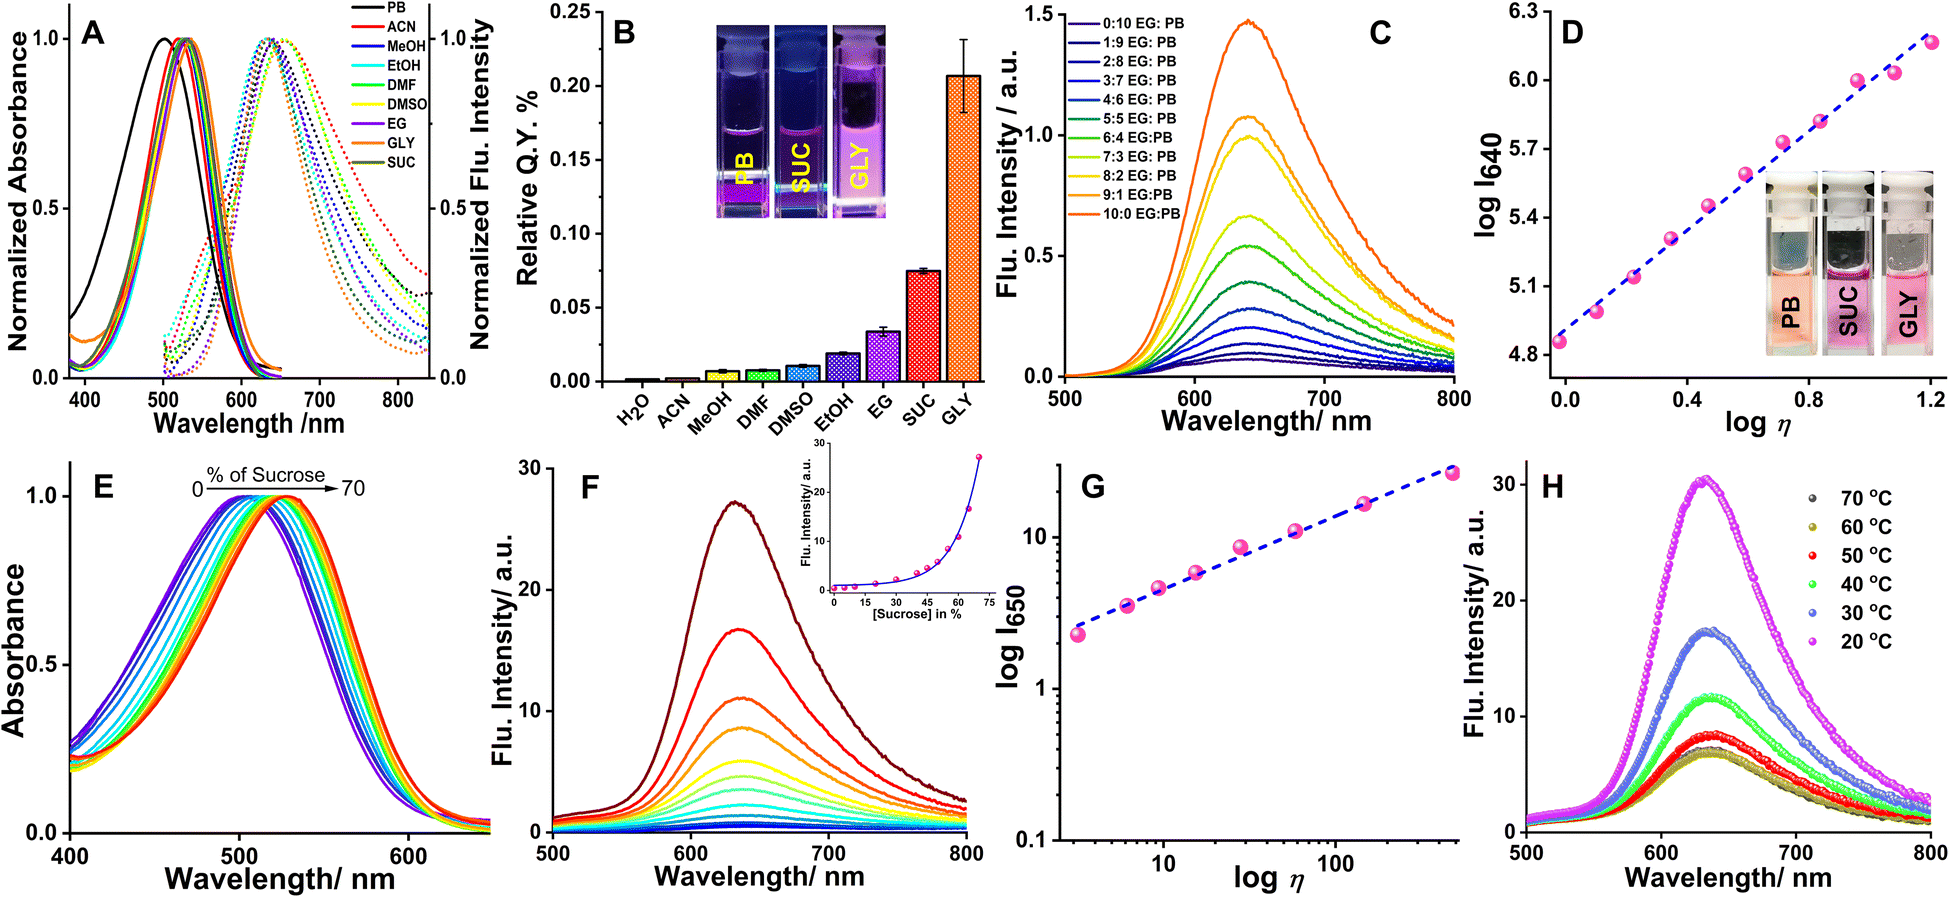
The lipophilicity of any probe, that is being anticipated to localize in the mitochondria,24 is one of the most important physicochemical parameters to look into. The octanol–water partition coefficient is the commonest way to express the lipophilicity of a compound. It is defined as the ratio of the concentration of a solute in a water-saturated octanol phase to its concentration in an octanol-saturated aqueous phase. Now, the model of the structure–activity relation specifying a physicochemical parameter of a probe staining mitochondria should follow the criteria of electric charge, Z > 0 and 0 < log![[thin space (1/6-em)]](https://www.rsc.org/images/entities/char_2009.gif) P <+5, logP being the lipophilicity modeled from the logarithm of the octanol–water partition coefficient (logP).25 As QR bears a positive charge (Z = 1) and its measured logP = 0.104 ± 0.001, it is anticipated that QR is prone to localize inside the mitochondria.
P <+5, logP being the lipophilicity modeled from the logarithm of the octanol–water partition coefficient (logP).25 As QR bears a positive charge (Z = 1) and its measured logP = 0.104 ± 0.001, it is anticipated that QR is prone to localize inside the mitochondria.
The aqueous solution of the probe, orange in color, showed an absorption peak centered at 500 nm. While in highly viscous media the peak was shifted to 535 nm with a change of solution color to pink. A strong fluorescence peak centered at 640 nm was observed as the viscosity of the environment increased. The probe exhibited a good linear relationship (R2 = 0.99, with a slope of x = 0.45, η in cP) between the fluorescence intensity response (logI640) and viscosity (logη), by fitting the Förster–Hoffmann equation26 (eqn S(1)†). Steady-state absorption and fluorescence spectra of QR were recorded in solvents of different polarities (Fig. 1A) and the respective absorbance and intensities have been normalized at the wavelength of maxima. In the solvents of higher polarity e.g., DMF, a redshift of ∼25 nm is observed in the absorption band (w.r.t. water). The shift of absorbance maxima (although very small, ∼10 nm) in protic solvents followed the viscosity order of the solvents. The quantum yield of QR determined in various solvents again followed the order of increasing viscosity of the medium (Fig. 1B, Table S1†). In solvents of low viscosity, quantum yield does not exceed 0.015; in highly viscous media such as glycerol, the value reaches 0.21 ± 0.03 (Fig. 1B). In solvents of higher polarity such as acetonitrile and methanol, QR showed weak fluorescence. However, the emission maxima in polar aprotic solvents are centered around 650 nm, whereas in a polar protic solvent the maxima are centered on 630 nm. Thus, solvent polarity-dependent fluorescence emission, as well as quantum yield, suggests the involvement of several relaxation pathways. The broad nature of the absorbance and fluorescence emission further infers the presence of conformers with a considerably broader distribution of the dihedral angles between the planes of the N,N-dimethylaniline, and the quinoline moieties in the S1 state compared to the ground electronic (S0) state, i.e., loss of structural planarity of the excited state.
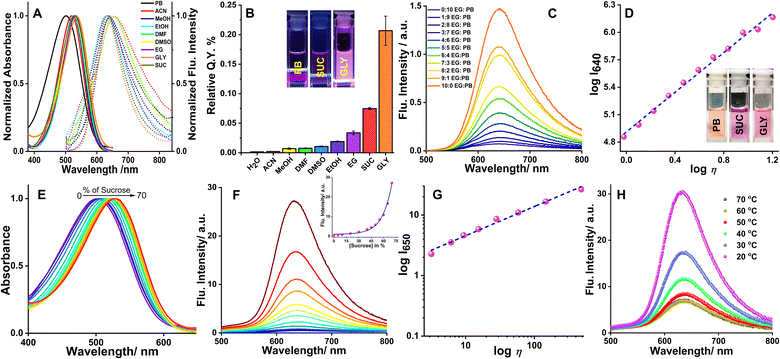 |
| | Fig. 1 (A) Normalized absorption and emission spectra of QR in different solvents, (B) relative quantum yield of QR in different solvents, (C) emission spectra of 10 μM QR in ethylene glycol (EG)/phosphate buffer (PB) mixture of varying ratios, the (D) plot of logI640 and logη, λex/em = 480/640 nm. Insets of (B) and (D) show representative images of QR solution in phosphate buffer, 70% sucrose (SUC), and glycerol (GLY) under UV irradiation (λex = 365 nm) and daylight, respectively, (E) Absorption and (F) emission spectra of 10 μM QR in aqueous sucrose solution of varying concentrations (0, 5, 10, 20, 30, 40, 45, 50, 55, 60, 65, 70%), the inset shows the intensity of QR with increasing percentage of sucrose, (G) plot of logI640 and logη, λex/em = 480/640 nm, (H) emission spectra of 10 μM QR in 70% aqueous sucrose solution with increasing temperature (20, 30, 40, 50, 60, 70 °C). | |
Unfolding the viscosity sensitivity of QR
The viscosity-dependent spectroscopic property of QR was investigated using various ratios of phosphate buffer (PB) and ethylene glycol (EG). Upon increasing the EG fraction from 0 to 100, a 22-fold enhancement of fluorescence was observed (Fig. 1C). The aqueous solution of QR looks orange in color, whereas in glycerol (GLY) a pink solution was obtained (Inset, Fig. 1D). The weak fluorescence intensity of QR in water may be rationalized based on the free rotation of the quinoline and N,N-dimethylamino moieties, forming a non-radiative decayed excited state. A linear relationship (R2 = 0.99, slope = 1.08, η in cP) was observed from the logI vs. logη plot, by fitting the Förster–Hoffmann equation (Fig. 1D, eqn (S1)†). The fluorescent lifetime also was found to get enhanced with increasing viscosity (Fig. S2B†); good linearity was observed from logτ vs. logη plot in sucrose solutions with increasing viscosity (Fig. S2C†).
The pH response of QR, an important aspect of a probe for biological applications, was investigated from UV-visible spectroscopy. The absorption spectra of the dye showed typical pH response patterns of a pH indicator. An increase of the absorbance maxima centered at 500 nm was observed with an isosbestic point at 395 nm, with a simultaneous decrease of a peak appearing at 360 nm (Fig. S3†). At lower pH, the orange-red color of the dye disappeared and the solution turned colorless. The pKa value observed from the inflection point of the plot of absorbance at λmaxvs. pH was close to 2.7.21 However, no significant change in the fluorescence intensity of QR was observed in the pH range of 7–9 (Fig. S4†). In a viscous medium e.g., 70% sucrose (Fig. 1E and F), bright pink solution of QR displayed a strong fluorescence at 635 nm with a 57-fold increase (see inset of Fig. 1F), due to limited free rotation. The emission peak in 70% sucrose was, however, narrower indicating a more constrained environment now being experienced by the chromophore. With an increase of viscosity from 1.1 to 480.6 cP in different percentages of sucrose solutions (% w/w) brilliant enhancement of fluorescence occurred. Good linearity (R2 = 0.99, slope = 0.45, η in cP) observed in the viscosity range (Fig. 1G) further validates the utility of the probe for the detection of viscosity in various media, including biological systems. It is worth mentioning that the viscosity sensitivity of QR, once exposed to a viscous medium, is instantaneous and does not change with time (Fig. S5†). To further validate the viscosity-induced emission enhancement, temperature-dependent emission spectra were recorded with the 70% aqueous solution of sucrose (with 10 μM QR). With an increase in temperature, viscosity decreased as the greater thermal energy allowed the molecules to overcome intermolecular forces responsible for generating viscous drag forces across layers in a liquid. Fig. 1H shows a decrease in fluorescence intensity as temperature increases, however, no change in the emission was observed beyond 70 °C.
Intracellular dual-organelle localization of QR
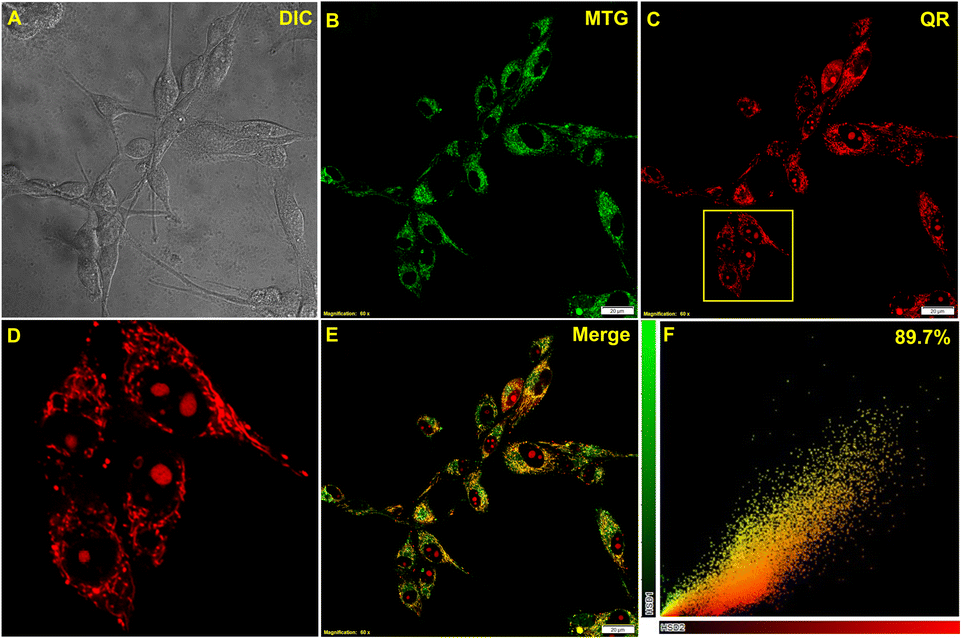
As evident from the detailed spectroscopic studies, the viscosity-based fluorometric response of QR prompted us for live-cell imaging experiments for intracellular viscosity measurements. Initially, the biocompatibility of the probe was monitored by the standard MTT assay in U-87 MG glioblastoma cell lines. Following a 24 h incubation biocompatibility of the probe was monitored by the standard MTT assay in U-87 MG cell lines. With different concentrations of QR in live U-87 MG cells, the IC50 value was found to be above 35 μM (Fig. S6†). Therefore, for live-cell imaging studies, 5 μM QR was used having ∼80% viable cells. Confocal microscopy results suggested the localization of QR in the mitochondrial compartments. To confirm, commercially available Mitotracker green was co-incubated with QR in U-87 MG cells, and Pearson's correlation coefficient was found to be 0.89 suggesting fast and efficient localization of QR in mitochondria (Fig. 2A–F). Furthermore, other commercially available organelle targeting dyes i.e., ER-Tracker Green (Fig. S7A–D†) and LysoTracker Green (Fig. S7F–I†) were taken for co-staining with QR to validate if there is any non-specific localization. Upon analyzing the colocalization results, in both cases, Pearson's correlation coefficient was found to be quite less (Fig. S7E and J†). Even though the mitochondria were lit up by QR staining, Pearson's coefficient was not as higher as we had anticipated. A strong fluorescence signal was also detected from the nucleolus upon staining with QR, as small spherical compartments inside the nucleus could clearly be distinguished (Fig. 2D). The same intracellular localization was also visualized in live CHO cells (Fig. S8†). Therefore, QR proved to be an efficient dual-mode mitochondrial and nucleolus marker and can be useful to simultaneously monitor viscosity changes in both of these cellular compartments.
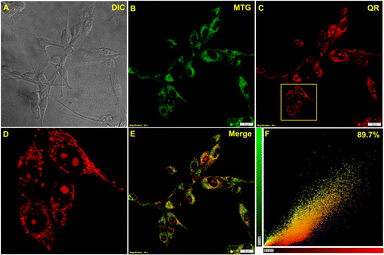 |
| | Fig. 2 Confocal live-cell colocalization experiments in U-87 MG cells. (A) DIC image, (B) stained with 0.3 μM MitoTracker green, (C) stained with 5 μM QR, (D) zoomed section of (C) shows both mitochondria and nucleolus, (E) merge image of (B) and (C), (F) scatter plot shows Pearson's correlation coefficient value of 0.89 ± 0.02. | |
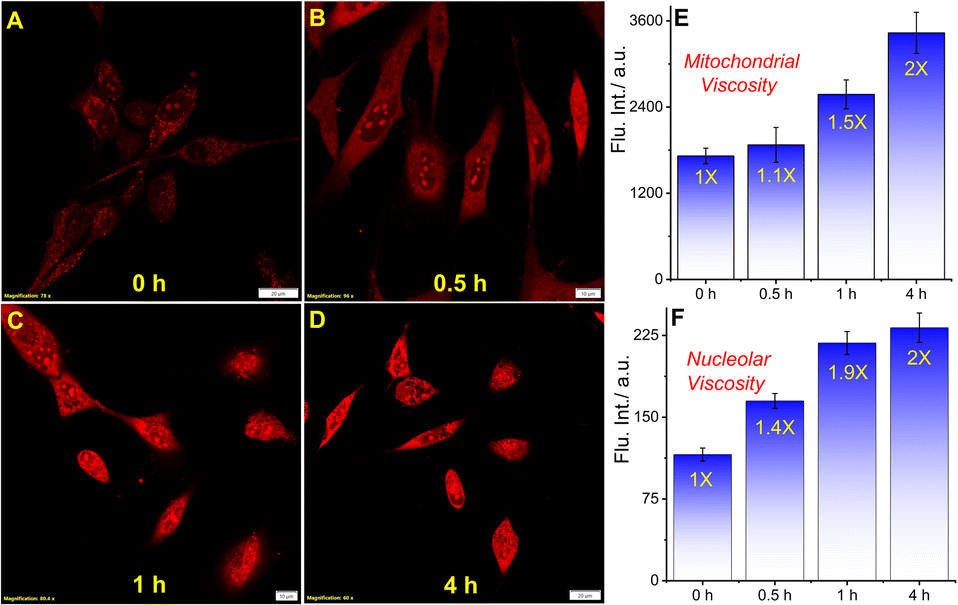
Mapping intracellular microviscosity
In order to explore if QR could detect the microviscosity changes, we used a well-known ionophore monensin that facilitates the transport of Na+ and K+ ions between intracellular and extracellular spaces causing viscosity enhancement by swelling of mitochondria through the disruption of ionic balance.27–29 The living U-87 MG cells were treated with 10 μM monensin and incubated for 30 min, 1 h, and 4 h before staining with 5 μM QR (Fig. 3A–D, F–I). The post-staining analysis showed a gradual increase in the fluorescence intensity with a longer incubation period as the mitochondrial viscosity shoots up to 2-fold after 4 h (Fig. 3E). A similar analysis was performed considering the ROIs from nucleolus showed a 2-fold viscosity increment (Fig. 3F). Noticeably, the viscosity increment of the nucleolus was faster compared to mitochondria. Moreover, to verify the viscosity enhancement by monensin in live cells in a whole culture dish, we performed a flow cytometry experiment. Live U-87 MG cells were treated with 10 μM monensin for 4 h and the corresponding fluorescence signal was analyzed by the flow cytometry analysis as compared to the signal from untreated cells. As shown in Fig. S11,† a considerable shift in the stained cell population signifies the intensity enhancement upon monensin treatment.
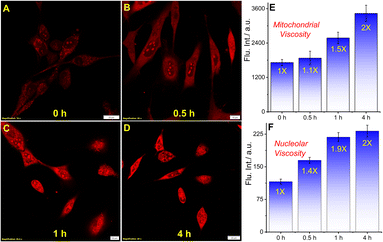 |
| | Fig. 3 Confocal microscopy images of U-87 MG cells stained with 5 μM QR and treated with monensin to monitor viscosity changes at different time intervals. (A) QR only, and with 10 μM monensin for (B) 30 min, (C) 1 h, (D) 4 h; bar plots (E) and (F) show the mitochondrial and nucleolus viscosity increment (scale bar: 10 μm) (quantification was performed considering 10 different ROIs as shown in Fig. S9†). | |
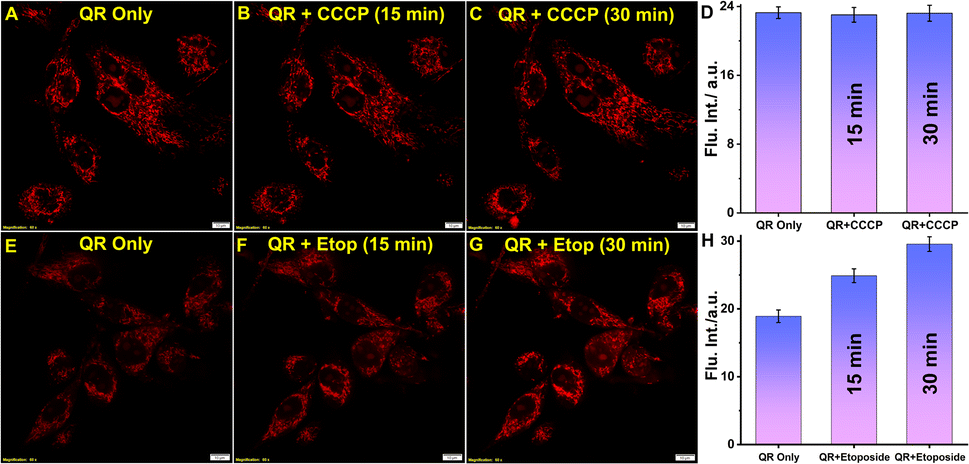
Does the mitochondrial membrane potential drive the localization?
Carbonyl cyanide m-chlorophenylhydrazone (CCCP) is a typical uncoupler of oxidative phosphorylation in mitochondria, which is widely used in studies on mitochondrial uncoupling.30–32 Hence, mitochondrial localization depends on the disruption of the membrane potential. Therefore, we treated the U-87 MG cells with 20 μM CCCP and incubated them for two different periods (Fig. 4A–D). However, there was no change in the fluorescence intensity coming from the mitochondrial compartment, and localization was observed with the same efficiency. Additionally, the mitochondrial morphology remained unaltered even after 30 min treatment of CCCP dismissing any possibility of non-specific localization of QR upon mitochondrial membrane depolarization. This points toward the fact that the localization of QR is independent of the mitochondrial membrane potential (MMP). Additionally, we have performed the standard JC-1 assay to verify the mitochondrial membrane depolarization in the experimental conditions (Fig. S12†).
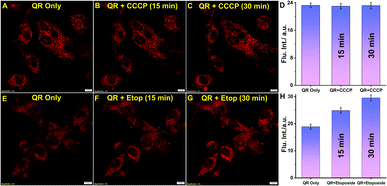 |
| | Fig. 4 Confocal microscopy images of U-87 MG cells stained with 5 μM QR and treated with CCCP and etoposide; (A) & (E) incubated with QR only, treated with 20 μM CCCP for (B) 15 min, (C) 30 min, (D) bar plot shows no change in the intensity even after membrane potential uncoupling; treated with 50 μM etoposide for (F) 15 min, (G) 30 min, and (H) bar plot shows the viscosity enhancement upon induced apoptosis. (scale bar: 10 μm) (quantification was performed considering 10 different ROIs as shown in Fig. S10†). | |
Effect of induced apoptosis and cell cycle arrest on microviscosity
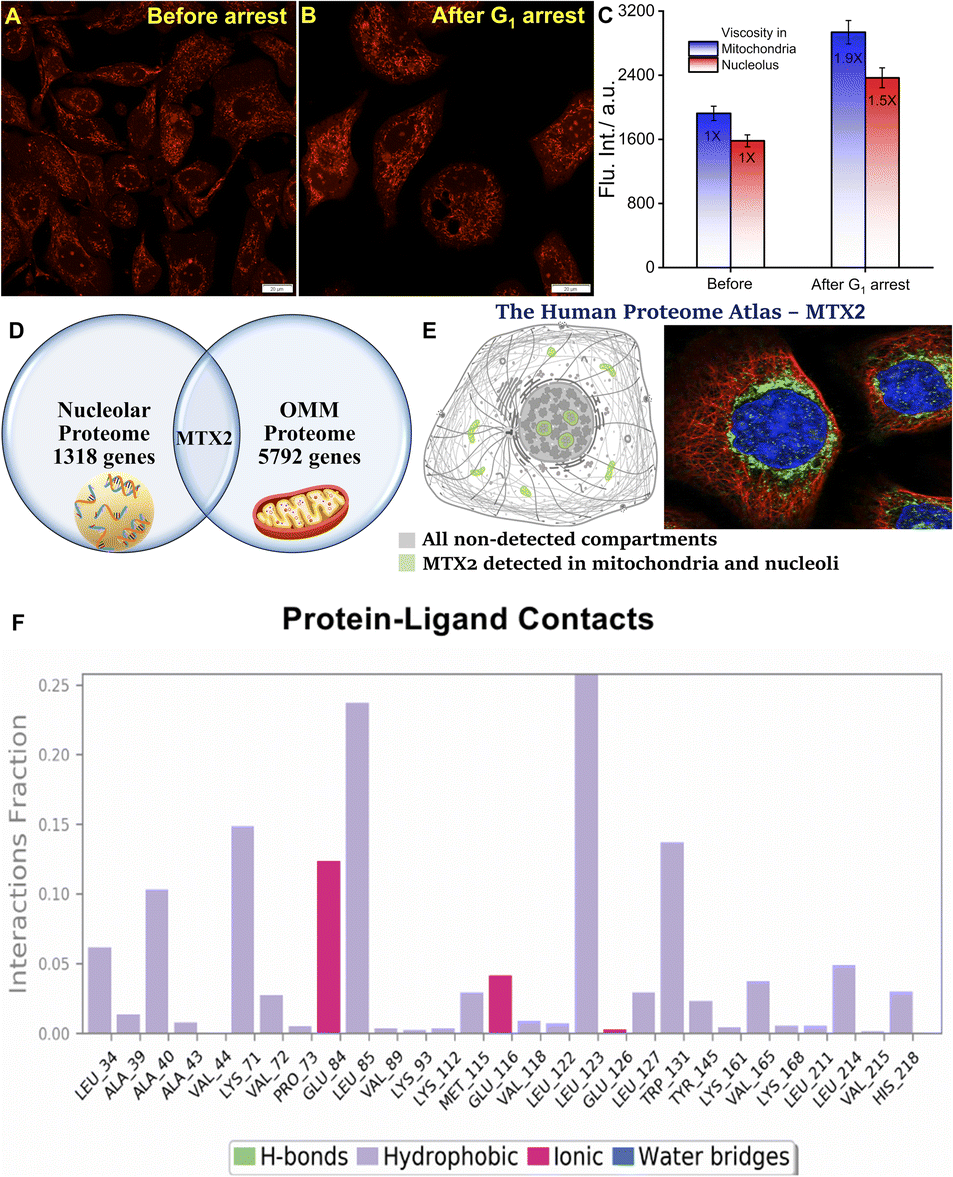
Further experiments were carried out to monitor mitochondrial viscosity change upon induced apoptosis. Etoposide increases the reactive oxygen species (ROS) production causing mitochondrial damage which eventually results in increased viscosity.33,34 U-87 MG cells were treated with 50 μM etoposide and incubated for 15 min and 30 min, and a significant enhancement of mitochondrial viscosity was observed (Fig. 4E–H). The generated ROS level by etoposide treatment was verified by the standard DCFDA assay (Fig. S13†). This suggests the utility of the probe to monitor mitochondrial viscosity changes in different homeostatic and non-homeostatic conditions. We have also explored the possibility of microviscosity changes upon cell cycle arrest and thereby being able to monitor it. Tunicamycin (Tm) is a well-known antibiotic that inhibits the glycosylation of nascent proteins causing deficiency of the biologically important glycoproteins in the cell.35–37 It is also widely used for the activation of unfolded protein response (UPR) and induces endoplasmic reticulum stress.38–40 Eventually, it acts as the primary agent for the accumulation of cell cycle regulator protein p27, essential for G1/S phase progression.42,43 Interestingly, the ER stress induction also causes a significant enhancement in the protein level in the mitochondrial membrane, encouraging us to inspect any change in the microviscosity. As the localization of QR is mitochondrial potential-independent, the Tm treated (1 μg mL−1) cells were stained with QR and the fluorescence signals were measured thereafter.
Much to our delight, the average intensity measured from the mitochondrial compartment was significantly higher post-Tm treatment for 24 h justifies our rationale (Fig. 5A–C). Therefore, we believe that QR finds its way precisely to the mitochondrial membrane. We, further, intuitively measured the intensity coming from the nucleolus under the same experimental conditions. Based on the average signal intensity calculated from the different nucleolus ROIs, it was evident that nucleolar microviscosity also increased by Tm. Even though no reports directly correlate the effect of Tm on nucleolar microviscosity, we believe it plays a definite role in it. At the beginning of mitosis, the nucleolus disassembles and gets dispersed in different parts of the cell while reassembly takes place in the telophase and early G1 phase. It is well-known that condensation of the ribosome assembly factor occurs after Tm addition to the cells leading to the enhancement of the fluorescence signal.44,45 In homeostatic conditions, such condensation results in the increased molecular density of the nucleolus.44–46 However, the extent of signal enhancement, and thereby the microviscosity, is not too high (Fig. 5C). This can be explained by the effect of another retrograding factor in this aspect. The synthesis of some glycoproteins brings about a natural decrease in nucleolar size. Nonetheless, such a natural decrease is delayed after Tm treatment due to inhibition of glycoprotein synthesis.47
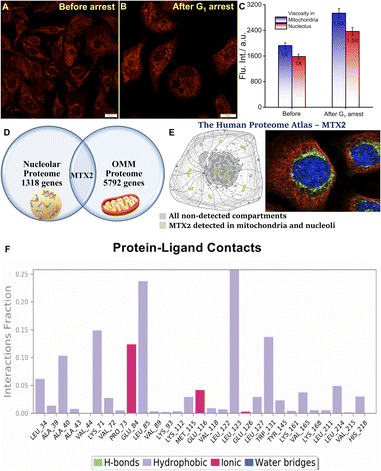 |
| | Fig. 5 Confocal microscopy images of U-87 MG cells stained with 5 μM QR before (A) and (B) after G1 phase cell cycle arrest induced by 1 μg mL−1 tunicamycin for 24 h; (C) bar plot shows the enhancement of mitochondrial and nucleolar viscosity after G1 arrest. (Scale bar: 20 μm); (D) Schematic representation of the common protein metaxin-2 (MTX2) that is localized in the outer mitochondrial membrane (OMM) and nucleoli; (E) the human proteome atlas shows that MTX2 is localized to the mitochondria and nucleoli; the green parts (mitochondria and nucleolus) denote the presence of MTX2, the subcellular location is supported by literature; immunofluorescent staining of human cell line A-431 shows localization to nucleoli & mitochondria;41 (F) the interaction of the protein with the ligand monitored throughout the MD simulation for t = 0–100 ns. | |
The interconnection between mitochondria and nucleolus
Until now we have seen a distinct yet synchronous behavior of mitochondria and nucleolus during uncoupled oxidative phosphorylation, induced apoptosis, and cell cycle arrest. Moreover, observations suggest that QR stays in the outer mitochondrial membrane (OMM) and does not cross the intermembrane space upon CCCP treatment as we did not see any change in mitochondrial staining. As these findings suggest, such simultaneous dual organelle localization of QR led us to look for a common factor. Hence, the plausible rationale – QR binds to a specific protein that is present in both mitochondria and nucleolus. Therefore, we have searched for proteins that are common between the OMM proteome and the nucleoli proteome.48,49 We restricted our search to only high confidence hits and found only a single protein that was common to both proteomes namely metaxin-2 or MTX2 (Fig. 5D). This was further verified by appropriate annotation of cellular localization from the human proteome atlas.41 MTX2, a 263 amino acid residue protein, is a part of the metaxin protein family that is found in OMM. MTX2 carries genetic information and plays a major role in protein transport into the mitochondria.50–52 Deficiency of MTX2 leads to fragmentation of the mitochondrial network, alteration of oxidative phosphorylation, and the resistance of tumor necrosis factor-induced (TNF-α) cell death while increasing senescence.53,54 Alongside, such deficiency results in morphological abnormalities of the nucleus that has been ultimately linked to mandibuloacral dysplasia, a rare genetic disorder.54 More importantly, the literature suggests that MTX2 is also localized in the nucleolus (Fig. 5E).41 The stable binding of MTX2 and QR was verified by performing Molecular Dynamics (MD) simulation for 100 ns (Fig. 5F and S14–S16†) with the ligand largely forming hydrophobic and a few ionic contacts with the MTX2 amino acid residues. This investigation provided us with a clearer picture of intermolecular interaction with the amino acid residues of MTX2 with QR. Briefly, Ala 40, Leu 85, Leu 123, Trp 131, and Leu 214 residues show significant hydrophobic interaction with QR. Lys 71 shows a dispersion interaction with the aromatic part connected with the N,N-dimethylamino group. The permanent positive charge of the quinolinium moiety of QR shows electrostatic interaction with the negatively charged carboxylate part of Glu 84 and Glu 116 (Fig. 5F). As all proteins located in the mitochondrial outer membrane are synthesized by cytosolic ribosomes and encoded in the nucleus while ribosome biogenesis occurs in nucleoli, the connection between nucleoli and mitochondria can be well-ascertained. To gain further support, we performed an RNA digestion experiment. Small molecular cationic fluorescent probes are prone to interact with the phosphate backbone and nucleotide of RNA. Therefore, live U-87 MG cells were treated with 100 μM DNase free RNase A for 4 h and co-stained with 8 μM Hoechst 33342 and 5 μM QR. The cells were imaged for different periods of RNase A treatment (2 h and 4 h) to check for any alteration in the nucleolar staining (Fig. S17A–I†). However, the fluorescence signal from the nucleolar compartment remained unaffected even after 4 h of RNase treatment validating our finding of QR-MTX2 interaction.
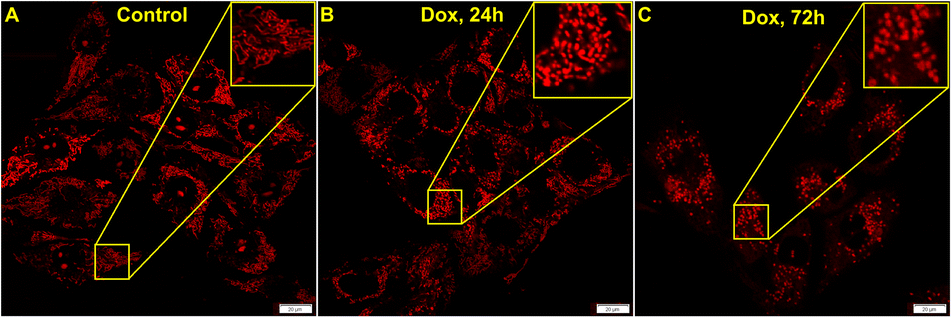
Effect of doxycycline: inhibition of mitochondrial biogenesis
Doxycycline is a well-known inhibitor for mitochondrial protein synthesis that causes a decrease in the mitochondrial energy generating capacity specifically in cancer cells.55 It is also capable of MTX2 depletion in the mitochondrial protein complex. The previous report has shown by gel electrophoresis and western blotting that 14 day doxycycline treatment markedly reduces MTX2 levels in isolated mitochondria.56 Now, as we gather evidence for MTX2 mediated interconnection between mitochondria and nucleolus, we wanted to see if similar results could be achieved by live-cell imaging studies. U-87 MG cells were treated with 100 μg mL−1 doxycycline for 24–72 h and imaged post QR staining. A control study was performed for 72 h without doxycycline treatment and it was evident that mitochondrial morphology remained intact (Fig. S18†). It is to be noted that the treated live cells could not be kept beyond 72 h. However, upon doxycycline treatment, the signal from the nucleolus disappeared (Fig. 6A–C) while mitochondria became gradually fragmented (Fig. 6B and C). Such observation can be attributed to the possibly different levels of MTX2 in these two organelles. Even though more studies are required in different systems and conditions to establish doxycycline as a potent MTX2 depleting agent, we believe our experimental results could be useful to start with.
 |
| | Fig. 6 Confocal microscopy images of U-87 MG cells stained with 5 μM QR show the effect of doxycycline treatment over time. (A) is the control while (B) and (C) are images after 24 h and 72 h of doxycycline treatment, respectively. | |
Inhibition of dynein-based transport to mitochondria
Dynein is the primary motor for fast mitochondrial transport and MTX2 forms the adaptor complex which is responsible for dynein-based transport of mitochondria. As this dynein-driven cellular transport is inhibited by Ciliobrevin D,57 we have measured the mitochondrial velocity before and after Ciliobrevin D treatment in U-87 MG cells. The cells were treated with 20 μM Ciliobrevin D for 4 h and the dynamics of mitochondria in single cells were monitored by a time-lapse experiment for 10 frames with 5 s intervals (Fig. 7A–D). The kymograph analysis revealed that in control cultures, the average velocity of mitochondria was 0.036 μm s−1 as compared to 0.025 μm s−1 in the Ciliobrevin D treated cultures. Now, as we could visualize this phenomenon by QR staining, and considering our earlier experimental results, the binding of QR with mitochondrial MTX2 can be affirmed.
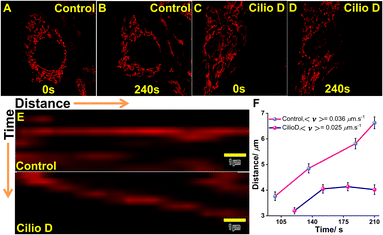 |
| | Fig. 7 Ciliobrevin D inhibits the motility of mitochondria affecting the dynein-based transport mechanism. (A–B) and (C–D) are the images at initial and final time frames of single cells stained with QR for kymograph analysis; (E) kymograph of mitochondrial movement recorded without (above) and with (below) 20 μM Ciliobrevin D treatment for 4 h; (F) plot of mitochondrial motility against time showing decreased velocity after dynein inhibition. | |
Conclusions
In conclusion, we introduce a well-known indicator dye Quinaldine red as a microviscosity sensor and thoroughly investigate its potential to study several cellular homeostatic and non-homeostatic conditions. The spectroscopic investigations show that the emission enhancement caused by the inhibition of ICT in the probe forms a basis for its sensitivity towards micro-environmental viscosity. Notably, the probe was able to sense solvent viscosity over a very wide range from 1.1 to 480.6 cP, which broadens its future bio-imaging applications. Intracellular localization studies in live U-87 MG cells revealed its accumulation in both mitochondria and nucleolus and its permeability remained unperturbed with mitochondrial depolarization. This stable, straightforward, and non-toxic dye may have future applications in effectively quantifying viscosity in the above-mentioned organelles. Moreover, we have monitored and rationalized the enhancement of the microviscosity in both mitochondria and nucleolus during uncoupled oxidative phosphorylation, induced apoptosis, and cell cycle arrest. The probe's ability to sense microviscosity and simultaneous dual-organelle localization were intuitively employed to study the interconnectivity between mitochondria and nucleolus. We have identified a protein, metaxin-2, that is present in the outer mitochondria membrane and the nucleolus, that mediates this connection. Our observations from the inhibition experiments of mitochondrial biogenesis and dynein-based transport are indicative of a metaxin-2 mediated connection. However, further biological studies are underway to consolidate this finding. We anticipate these findings would open up a plethora of directions towards a better understanding of the inter-related behavior of mitochondria and nucleolus and thereby further helping to decipher inter-organelle communications.
Data availability
All supporting data is provided in the ESI.†
Author contributions
TD: Live-cell imaging, data curation, analysis, and manuscript writing; SD: spectroscopic experiments, manuscript writing; IG: proteome analysis and MD simulation; ALK: data curation, project design.
Conflicts of interest
There are no conflicts to declare.
Acknowledgements
We thank the Department of Chemistry and Central Instrumentation Facility at the Indian Institute of Science Education and Research Bhopal (IISERB) for the instrumentation and infrastructural facility. The financial support from IISERB (ALK) and IITD (IG) is gratefully acknowledged. We acknowledge the Department of Science and Technology (DST), INDIA, for the FIST support (SR/FST/LSI-643/2015) for the live-cell imaging facility. We sincerely thank Dr Anirban Bose (Olympus Life Science Solutions) for his kind help in Kymograph analysis. We would also like to thank Mr Bishwambhar Biswas from Regional Center for Biotechnology (RCB), Delhi and Mr Nirmal Singh Mahar and Mr Vipul Kumar from IITD for their help with the molecular dynamics simulation.
References
- R. Bravo-Sagua, N. Torrealba, F. Paredes, P. E. Morales, C. Pennanen, C. Lopez-Crisosto, R. Troncoso, A. Criollo, M. Chiong, J. A. Hill, T. Simmen, A. F. Quest and S. Lavandero, Int. J. Biochem. Cell Biol., 2014, 50, 55–59 CrossRef CAS PubMed
 .
.
- Q. Gao and J. M. Goodman, Front. Cell Dev. Biol., 2015, 3, 1–12 CrossRef .
- P. Lujan, J. Angulo-Capel, M. Chabanon and F. Campelo, Curr. Opin. Cell Biol., 2021, 71, 95–102 CrossRef CAS PubMed .
- J. Xu, Y. Zhang, H. Yu, X. Gao and S. Shao, Anal. Chem., 2016, 88, 1455–1461 CrossRef CAS PubMed .
- L. Scorrano, M. A. De Matteis, S. Emr, F. Giordano, G. Hajnoczky, B. Kornmann, L. L. Lackner, T. P. Levine, L. Pellegrini, K. Reinisch, R. Rizzuto, T. Simmen, H. Stenmark, C. Ungermann and M. Schuldiner, Nat. Commun., 2019, 10, 1–11 CrossRef CAS .
- M. F. Xia, Y. Z. Zhang, K. Jin, Z. T. Lu, Z. Y. Zeng and W. Xiong, Cell Biosci., 2019, 9, 1–19 CrossRef .
- A. Raturi and T. Simmen, Biochim. Biophys. Acta, Mol. Cell Res., 2013, 1833, 213–224 CrossRef CAS PubMed .
- S. W. Tait and D. R. Green, J. Cell Sci., 2012, 125, 807–815 CrossRef CAS PubMed .
- M. C. Rajagopal, J. W. Brown, D. Gelda, K. V. Valavala, H. Wang, D. A. Llano, R. Gillette and S. Sinha, Commun. Biol., 2019, 2, 1–6 CrossRef CAS PubMed .
- J. A. Robson, M. Kubankova, T. Bond, R. A. Hendley, A. J. P. White, M. K. Kuimova and J. D. E. T. Wilton-Ely, Angew. Chem., Int. Ed., 2020, 59, 21431–21435 CrossRef CAS PubMed .
- C. Lee, J. S. Nam, C. G. Lee, M. Park, C.-M. Yoo, H.-W. Rhee, J. K. Seo and T.-H. Kwon, Nat. Commun., 2021, 12, 1–11 CrossRef PubMed .
- S. Wisnovsky, E. K. Lei, S. R. Jean and S. O. Kelley, Cell Chem. Biol., 2016, 23, 917–927 CrossRef CAS PubMed .
- C. Ma, F. Xia and S. O. Kelley, Bioconjug. Chem., 2020, 31, 2650–2667 CrossRef CAS PubMed .
- C. M. Caragine, S. C. Haley and A. Zidovska, eLife, 2019, 8, 1–21 CrossRef .
- M. A. Haidekker and E. A. Theodorakis, Org. Biomol. Chem., 2007, 5, 1669–1678 RSC .
- S. Sasaki, G. P. C. Drummen and G.-i. Konishi, J. Mater. Chem. C, 2016, 4, 2731–2743 RSC .
- R. Tiwari, P. S. Shinde, S. Sreedharan, A. K. Dey, K. A. Vallis, S. B. Mhaske, S. K. Pramanik and A. Das, Chem. Sci., 2021, 12, 2667–2673 RSC .
- J. Zielonka, J. Joseph, A. Sikora, M. Hardy, O. Ouari, J. Vasquez-Vivar, G. Cheng, M. Lopez and B. Kalyanaraman, Chem. Rev., 2017, 117, 10043–10120 CrossRef CAS .
- F. M. Boisvert, S. van Koningsbruggen, J. Navascues and A. I. Lamond, Nat. Rev. Mol. Cell Biol., 2007, 8, 574–585 CrossRef CAS PubMed .
- E. B. Cogan, G. B. Birrell and O. H. Griffith, Anal. Biochem., 1999, 271, 29–35 CrossRef CAS .
- T. Dutta, F. Chandra and A. L. Koner, Spectrochim. Acta, Part A, 2018, 191, 217–220 CrossRef CAS PubMed .
- Q. Cai, C. Wang, J. Zhou, F. Luo, Z. Lin, L. Guo, B. Qiu and G. Chen, Anal. Methods, 2012, 4, 3425–3428 RSC .
- Y. Koyama, P. R. Carey, R. A. Long, W. G. Martin and H. Schneider, J. Biol. Chem., 1979, 254, 10276–10285 CrossRef CAS PubMed .
- M. P. Murphy, Biochim. Biophys. Acta, Bioenerg., 2008, 1777, 1028–1031 CrossRef CAS PubMed .
- N. Jiang, J. Fan, S. Zhang, T. Wu, J. Wang, P. Gao, J. Qu, F. Zhou and X. Peng, Sens. Actuators, B, 2014, 190, 685–693 CrossRef CAS .
- M. K. Kuimova, Phys. Chem. Chem. Phys., 2012, 14, 12671–12686 RSC .
- V. Kaushik, J. S. Yakisich, A. Kumar, N. Azad and A. K. V. Iyer, Cancers, 2018, 10, 1–21 CrossRef CAS PubMed .
- J. T. Zhan, C. Geng, X. Y. Hao, W. H. Song and W. Y. Lin, New J. Chem., 2021, 45, 3778–3782 RSC .
- Y. Liang, Y. Zhao, C. Lai, X. Zou and W. Lin, J. Mater. Chem. B, 2021, 9, 8067–8073 RSC .
- C. E. Ganote and S. C. Armstrong, J. Mol. Cell. Cardiol., 2003, 35, 749–759 CrossRef CAS .
- B. S. Padman, M. Bach, G. Lucarelli, M. Prescott and G. Ramm, Autophagy, 2013, 9, 1862–1875 CrossRef CAS PubMed .
- F. Sivandzade, A. Bhalerao and L. Cucullo, Bio-Protoc., 2019, 9, 1–13 Search PubMed .
- S. Jamil, I. Lam, M. Majd, S. H. Tsai and V. Duronio, Cancer Cell Int., 2015, 15, 1–11 CrossRef CAS .
- A. Jimenez-Sanchez, E. K. Lei and S. O. Kelley, Angew. Chem., Int. Ed., 2018, 57, 8891–8895 CrossRef CAS PubMed .
-
J. D. Esko, C. Bertozzi and R. L. Schnaar, in Essentials of Glycobiology, ed. A. Varki, R. D. Cummings, J. D. Esko, P. Stanley, G. W. Hart, M. Aebi, A. G. Darvill, T. Kinoshita, N. H. Packer, J. H. Prestegard, R. L. Schnaar and P. H. Seeberger, Cold Spring Harbor (NY), 2015, pp. 701–712, DOI:10.1101/glycobiology.3e.055 .
- J. Prives and D. Bar-Sagi, J. Biol. Chem., 1983, 258, 1775–1780 CrossRef CAS PubMed .
- H. Luesch and V. O. Paavilainen, Nat. Prod. Rep., 2020, 37, 717–736 RSC .
- X. Wang, C. O. Eno, B. J. Altman, Y. Zhu, G. Zhao, K. E. Olberding, J. C. Rathmell and C. Li, Biochem. J., 2011, 435, 285–296 CrossRef CAS PubMed .
- X. Han, X. Zhang, H. Li, S. Huang, S. Zhang, F. Wang and Y. Shi, Oncotarget, 2015, 6, 38912–38925 CrossRef .
- X. Zhang, Y. Yuan, L. Jiang, J. Zhang, J. Gao, Z. Shen, Y. Zheng, T. Deng, H. Yan, W. Li, W. W. Hou, J. Lu, Y. Shen, H. Dai, W. W. Hu, Z. Zhang and Z. Chen, Autophagy, 2014, 10, 1801–1813 CrossRef CAS PubMed .
-
The Human Protein Atlas, https://www.proteinatlas.org/ENSG00000128654-MTX2/cell#human Search PubMed .
- J. Lee and S. S. Kim, Exp. Mol. Med., 2009, 41, 765–771 CrossRef CAS PubMed .
- C. Han, L. Jin, Y. Mei and M. Wu, Cell Signal, 2013, 25, 144–149 CrossRef CAS PubMed .
- C. Horigome, T. Okada, K. Matsuki and K. Mizuta, Biosci. Biotechnol. Biochem., 2008, 72, 1080–1086 CrossRef CAS PubMed .
- C. Shirai, T. Takai, M. Nariai, C. Horigome and K. Mizuta, J. Biol. Chem., 2004, 279, 25353–25358 CrossRef CAS PubMed .
- R. Tsujii, K. Miyoshi, A. Tsuno, Y. Matsui, A. Toh-e, T. Miyakawa and K. Mizuta, Genes Cells, 2000, 5, 543–553 CrossRef CAS PubMed .
- G. G. Altmann, J. Cell Sci., 1985, 77, 289–304 CrossRef CAS .
- L. Stenstrom, D. Mahdessian, C. Gnann, A. J. Cesnik, W. Ouyang, M. D. Leonetti, M. Uhlen, S. Cuylen-Haering, P. J. Thul and E. Lundberg, Mol. Syst. Biol., 2020, 16, 1–16 CrossRef PubMed .
- V. Hung, S. S. Lam, N. D. Udeshi, T. Svinkina, G. Guzman, V. K. Mootha, S. A. Carr and A. Y. Ting, eLife, 2017, 6, 1–39 Search PubMed .
- L. C. Armstrong, T. Komiya, B. E. Bergman, K. Mihara and P. Bornstein, J. Biol. Chem., 1997, 272, 6510–6518 CrossRef CAS .
- R. Lister, C. Carrie, O. Duncan, L. H. M. Ho, K. A. Howell, M. W. Murcha and J. Whelan, Plant Cell, 2007, 19, 3739–3759 CrossRef CAS .
- Y. S. Zhao, E. L. Song, W. J. Wang, C. H. Hsieh, X. N. Wang, W. Feng, X. M. Wang and K. Shen, Nat. Commun., 2021, 12, 1–17 CrossRef PubMed .
- X. F. Wang, K. Ono, S. O. Kim, V. Kravchenko, S. C. Lin and J. H. Han, EMBO Rep., 2001, 2, 628–633 CrossRef CAS PubMed .
- S. Elouej, K. Harhouri, M. Le Mao, G. Baujat, S. Nampoothiri, H. Kayserili, N. Al Menabawy, L. Selim, A. L. Paneque, C. Kubisch, D. Lessel, R. Rubinsztajn, C. Charar, C. Bartoli, C. Airault, J. F. Deleuze, A. Rotig, P. Bauer, C. Pereira, A. Loh, N. Escande-Beillard, A. Muchir, L. Martino, Y. Gruenbaum, S. H. Lee, P. Manivet, G. Lenaers, B. Reversade, N. Levy and A. De Sandre-Giovannoli, Nat. Commun., 2020, 11, 1–15 CrossRef .
- C. Scatena, M. Roncella, A. Di Paolo, P. Aretini, M. Menicagli, G. Fanelli, C. Marini, C. M. Mazzanti, M. Ghilli, F. Sotgia, M. P. Lisanti and A. G. Naccarato, Front. Oncol., 2018, 8, 1–8 CrossRef .
- V. Kozjak-Pavlovic, K. Ross, N. Benlasfer, S. Kimmig, A. Karlas and T. Rudel, EMBO Rep., 2007, 8, 576–582 CrossRef CAS PubMed .
- D. Roossien, K. Miller and G. Gallo, Front. Cell. Neurosci., 2015, 9, 1–10 Search PubMed .
|
| This journal is © The Royal Society of Chemistry 2022 |
Click here to see how this site uses Cookies. View our privacy policy here. 
 Open Access Article
 This Open Access Article is licensed under a Creative Commons Attribution-Non Commercial 3.0 Unported Licence
 a,
Sreeparna
Das
a,
Ishaan
Gupta
b and
Apurba Lal
Koner
a,
Sreeparna
Das
a,
Ishaan
Gupta
b and
Apurba Lal
Koner