
 Open Access Article
 This Open Access Article is licensed under a
 Creative Commons Attribution 3.0 Unported Licence
Charge storage mechanisms of a π–d conjugated polymer for advanced alkali-ion battery anodes†
Roman R.
Kapaev
 *a,
Andriy
Zhugayevych
ab,
Sergey V.
Ryazantsev
a,
Dmitry A.
Aksyonov
a,
Daniil
Novichkov
c,
Petr I.
Matveev
c and
Keith J.
Stevenson
a
*a,
Andriy
Zhugayevych
ab,
Sergey V.
Ryazantsev
a,
Dmitry A.
Aksyonov
a,
Daniil
Novichkov
c,
Petr I.
Matveev
c and
Keith J.
Stevenson
a
aCenter for Energy Science and Technology, Skolkovo Institute of Science and Technology, Bolshoy Boulevard 30 bld. 1, Moscow, 121205, Russia. E-mail: roman.kapaev@skoltech.ru
bPolymer Theory Department, Max Planck Institute for Polymer Research, Ackermannweg 10, Mainz, 55128, Germany
cDepartment of Chemistry, Lomonosov Moscow State University, Leninskie Gory 1/3, Moscow, 119991, Russia
First published on 29th June 2022
Abstract
The demand for fast-charging metal-ion batteries underlines the importance of anodes that work at high currents with no risk of dendrite formation. NiBTA, a one-dimensional Ni-based polymer derived from benzenetetramine (BTA), is a recently proposed promising material for safe fast-charging batteries. However, its charge–discharge mechanisms remained unclear and controversial. Here we solve the controversies by providing the first rigorous study using a combination of advanced theoretical and experimental techniques, including operando and ex situ X-ray diffraction, operando Raman spectroscopy and ex situ X-ray absorption near-edge spectroscopy (XANES). In safe potential ranges (0.5–2.0 V vs. M+/M, M = Li, Na or K), NiBTA offers high capacities, fast charge–discharge kinetics, high cycling stability and compatibility with various cations (Li+, Na+, K+). In the Na- and K-based cells, fast bulk faradaic processes are manifested for partially reduced states. Atomistic simulations explain the fast kinetics by facile rotations and displacements of the macromolecules in the crystal, opening channels for fast ion insertion. The material undergoes distinct crystal structure rearrangements in the Li-, Na- and K-based systems, which explains different electrochemical features. At the molecular level, the charge storage mechanism involves reversible two-electron reduction of the repeating units accompanied by a change of the absorption bandgap. The reversible reduction involves filling of the orbitals localized at the ligand moieties. No reduction of NiBTA beyond two electrons per repeating unit is observed at potentials down to 0 V vs. M+/M.
1. Introduction
Development of fast-charging metal-ion batteries is crucial for solving the “range anxiety” issue of electric vehicles that impedes their mass-market adoption.1–3 Unfortunately, conventional graphite anodes are unsuitable for fast charging because of hazardous dendrite formation at low potentials.4–6 High-rate capabilities can be enabled with anode materials operating in safe potential ranges (∼0.5–2.0 V vs. Li+/Li). The most popular example is Li4Ti5O12 (LTO), which has been employed in commercial fast-charging batteries.7 However, it has a limited capacity (∼175 mA h g−1) and a high delithiation potential (∼1.6 V vs. Li+/Li), which decreases the battery energy density.1,7 Research on next-generation anodes for fast-charging Li-ion batteries needs a breakthrough. It is even more desired for Na- and K-ion batteries, devices that are currently underdeveloped but are potentially more sustainable since they contain no rare lithium.8–10Coordination polymers with π–d conjugation11 have recently started to emerge as energy storage materials.12–17 An attractive representative is NiBTA, a Ni-based polymer derived from benzenetetramine (BTA), which is a commercially available and relatively stable ligand (Fig. 1a).16 However, studies of NiBTA have been scarce, unsystematic and controversial, and its charge storage mechanisms have remained unclear. Initially,16 two-electron reduction of the ligands was proposed for lithium-based cells in the potential range of 0.8–2.0 V vs. Li+/Li, accompanied by irreversible NH-proton substitution by Li+ ions. For a broader range of 0.005–3.0 V vs. Li+/Li, it was supposed that two-electron reduction of the ligands was followed by reduction of Ni2+ to Ni0, and no NH-proton substitution occurred.14 However, the experimental capacity (∼1200 mA h g−1) was higher than theoretical one for the four-electron reduction (556 mA h g−1). For sodium-based cells, it was suggested that the two-electron reduction of the ligands was followed by transition of Ni2+ to Ni+ in the 0.01–2.5 V vs. Na+/Na range, without further reduction to Ni0.15 For potassium-based cells, the two-electron reduction without NH-proton substitution was proposed in the 0.5–2.0 V vs. K+/K range.17
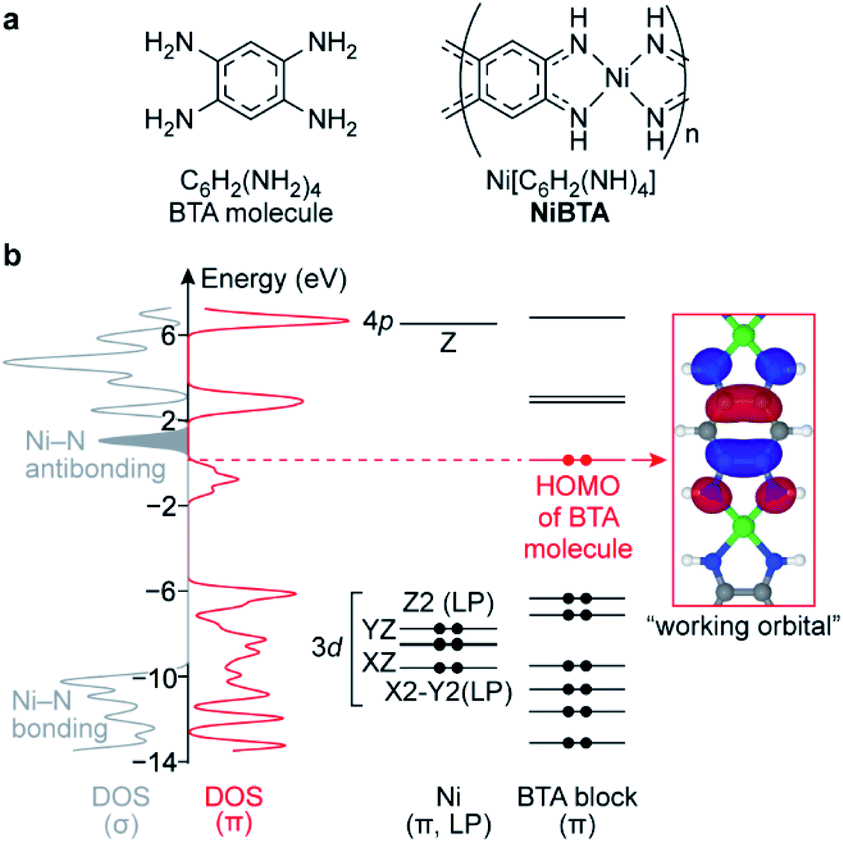 | ||
| Fig. 1 (a) Formulas of BTA molecule and NiBTA and (b) electronic structure of NiBTA. The electronic structure is partitioned into σ- and π-systems. The π-system is further decomposed into LMOs of Ni and BTA blocks. Density of Ni lone pairs (LPs) is excluded from DOS (σ). Ni LMOs are labeled by harmonic polynomials corresponding to the orbital symmetry, 3d and 4p labels are added for clarity. Electrons in BTA and Ni diagrams are shown as dots. The red dots correspond to electrons of BTA that are absent in the ligand moieties of NiBTA. 3dXY, 4s, 4pX and 4pY orbitals of Ni are highly intermixed with other orbitals into σ-bands and are not shown here. | ||
Suggestions about the mechanisms were made basing mainly on ex situ techniques, such as X-ray photoelectron spectroscopy (XPS), or indirect observations. These experimental data were ambiguous and could not give detailed information about the mechanisms. This work provides rigorous insight into the structure of NiBTA and its evolution upon charge–discharge, which was made possible by using a set of complementary experimental and theoretical methods. This is the first detailed and systematic study for π–d conjugated polymers applied in energy storage devices.
2. Results and discussion
2.1. Electronic structure
In the lowest-energy conformation, NiBTA macromolecules are planar and remain nearly planar after reduction with up to two electrons per repeating unit (Fig. S1†). The planarity allows to separate electronic σ- and π-systems. Since electronic π-couplings between the Ni and the ligand blocks are weak (Table S1†), the π-system can be further decomposed into molecular orbitals localized at Ni and at the ligands.18,19 These localized molecular orbitals (LMOs, Table S2†) constitute molecular orbitals (MOs) of the polymer with a minor distortion of their shapes. Band structure analysis (Fig. S3†) reveals that the wavefunction pattern weakly depends on the k-vector, making the LMOs easily distinguishable. The density functional theory (DFT) analysis is summarized in Fig. 1, where the σ-system is presented by its density of states (DOS), whereas the π-system is presented by its DOS and individual LMO levels.The frontier MOs of NiBTA (Fig. S5†) are composed mainly from the LMOs of BTA (Fig. S6†). The highest occupied molecular orbital (HOMO) of BTA molecule is empty in NiBTA. It suggests redox-activity of the ligand moieties of NiBTA upon two-electron reduction. Calculations for the reduced polymer confirm this mechanism. Five occupied Ni d-orbitals (two π-conjugated, two lone pairs and Ni–N bonding MOs) lay deep in the valence band. According to population analysis (Table S5†), these orbitals remain inactive (i.e., have only slight change of occupation) upon charge–discharge. Instead, by analogy with π-backbonding, Ni donates two electrons in four σ-bonds but withdraws these two electrons back from the ligand π-system.
If a formal charge at Ni was +2, its 3dXY orbital would be empty. However, the calculations show that occupation of this deep-laying orbital is 0.8, while total occupation of Ni σ-orbitals is 1.5, much closer to two than to zero (Tables S7 and S8†). Therefore, electronic configuration of nickel is better described by a formal oxidation state of zero rather than +2, which was assigned to it previously.14,15,17,20 This seemingly counterintuitive zero oxidation state stresses that the redox processes for NiBTA are ligand-based, because supposed transformations of “Ni(II)” to “Ni(I)” or “Ni(0)” lose meaning.
Above the bandgap, there are Ni–N antibonding orbitals located next to the band of the lowest unoccupied molecular orbitals (LUMO). Consequently, adding more than two electrons per repeating unit should weaken Ni–N bonds, resulting in a structural degradation or restructuring of the polymer.
For doping levels between zero and two electrons per repeating unit, the fully periodic polymer is a strongly correlated electronic system. Detailed understanding of these states requires development of a higher level of theory that is beyond the scope of this work.
2.2. Behavior in the potential ranges of 0.5–2.0 V vs. M+/M
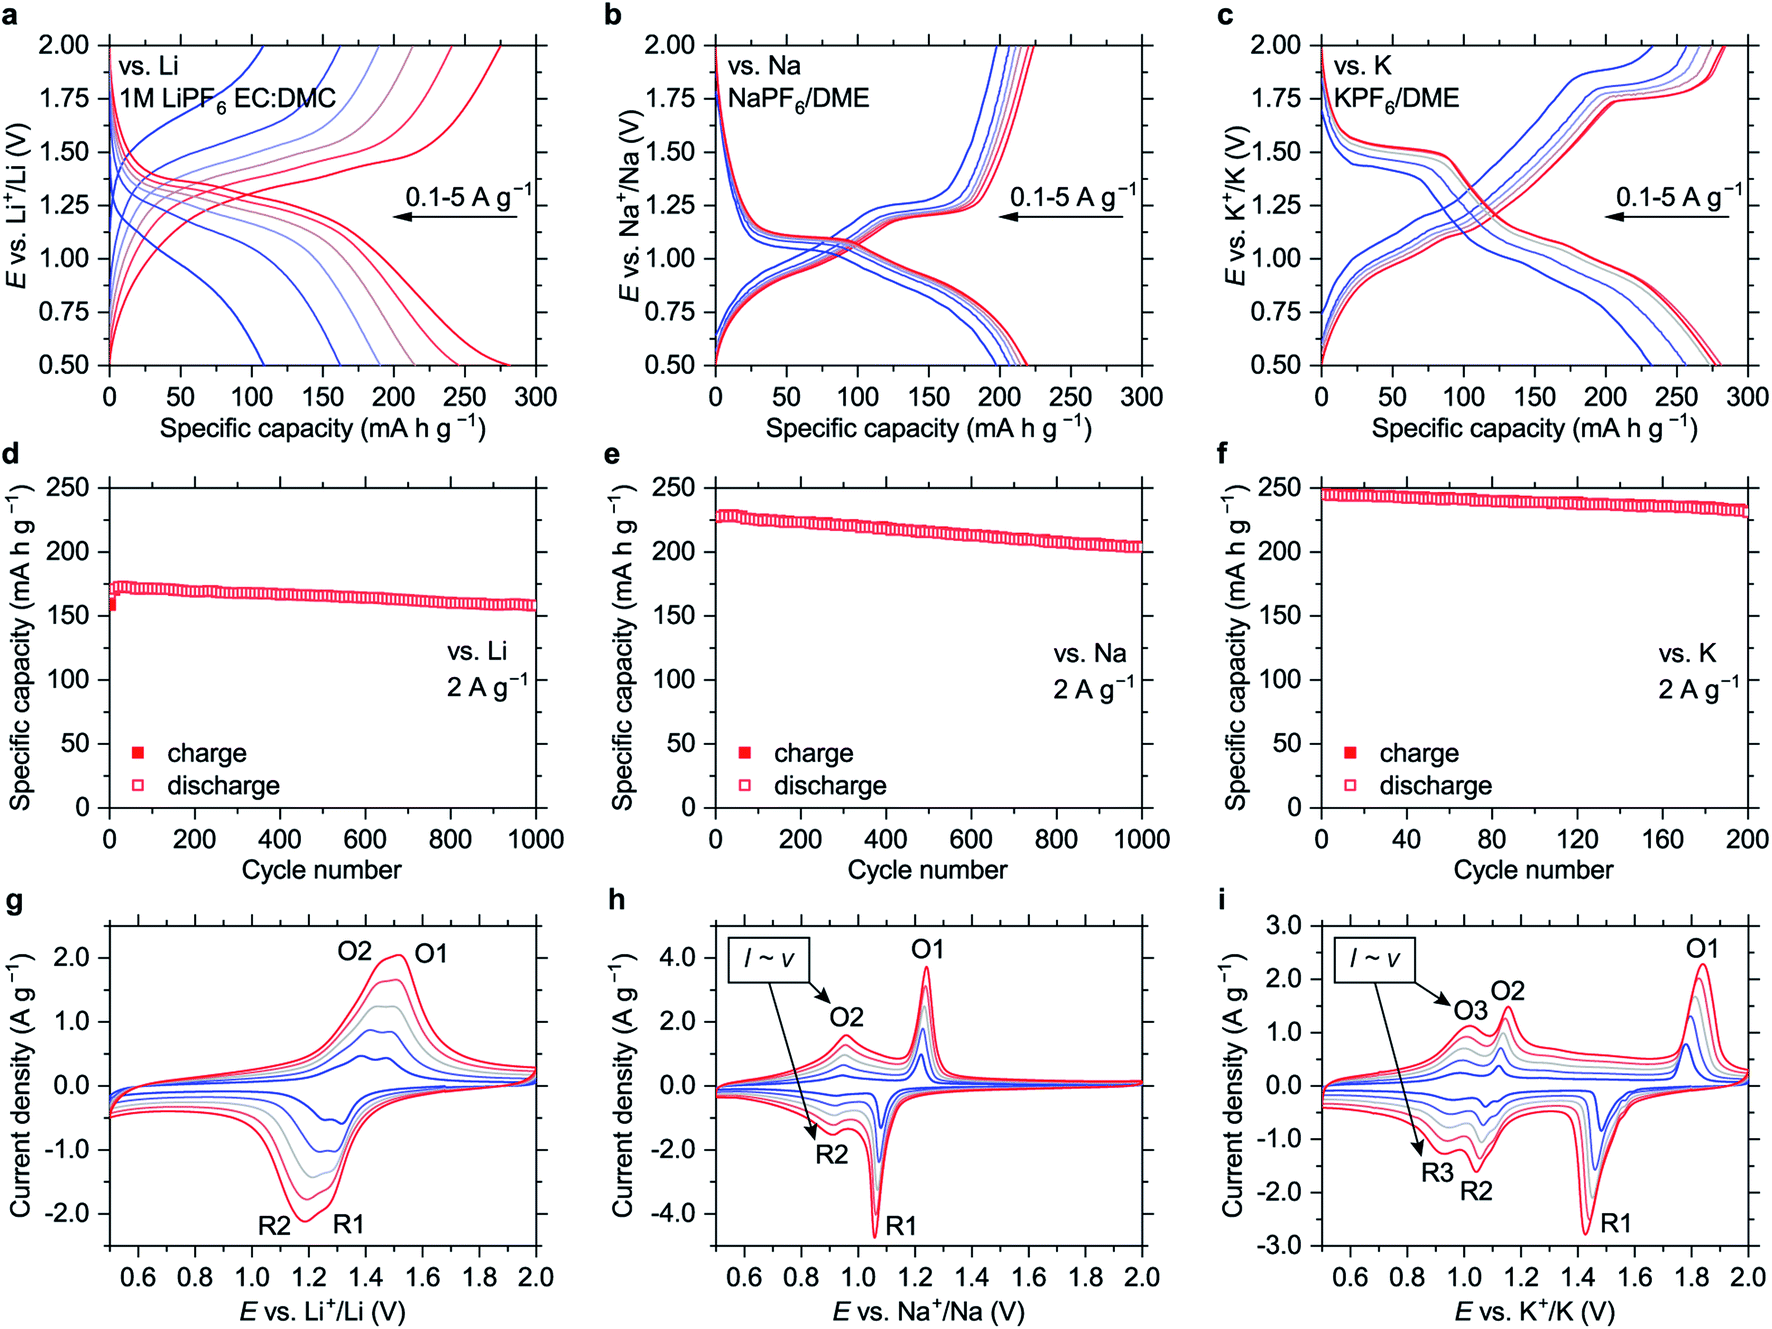 | ||
| Fig. 2 Electrochemistry of NiBTA in the 0.5–2.0 V vs. M+/M potential ranges: (a–c) charge–discharge curves at 0.1, 0.2, 0.5, 1, 2, 5 A g−1; (d–f) cycling performance at 2 A g−1; (g–i) CV profiles measured at scan rates of 0.2, 0.4, 0.6, 0.8 and 1 mV s−1 (higher currents correspond to higher scan rates). Peaks where the current linearly depends on the scan rate are indicated in (h) and (i). Data for the Li-, Na- and K-based cells are shown in (a, d, and g), (b, e, and h) and (c, f, and i), respectively. Prior to the CV experiments, ten scans at 1 mV s−1 were carried out to eliminate irreversible processes. | ||
The material shows high-rate capabilities at the current densities of up to 5 A g−1 (Fig. 2 and S18†). For lithium-based cells, the high-rate performance can be further improved via electrolyte optimization (Fig. S19†). The capacity fade at 2 A g−1 (Fig. 2d–f) is 0.005%, 0.011% and 0.028% per cycle for the Li-, Na- and K-based cells, respectively.
The polymer might be considered a promising alternative to LTO. As an anode material for Li-ion batteries that operates at safe redox potentials, it has ∼1.5 times higher specific capacity and lower average delithiation potential (1.35 V vs. ∼1.6 V for LTO). It also features fast charge–discharge kinetics and high cycling stability. In contrast to LTO,21 NiBTA is universally applicable for safe fast-charging Li-, Na- and K-ion batteries.
Cyclic voltammograms (CVs, Fig. 2g–i) reveal distinct features for different cations. CV peak profiles for the Li-based cell are typical for diffusion-controlled insertion.22 For the Na- and K-based systems, the features at higher potentials (O1/R1) are sharp and have a pronounced potential gap, indicating nucleation control.22 The features at lower potentials (O2/R2 for the Na-based cells and O3/R3 for the K-based cells) have small peak-to-peak separations (<30 mV at 0.2 mV s−1, Fig. S20†) and broad profiles, which are attributes of pseudocapacitive processes.23 Another indicator of pseudocapacitance is almost linear dependence of the peak current on the potential scan rate (Fig. S21†).23
If this pseudocapacitance was surface-confined, the O1/R1 features would have pseudocapacitive features or much higher integral intensities. However, the O1/R1 peaks have a signature of “battery-like” bulk processes, and the capacities of the high- and low-potential regions are comparable (Fig. 2b and c). Therefore, it appears that intercalation pseudocapacitance phenomena,23i.e., fast bulk faradaic reactions, take place at low potentials in the Na- and K-based systems. Supposedly, initial portions of Na+ or K+ ions that insert into NiBTA act as “pillars”, expanding the structure and creating more open channels for fast diffusion of additional ions.
In the 0.5–2.0 V potential ranges, the capacities of NiBTA are close to the theoretical capacity for two-electron reduction (278 mA h g−1). It can be proposed that the “quinoid” forms of the ligands are reduced into “hydroquinoid” moieties, similarly to the organic quinones.24–26 In terms of the electronic structure, it corresponds to filling the “working orbital” of the ligands (see Section 2.1). However, this process typically gives two sets of peaks in the CV profiles, which is not the case for the K-based system (Fig. 2i).
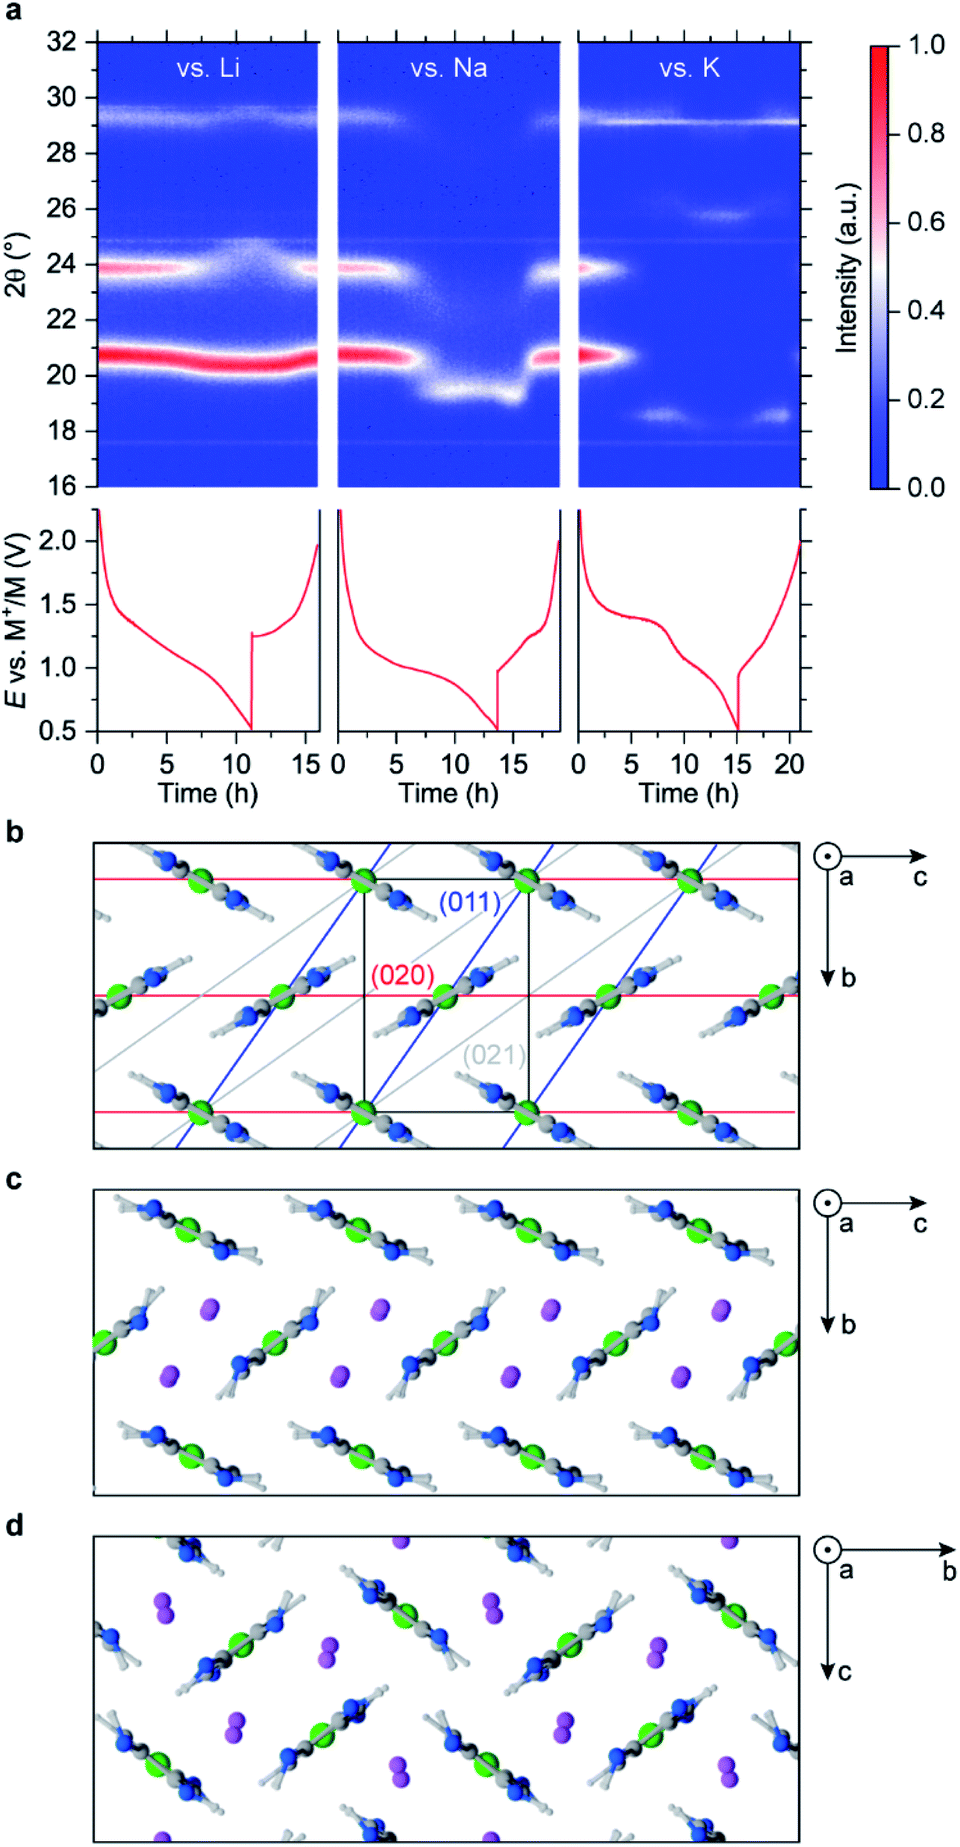 | ||
| Fig. 3 NiBTA crystal structure and its evolution: (a) operando XRD upon charging–discharging in Li-, Na- and K-based cells; (b) simulated crystal structure of NiBTA, shown with planes having the strongest XRD signals; (c) herringbone-type and (d) square-channeled polymorphs of fully lithiated NiBTA. Charge–discharge profiles are shown in (a) below the XRD intensity maps, time axis is common for the upper and lower plots; a narrow signal at 2θ of 29° for the K-based cell corresponds to potassium fluoride. Simulated lattices of sodiated and potassiated NiBTA are isostructural to the lithiated analogs. | ||
XRD patterns of pristine and reduced materials contain only a few broad peaks (Fig. S26–S30†), making the data ambiguous. To identify the crystal structures precisely, large crystals of NiBTA should be obtained, which is a subject of further study. To investigate the structure on the atomistic level, we performed modeling with dispersion-corrected DFT (DFT-D).
Among reasonable crystals with up to two monomers per unit cell (Fig. S23, S24, Tables S9 and S10†), the calculations show that a herringbone structure (Fig. 3b) is the lowest-energy polymorph of NiBTA, in agreement with the previous studies.15,28 Theoretical density of this structure is 2.16 g cm−3, while the experimental value for a pellet is 1.84 g cm−3. π-Stacking motifs (Fig. S24†), which were previously proposed for NiBTA,20 are energetically unfavorable. The lowest-energy π-stacked polymorph is 0.2 eV higher in energy and transforms into a herringbone structure within picoseconds in molecular dynamics (MD) simulations at room temperature.
Sliding of the macromolecules along each other in the herringbone crystal has a low activation barrier (up to 0.1 eV per monomer for the two-monomer cell, see Table S10†). Consequently, macromolecule positions along axis a are not fixed at room temperature. The pattern is robust only in plane bc, which explains why all intensive XRD peaks correspond to planes parallel to axis a (Table S11†). Sliding of the macromolecules broadens the XRD peaks and diminishes signals from planes that are not parallel to axis a (Fig. S26†).
Lithium ions are expected to insert in between (011) planes since the corresponding XRD peak (2θ ∼21°) remains strong but shifts to lower angles. At the same time, structural deformations that decrease the ordering of (020) planes are likely occurring, leading to weakening of the corresponding XRD peak. Several configurations were considered, including one consistent with the original crystal symmetry and another one where Li+ ions align with (011) planes (Table S10†). After relaxation with DFT-D, the first configuration is inconsistent with the XRD data (Fig. S28†) and substantially higher in energy than the second configuration (Table S10†). The resulting optimal herringbone structure (Fig. 3c) contains wide channels for Li+ ion diffusion. Alternative low-energy arrangements of the channels exist, including the square-shape tiling (Fig. 3d). There is also a π-stacked lithiated structure that is slightly lower in energy than the channeled structures (Fig. S25†). However, these structures likely do not form because of kinetic barriers required for the rearrangements of the herringbone structure. Simulated XRD pattern of the π-stacked structure poorly matches the experiment (Fig. S28†).
Larger alkaline ions deform the initial herringbone motif substantially (Fig. S25†), whereas the π-stacked configuration becomes energetically unfavorable. For Na+ ions, both herringbone and square-channeled polymorphs remain to have nearly the same energy (Table S10†). For K+ ions, the square-shape arrangement of the channels has substantially lower energy than other considered structures (Table S10†).
Qualitatively, the considered atomistic models are consistent with the observed XRD data. Upon K+ insertion, the main peak moves to lower angles, and the 24° peak disappears. However, the emerging peak at 26° for the K-based system is missing in these models, indicating another restructuring.
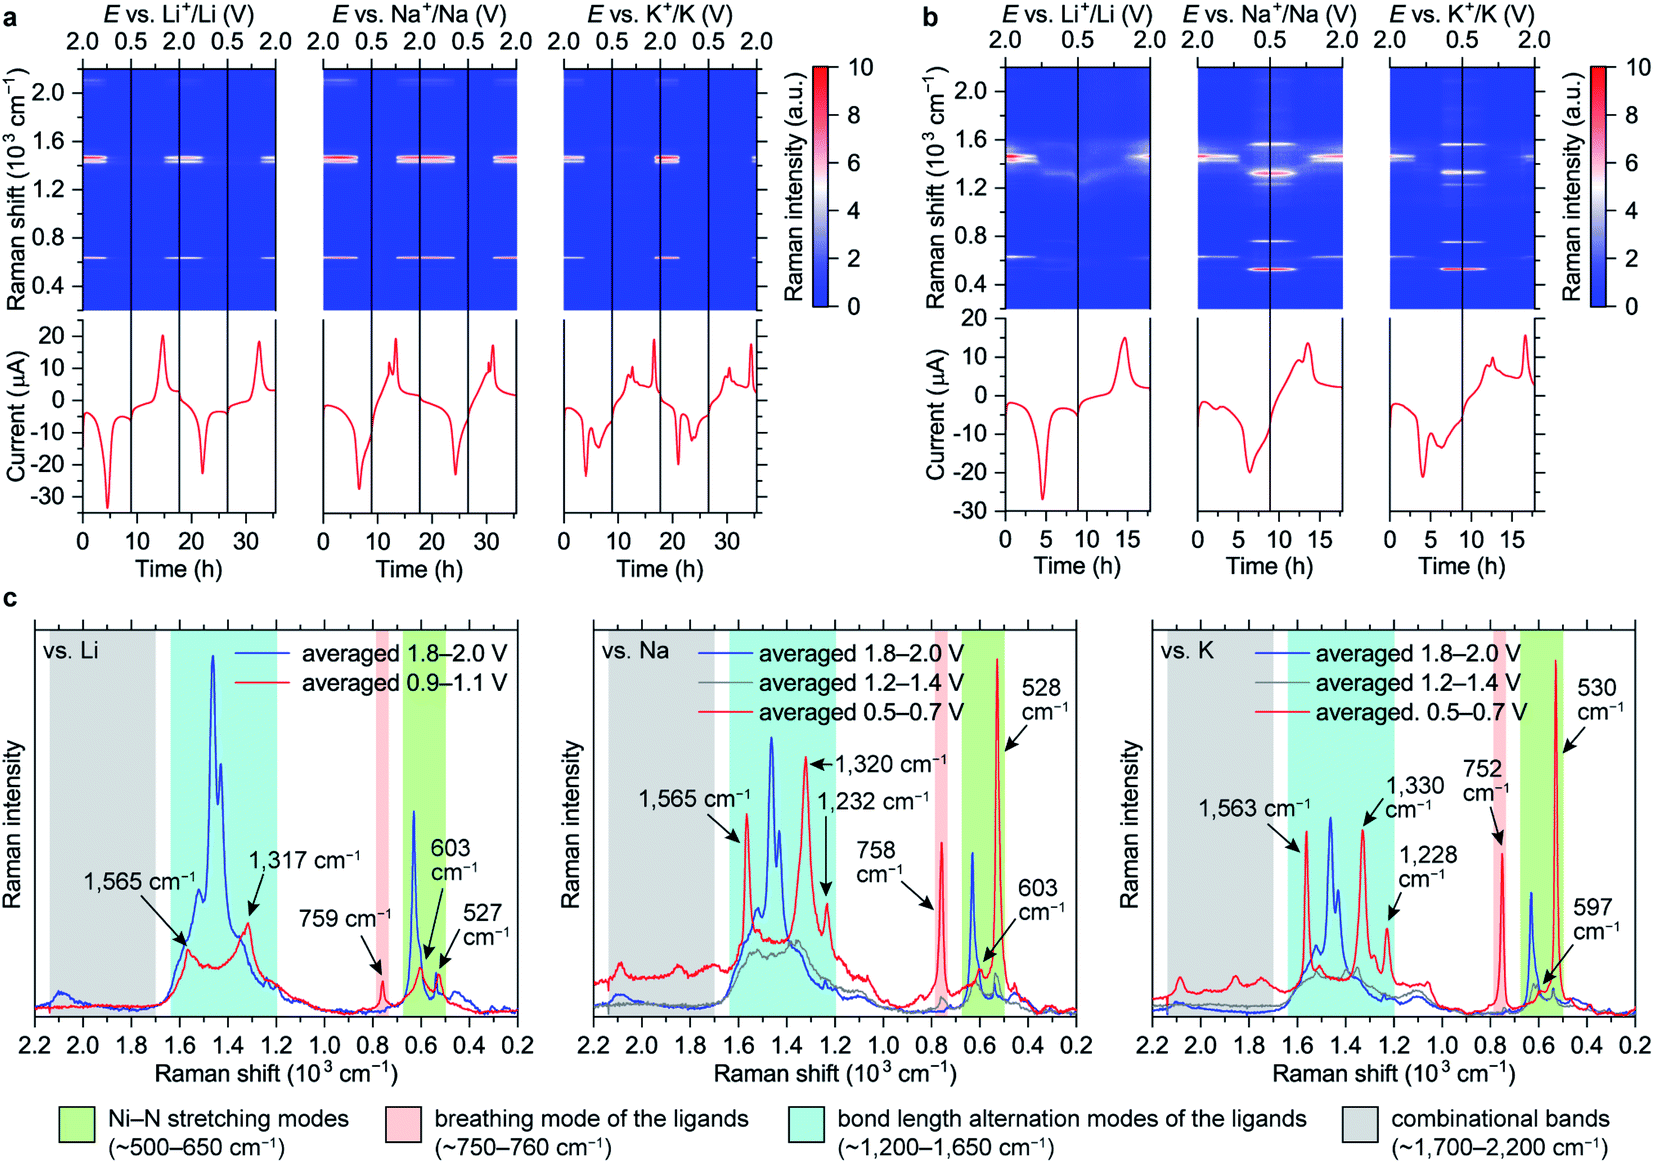 | ||
| Fig. 4 Evolution of Raman spectra of NiBTA in the 0.5–2.0 V vs. M+/M potential ranges: Raman intensity maps and current vs. time (vs. potential) profiles for the measurements with (a) the near-infrared and (b) the green lasers; (c) averaged Raman spectra for selected potential ranges during the initial discharge. The spectra in (c) were measured with the excitation wavelength of 532 nm; characteristic band regions are indicated. | ||
Raman intensity of the reduced states increases with the green laser (λ = 532 nm, Fig. 4b and c). Spectra of the fully lithiated, sodiated and potassiated states have similar patterns, indicating that the charge storage mechanisms are similar at the molecular level. This confirms that appearance of the third set of CV peaks for the K-based cells (Fig. 2i) is caused by an additional phase transition rather than some unusual extra reduction which does not occur in the Li- and Na-based batteries. Observed variability of both Raman shifts and intensities should be associated with the differences of local environments of the macromolecules.
Since NiBTA is a narrow-gap semiconductor that absorbs near-infrared light,20 its resonance Raman spectra31 should be measured when the near-infrared laser (λ = 780 nm) is selected. The substantial decrease of the infrared Raman intensities upon reduction might be an indicator of the bandgap increase, which leads to deviation from the resonance condition.
To better understand the electronic structure evolution, UV-Vis-NIR spectra were acquired. While there are no issues with measuring pristine NiBTA, studying the reduced states is more challenging. Measurements of the discharged electrodes can give ambiguous results because of absorption by carbon black,32,33 and separating contributions from the two materials correctly is challenging. Electrochemical reduction of NiBTA without conductive fillers is problematic because of its low electronic conductivity, which for a pellet is 2.0 × 10⁻⁷ S cm−1 at room temperature (Fig. S37†). For this reason, chemical reduction of NiBTA films was carried out using excessive amount of potassium naphthalenide. Naphthalenides have low oxidation potentials of ∼0.5 V vs. Li+/Li,34 which makes them suitable for two-electron reduction of NiBTA. This approach has recently been shown applicable for a wide range of materials.35–37 Raman spectrum of NiBTA after treatment (Fig. S38†) is nearly identical to the spectrum of the fully potassiated material in the operando experiment, which confirms successful reduction.
As shown in Fig. 5, pristine NiBTA has a broad absorption feature with the high-energy threshold near 600 nm and a maximum at ∼950 nm. Substantial absorption is observed at 780 nm, which should induce resonance Raman effect at this wavelength. After the reduction, this absorption band disappears, and the spectrum shows a broad absorption feature with a low-energy threshold near 800 nm and a maximum in the UV region. Observed changes of the UV-Vis-NIR spectra agree with the theoretical predictions (Fig. S39 and S40†).
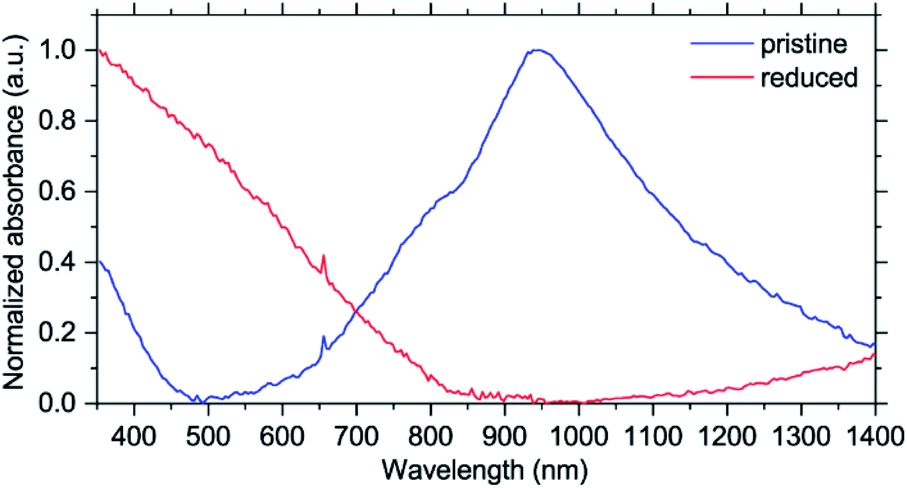 | ||
| Fig. 5 UV-Vis-NIR spectra of NiBTA in pristine and fully reduced states. | ||
The Ni–N stretching modes (∼500–650 cm−1 range) are well-separated in frequency from the ligand modes due to a large mass of Ni atoms. In the reduced state, the intensity of the peaks at lower frequencies increase, which is consistent with the experiment (Fig. S41†). The experimentally observed peaks have high relative intensity and are narrow, suggesting that NiN4 blocks are not twisted (twisted conformations should have different frequencies and lower intensity) and Ni–N bonds are strong (antibonding orbital remains empty).
Bond-stretching modes of the ligands are grouped in two bands. The lower-frequency band (∼750 cm−1) corresponds to a breathing mode. Since it mainly involves stretching of the two vertical C–C bonds, this mode is highly sensitive to occupation of the “working” LMO which electronic density is concentrated at these bonds (see Fig. 1). HOMO of the pristine material has zero density at the vertical C–C bonds, so the Raman signal is below detectability. For the fully reduced material, LUMO density involves these bonds, so the signal is strong. The higher-frequency band corresponds to bond-length alternation modes in a broad frequency range (∼1200–1700 cm−1). DFT calculations of oligomers (Fig. S41†) show multiple peaks in this range for both pristine and reduced forms, with broader distribution of frequencies for the reduced form, which is in accordance with the experiment.
 | ||
| Fig. 6 (a) XANES spectra of NiBTA-based electrodes in pristine and reduced (0.5 V vs. M+/M) states compared to Ni foil; insets: first derivatives of the XANES spectra; (b) estimated energies of XANES absorption edges. Error bars in (b) are set as halves of the energy increments during the measurement scans, which were 1 eV. | ||
The observed ∼2 eV shift was previously interpreted as transition from Ni(II) to Ni(I),15 basing on the literature for some inorganic compounds which proposes a linear dependence between the edge energy and oxidation state.38–40 However, the edge energy can vary remarkably if the ligand structure is changed, even if the formal oxidation state of a metal remains the same.41–43 In other words, there is no single equation for all nickel compounds linking the oxidation state with the edge energy. Moreover, the absorption edge energies for NiIIO and NiII(OH)2 are shifted by ∼12–13 eV compared to metallic nickel,44,45 proposing a much larger ∼6 eV shift for one-electron reduction of Ni(II) if the linear dependence is assumed.
To study how the charge distribution changes upon reduction of NiBTA, natural atomic charges were calculated for various oligomeric models (see Table S6†). These calculations show that the effective charge at Ni is +0.54 in pristine NiBTA, which decreases to +0.23 after two-electron reduction of the repeating units (Fig. 7). The same trends are revealed by analyzing Bader charges (Table S13†) and differential charge distribution maps (Fig. S42†) calculated for crystal structures. Although the absolute change for Ni is low, the relative change is nearly two-fold, which is in good agreement with the observed shifts of the absorption edges (Fig. 6b) if linear interpolation is applied.
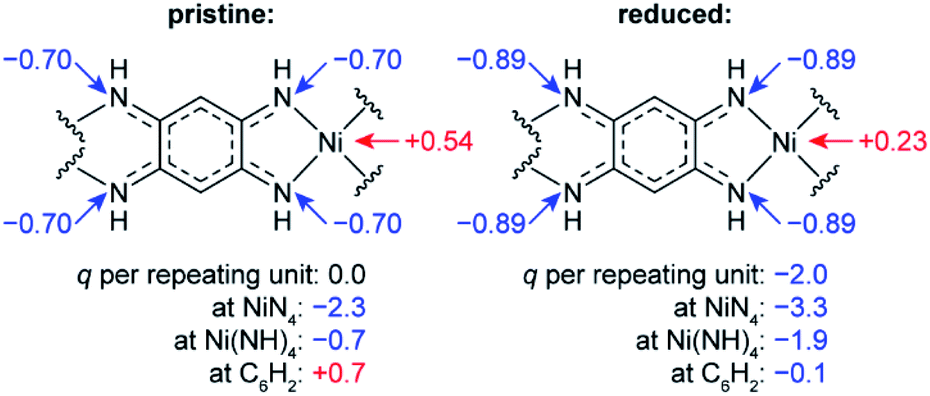 | ||
| Fig. 7 Calculated natural charges (q) at Ni, N atoms and selected structural units in NiBTA before and after two-electron reduction of the repeating units. See Table S6† for details. | ||
Overall, the XANES data agree with the computations, showing that the effective charge at nickel decreases upon reduction. However, conclusion about the two-electron reduction of the ligands is still valid in terms of formal oxidation states since Ni and BTA contributions are well-separated, and the orbitals localized at Ni are only marginally involved in the redox processes (see Section 2.1).
2.3. Behavior in the potential ranges of 0.01–2.0 V vs. M+/M
Although operation of NiBTA in the 0.5–2.0 V vs. M+/M ranges is safer compared to deep cycling (0.01–2.0 V vs. M+/M), going below 0.5 V could be beneficial for increasing the battery energy density. Additionally, structure evolution of NiBTA at low potentials remained unclear. For these reasons, we explored the electrochemistry and structure of NiBTA during cycling in the 0.01–2.0 V vs. M+/M ranges.As expected, broadening the potential ranges leads to an increase of the capacity per NiBTA mass unit at low currents (0.1 A g−1). The boost is relatively minor for the Na- and K-based cells: after subtracting the contributions from carbon, the reversible capacities stabilize at ∼300–330 mA h g−1 (Fig. S43†). The charge–discharge profiles remain basically the same as for cycling in the 0.5–2.0 V vs. M+/M ranges. For the Li-based cells, however, drastic changes are observed (Fig. S44†). Initial reversible capacity exceeds 1000 mA h g−1 at 0.1 A g−1. After the initial lithiation, the plateau at ∼1.2–1.5 V disappears from the discharge profiles. The capacity rapidly decays during five cycles.
Surprisingly, almost no changes of the Raman spectra are seen between 0.5 and 0.01 V vs. M+/M for all types of cells (Fig. 8a and S45†). Furthermore, there are virtually no shifts of the XRD peaks associated with NiBTA reduction products (Fig. 8b). Ex situ XRD patterns of the NiBTA-based electrodes after lithiation/sodiation to 0.5 V and 0.01 V are nearly identical. For the potassiated electrodes, the only major difference is presence of the peaks of potassium methoxide after deep reduction, which should be due to the electrolyte decomposition at low potentials. Ex situ XANES also shows that there is no major difference between the electrodes reduced to 0.5 and 0.01 V (Fig. 8c).
 | ||
Fig. 8 (a) Raman spectra, (b) XRD patterns and (c) XANES spectra of NiBTA-based electrodes reduced to 0.5 and 0.01 V vs. M+/M; insets in (c): first derivatives of the XANES spectra; (d) HAADF-STEM and EDX mapping images for NiBTA-based electrodes in pristine and deeply lithiated (0.01 V vs. Li+/Li) states (upper and lower images, respectively); (e) images of the separator and Li electrode from the NiBTA-based cell after five cycles in 0.01–2.0 V vs. Li+/Li range at 0.1 A g−1 (the electrolyte was 1 M LiPF6 in a 1![[thin space (1/6-em)]](https://www.rsc.org/images/entities/char_2009.gif) :1 v/v mixture of ethylene carbonate and dimethyl carbonate). XRD peaks corresponding to sodium fluoride, potassium fluoride and potassium methoxide are indicated in (b). :1 v/v mixture of ethylene carbonate and dimethyl carbonate). XRD peaks corresponding to sodium fluoride, potassium fluoride and potassium methoxide are indicated in (b). | ||
According to theory (see Section 2.1), NiBTA reduction beyond two electrons per repeating unit leads to Ni–N bond weakening, which should eventually result in the material decomposition. It is expected that decomposition of a coordination polymer results in detachment of the ligands from the transition metal and dissolution of organic moieties.46 However, no evidence of such decomposition is observed according to EDX mapping with sub-nanometer resolution, which shows that Ni and N remain in a single phase (Fig. 8d). Additionally, post-mortem analysis of the Li-based cells after deep cycling reveals no signs of the material dissolution since there is no coloring of the separator and lithium surface remains shiny (Fig. 8e).
Overall, the presented study shows strong evidence that NiBTA accepts only two electrons per repeating unit, and no further reduction occurs even at ∼0 V vs. M+/M. Therefore, the capacity higher than the theoretical one (278 mA h g−1) is unrelated to the intrinsic chemistry of NiBTA.
Nature of the extra capacity (especially for the Li-based cells) is unclear and is a subject of further studies. It could be supposed that this phenomenon is related to reversible electrolyte reduction catalyzed by reduced NiBTA,47,48 as suggested by an increased content of oxygen in the lithiated electrode compared to pristine and reoxidized states (Fig. S47†). However, it is surprising that the electrochemical output is similar for entirely different electrolyte compositions (Fig. S44†). Other reasons can include capacitive processes and charge storage in defects.48 However, these factors are not expected to increase the capacity dramatically, so this explanation is suitable for the Na- and K-based cells but not for the Li-based systems.
Using operando Raman spectroscopy, we studied the reasons of the rapid capacity fade in the Li-based cells during the deep cycling. It was previously suggested that this fast decay is related to decomposition of NiBTA upon deep reduction.14 However, the data show that no decomposition of lithiated NiBTA (Li2NiBTA) takes place. Instead, it is seen that conversion to the initial NiBTA phase upon reoxidation is incomplete, as follows from the spectra at 2.0 V after cycling (Fig. S45 and S46†). It indicates that the capacity fade is caused by hindered kinetics that leads to increased overpotentials. This could be due to formation of electrolyte decomposition products that impede diffusion or charge transfer. For the Na- and K-based cells, all changes in the Raman spectra are fully reversible (Fig. S45†), in accordance with their electrochemical output.
2.4. Comparison with previously proposed mechanisms
Overall redox reaction scheme for NiBTA that is proposed in this work is depicted in Fig. 9 along with the previously proposed mechanisms. The updated scheme is relying on the following facts: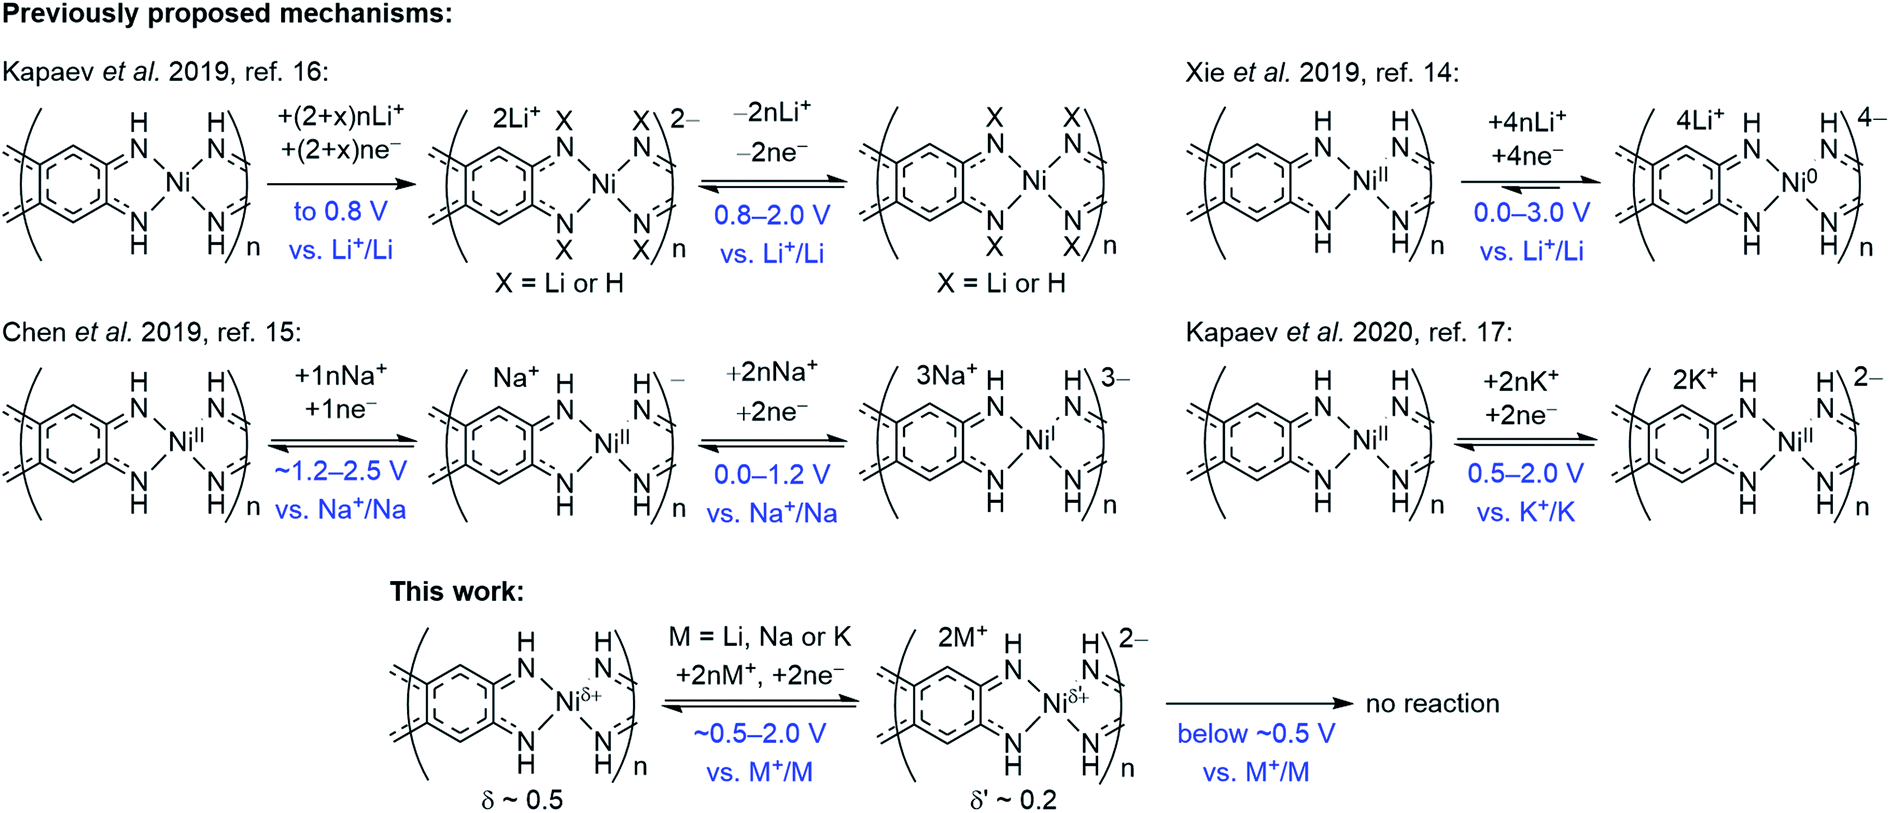 | ||
| Fig. 9 Charge storage mechanisms for NiBTA at the molecular level, as proposed in previous reports and in this work. | ||
• Operando Raman spectroscopy shows that the charge storage mechanism is similar for Li-, Na- and K-based cells at the molecular level.
• Raman spectroscopy and XRD reveal complete reversibility of NiBTA reduction. Therefore, no NH-proton substitution (as proposed by Kapaev et al.)16 takes place.
• NiBTA accepts only two electrons per repeating unit, as shown by Raman spectroscopy, XRD, XANES, and as suggested by electronic structure calculations. EDX mapping and post-mortem analysis show no signs of NiBTA decomposition at low potentials. No three- or four-electron reduction of the repeating units occurs, opposing the previously suggested reaction schemes for Li- and Na-based systems.14,15
• DFT-based population analysis shows that NiBTA reduction involves two-electron filling of the highest unoccupied LMO of the ligand (“working orbital”), whereas the formal oxidation state of nickel is zero and remains unchanged. The neutral formal charge of nickel is justified by intramolecular electron transfer from the working orbital, which is the HOMO of the BTA molecule. The natural atomic charge at Ni deviates from the formal charge, decreasing from ca. +0.5 to ca. +0.2 upon the two-electron reduction.
3. Conclusion
NiBTA shows promising features as an anode material for safe fast-charging lithium-, sodium- and potassium-ion batteries. In partially sodiated or potassiated states, the material undergoes fast bulk faradaic reactions, which should be beneficial for high-rate capabilities. The different behavior in the Li-, Na- and K-based systems is explained by the distinct crystal structure rearrangements. At the molecular level, the charge–discharge mechanism is similar for all types of batteries. It involves fully reversible ligand-based two-electron reduction, which is accompanied by the bandgap increase of the polymer. No further reduction of NiBTA occurs even at ∼0 V vs. M+/M. The reported results provide a deep insight into the redox chemistry of an emerging class of π–d coordination polymers.Data availability
The data supporting the findings of this study are available within the article and in the ESI.† The raw data are available from the authors upon reasonable request.Author contributions
RRK, KJS and AZ conceived the project. RRK performed the synthesis and all experimental studies except for the XANES measurements, which were carried out by DN. AZ performed all theoretical studies except for calculating charge distributions and band structures of crystalline polymers, which was carried out by DAA. SVR and DN analyzed the XANES data. PIM supervised the XANES measurements. KJS supervised the project. RRK and AZ wrote the manuscript with input from other co-authors. All authors gave approval to the final version of the paper.Conflicts of interest
There are no conflicts to declare.Acknowledgements
All studies except for the XANES measurements were supported by the Skoltech-MIT Next Generation Program “Energy-dense and Durable Nonaqueous Redox Flow Batteries enabled by Flowing Solid-state Capacity Boosters”. The XANES studies were supported by the Ministry of Education of the Russian Federation, project no. 075-15-2019-1891, 05.12.2019. The authors thank Svetlana Lipovskikh for EDX TEM measurements at the Skoltech Advanced Imaging Core Facility, Nikolay Ovsyannikov for the help with the magnetron sputtering, as well as Victoria Nikitina, Evgeniy Antipov and Pavel Troshin for valuable discussions.References
- Y. Liu, Y. Zhu and Y. Cui, Nat. Energy, 2019, 4, 540–550 CrossRef.
- W. Cai, Y.-X. Yao, G.-L. Zhu, C. Yan, L.-L. Jiang, C. He, J.-Q. Huang and Q. Zhang, Chem. Soc. Rev., 2020, 49, 3806–3833 RSC.
- S. Li, K. Wang, G. Zhang, S. Li, Y. Xu, X. Zhang, X. Zhang, S. Zheng, X. Sun and Y. Ma, Adv. Funct. Mater., 2022, 32, 2200796 CrossRef CAS.
- N. Takami, A. Satoh, M. Hara and T. Ohsaki, J. Electrochem. Soc., 1995, 142, 371–379 CrossRef CAS.
- M. D. Levi and D. Aurbach, J. Phys. Chem. B, 1997, 101, 4641–4647 CrossRef CAS.
- P. Yu, B. N. Popov, J. A. Ritter and R. E. White, J. Electrochem. Soc., 1999, 146, 8–14 CrossRef CAS.
- C. P. Sandhya, B. John and C. Gouri, Ionics, 2014, 20, 601–620 CrossRef CAS.
- Y. Tian, G. Zeng, A. Rutt, T. Shi, H. Kim, J. Wang, J. Koettgen, Y. Sun, B. Ouyang, T. Chen, Z. Lun, Z. Rong, K. Persson and G. Ceder, Chem. Rev., 2021, 121, 1623–1669 CrossRef CAS PubMed.
- J.-Y. Hwang, S.-T. Myung and Y.-K. Sun, Chem. Soc. Rev., 2017, 46, 3529–3614 RSC.
- T. Hosaka, K. Kubota, A. S. Hameed and S. Komaba, Chem. Rev., 2020, 120, 6358–6466 CrossRef CAS PubMed.
- L. S. Xie, G. Skorupskii and M. Dincă, Chem. Rev., 2020, 120, 8536–8580 CrossRef CAS PubMed.
- J. Park, M. Lee, D. Feng, Z. Huang, A. C. Hinckley, A. Yakovenko, X. Zou, Y. Cui and Z. Bao, J. Am. Chem. Soc., 2018, 140, 10315–10323 CrossRef CAS PubMed.
- S. Dong, L. Wu, M. Xue, Z. Li, D. Xiao, C. Xu, L. Shen and X. Zhang, ACS Appl. Energy Mater., 2021, 4, 1568–1574 CrossRef CAS.
- J. Xie, X.-F. Cheng, X. Cao, J.-H. He, W. Guo, D.-S. Li, Z. J. Xu, Y. Huang, J.-M. Lu and Q. Zhang, Small, 2019, 15, 1903188 CrossRef CAS PubMed.
- Y. Chen, M. Tang, Y. Wu, X. Su, X. Li, S. Xu, S. Zhuo, J. Ma, D. Yuan, C. Wang and W. Hu, Angew. Chem., Int. Ed., 2019, 58, 14731–14739 CrossRef CAS PubMed.
- R. R. Kapaev, S. Olthof, I. S. Zhidkov, E. Z. Kurmaev, K. J. Stevenson, K. Meerholz and P. A. Troshin, Chem. Mater., 2019, 31, 5197–5205 CrossRef CAS.
- R. R. Kapaev, I. S. Zhidkov, E. Z. Kurmaev, K. J. Stevenson and P. A. Troshin, Chem. Commun., 2020, 56, 1541–1544 RSC.
- J. E. Coughlin, A. Zhugayevych, M. Wang, G. C. Bazan and S. Tretiak, Chem. Sci., 2017, 8, 1146–1151 RSC.
- A. V. Akkuratov, I. E. Kuznetsov, P. M. Kuznetsov, N. V. Tukachev, I. V. Martynov, S. L. Nikitenko, A. V. Novikov, A. V. Chernyak, A. Zhugayevych and P. A. Troshin, Synth. Met., 2020, 259, 116231 CrossRef CAS.
- G. Cai, P. Cui, W. Shi, S. Morris, S. N. Lou, J. Chen, J.-H. Ciou, V. K. Paidi, K.-S. Lee, S. Li and P. S. Lee, Adv. Sci., 2020, 7, 1903109 CrossRef CAS PubMed.
- B. Wang, L. Gu, D. Zhang and W. Wang, Chem.–Asian J., 2019, 14, 3181–3187 CrossRef CAS PubMed.
- V. A. Nikitina, S. Y. Vassiliev and K. J. Stevenson, Adv. Energy Mater., 2020, 10, 1903933 CrossRef CAS.
- V. Augustyn, P. Simon and B. Dunn, Energy Environ. Sci., 2014, 7, 1597–1614 RSC.
- Y. Liang, Y. Jing, S. Gheytani, K.-Y. Lee, P. Liu, A. Facchetti and Y. Yao, Nat. Mater., 2017, 16, 841–848 CrossRef CAS PubMed.
- Y. Ding, Y. Li and G. Yu, Chem, 2016, 1, 790–801 CAS.
- Y. Liang, P. Zhang, S. Yang, Z. Tao and J. Chen, Adv. Energy Mater., 2013, 3, 600–605 CrossRef CAS.
- S. S. Fedotov, A. S. Samarin, V. A. Nikitina, K. J. Stevenson, A. M. Abakumov and E. V. Antipov, ACS Appl. Mater. Interfaces, 2019, 11, 12431–12440 CrossRef CAS PubMed.
- X.-F. Cheng, E.-B. Shi, X. Hou, J. Shu, J.-H. He, H. Li, Q.-F. Xu, N.-J. Li, D.-Y. Chen and J.-M. Lu, Adv. Electron. Mater., 2017, 3, 1700107 CrossRef.
- X. Li, X. Sun, X. Hu, F. Fan, S. Cai, C. Zheng and G. D. Stucky, Nano Energy, 2020, 77, 105143 CrossRef CAS.
- H. He, D. Sun, Y. Tang, H. Wang and M. Shao, Energy Storage Mater., 2019, 23, 233–251 CrossRef.
- R. J. Clark and B. Stewart, in Inorganic Chemistry and Spectroscopy, Springer, Berlin, Heidelberg, 1979, vol. 36, pp. 1–80 Search PubMed.
- M. Sharif Sh, F. Golestani Fard, E. Khatibi and H. Sarpoolaky, J. Taiwan Inst. Chem. Eng., 2009, 40, 524–527 CrossRef CAS.
- C. Russo, B. Apicella, J. S. Lighty, A. Ciajolo and A. Tregrossi, Carbon, 2017, 124, 372–379 CrossRef CAS.
- G. Cong, W. Wang, N.-C. Lai, Z. Liang and Y.-C. Lu, Nat. Mater., 2019, 18, 390–396 CrossRef CAS PubMed.
- R. R. Kapaev and K. J. Stevenson, J. Mater. Chem. A, 2021, 9, 11771–11777 RSC.
- W. M. Dose, S. Kim, Q. Liu, S. E. Trask, A. R. Dunlop, Y. Ren, Z. Zhang, T. T. Fister and C. S. Johnson, J. Mater. Chem. A, 2021, 9, 12818–12829 RSC.
- F. Wang, B. Wang, J. Li, B. Wang, Y. Zhou, D. Wang, H. Liu and S. Dou, ACS Nano, 2021, 15, 2197–2218 CrossRef CAS PubMed.
- M. Crespin, P. Levitz and L. Gatineau, J. Chem. Soc., Faraday Trans. 2, 1983, 79, 1181–1194 RSC.
- A. N. Mansour and C. A. Melendres, J. Phys. Chem. A, 1998, 102, 65–81 CrossRef CAS.
- L. R. Furenlid, M. W. Renner and E. Fujita, Phys. Rev. B: Condens. Matter Mater. Phys., 1995, 208–209, 739–742 CrossRef.
- M. Tromp, J. Moulin, G. Reid and J. Evans, AIP Conf. Proc., 2007, 882, 699–701 CrossRef CAS.
- J. L. DuBois, P. Mukherjee, T. D. P. Stack, B. Hedman, E. I. Solomon and K. O. Hodgson, J. Am. Chem. Soc., 2000, 122, 5775–5787 CrossRef CAS.
- M. Tromp, J. A. van Bokhoven, G. P. F. van Strijdonck, P. W. N. M. van Leeuwen, D. C. Koningsberger and D. E. Ramaker, J. Am. Chem. Soc., 2005, 127, 777–789 CrossRef CAS PubMed.
- R. J. Woolley, B. N. Illy, M. P. Ryan and S. J. Skinner, J. Mater. Chem., 2011, 21, 18592–18596 RSC.
- W. E. O'Grady, K. I. Pandya, K. E. Swider and D. A. Corrigan, J. Electrochem. Soc., 1996, 143, 1613–1617 CrossRef.
- C. Fang, Y. Huang, L. Yuan, Y. Liu, W. Chen, Y. Huang, K. Chen, J. Han, Q. Liu and Y. Huang, Angew. Chem., Int. Ed., 2017, 56, 6793–6797 CrossRef CAS PubMed.
- L. Su, Z. Zhou and P. Shen, J. Phys. Chem. C, 2012, 116, 23974–23980 CrossRef CAS.
- H. Kim, W. Choi, J. Yoon, J. H. Um, W. Lee, J. Kim, J. Cabana and W.-S. Yoon, Chem. Rev., 2020, 120, 6934–6976 CrossRef CAS PubMed.
Footnote |
| † Electronic supplementary information (ESI) available. See https://doi.org/10.1039/d2sc03127b |
| This journal is © The Royal Society of Chemistry 2022 |