
 Open Access Article
 This Open Access Article is licensed under a Creative Commons Attribution-Non Commercial 3.0 Unported Licence
Artificial intelligence pathway search to resolve catalytic glycerol hydrogenolysis selectivity†
Pei-Lin
Kang
 a,
Yun-Fei
Shi
a,
Cheng
Shang
ab and
Zhi-Pan
Liu
*abc
a,
Yun-Fei
Shi
a,
Cheng
Shang
ab and
Zhi-Pan
Liu
*abc
aCollaborative Innovation Center of Chemistry for Energy Material, Shanghai Key Laboratory of Molecular Catalysis and Innovative Materials, Key Laboratory of Computational Physical Science, Department of Chemistry, Fudan University, Shanghai 200433, China. E-mail: zpliu@fudan.edu.cn
bShanghai Qi Zhi Institution, Shanghai 200030, China
cKey Laboratory of Synthetic and Self-Assembly Chemistry for Organic Functional Molecules, Shanghai Institute of Organic Chemistry, Chinese Academy of Sciences, Shanghai 200032, China
First published on 20th June 2022
Abstract
The complex interaction between molecules and catalyst surfaces leads to great difficulties in understanding and predicting the activity and selectivity in heterogeneous catalysis. Here we develop an end-to-end artificial intelligence framework for the activity prediction of heterogeneous catalytic systems (AI-Cat method), which takes simple inputs from names of molecules and metal catalysts and outputs the reaction energy profile from the input molecule to low energy pathway products. The AI-Cat method combines two neural network models, one for predicting reaction patterns and the other for providing the reaction barrier and energy, with a Monte Carlo tree search to resolve the low energy pathways in a reaction network. We then apply AI-Cat to resolve the reaction network of glycerol hydrogenolysis on Cu surfaces, which is a typical selective C–O bond activation system and of key significance for biomass-derived polyol utilization. We show that glycerol hydrogenolysis features a huge reaction network of relevant candidates, containing 420 reaction intermediates and 2467 elementary reactions. Among them, the surface-mediated enol–keto tautomeric resonance is a key step to facilitate the primary C–OH bond breaking and thus selects 1,2-propanediol as the major product on Cu catalysts. 1,3-Propanediol can only be produced under strong acidic conditions and high surface H coverage by following a hydrogenation–dehydration pathway. AI-Cat further discovers six low-energy reaction patterns for C–O bond activation on metals that is of general significance to polyol catalysis. Our results demonstrate that the reaction prediction for complex heterogeneous catalysis is now feasible with AI-based atomic simulation and a Monte Carlo tree search.
1 Introduction
Glycerol is an important biomass-derived platform chemical1–4 and its selective conversion to other chemicals,5–10 particularly, 1,2-propanediol (1,2-PDO)11–16 and 1,3-propanediol (1,3-PDO)17–20 are of great significance in industry. Among the many catalysts tested, Cu-based catalysts are regarded to be the best to selectively convert glycerol to 1,2-PDO with low/zero selectivity to 1,3-PDO and other deep hydrogenolysis products (e.g. propanol). Considering that 1,3-PDO is a more valuable chemical than 1,2-PDO,7 there has been considerable interest to quantify the reaction kinetics and to improve the 1,3-PDO selectivity. However, due to the complex nature of the polyol interaction with catalyst surfaces, the reaction mechanism remains hotly debated:3,7 the high selectivity to 1,2-PDO for glycerol hydrogenolysis on Cu-based catalysts has been puzzling for decades. The complexity originates mainly from the huge reaction network with many likely reaction intermediates due to the presence of all 13 chemical bonds, i.e. five C–H, three O–H, three C–O and two C–C, in glycerol that are apparently possible to break on catalysts.3Fig. 1 shows the proposed reaction mechanisms for glycerol hydrogenolysis in the literature dating back to the 1980s: six different reaction routes to 1,2-PDO and 1,3-PDO5,12,18,21–23 were proposed, each in a different color. Since 1,2-PDO is observed to be the major product on Cu-based catalysts (see the ESI, Table S1† for collected experimental data), the pathways to 1,2-PDO assume the preference of breaking one of the two primary C–O bonds but with varied patterns, including 1,2 β-elimination dehydration (blue arrows,12,22Fig. 1), direct C–O bond breaking (red,23 green23), and retro-Michael addition reaction (black5 and purple21). These pathways are, however, in contrast with the general chemistry knowledge that the secondary C is chemically more active than the primary C, and more importantly, cannot explain satisfactorily the high selectivity to 1,2-PDO but low/zero selectivity to 1,3-PDO (brown18) and the deep hydrogenolysis products.
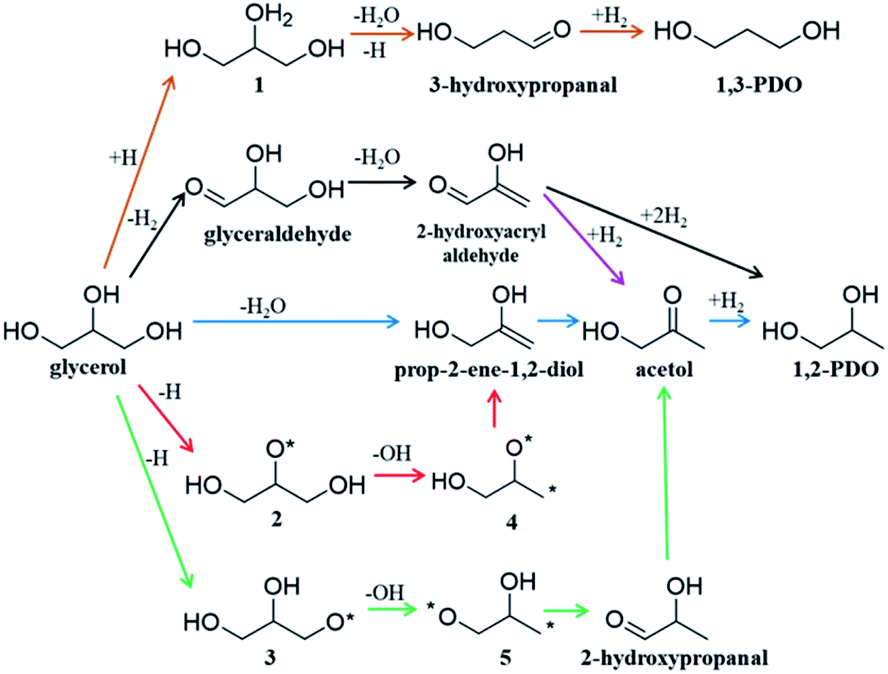 | ||
| Fig. 1 Proposed reaction pathways of glycerol to 1,2-PDO and 1,3-PDO transformation on Cu-based catalysts in the literature. Note that each proposed step in the scheme may contain several elementary steps. | ||
The glycerol hydrogenolysis reaction thus illustrates well the dilemma of selectivity control in heterogeneous catalysis where the current knowledge on elementary reaction steps, being difficult to glean from experiment, is much short of one's expectation towards the rational design of the reaction. The participation of catalysts (e.g. metal surfaces) in reactions not only greatly increases the likely intermediates (e.g. adsorbed atoms, radicals), but also creates catalyst-specific preference for specific reaction patterns. The theoretical methods available to date generally fail to provide fast and accurate guidance to catalyst and reaction design. In particular, the valence bond theory well recognized in chemistry often cannot predict even qualitatively the activity and selectivity in heterogeneous catalysis.
Instead, quantum mechanics based atomistic simulations are now popularly resorted to for elucidating the reaction kinetics of heterogeneous catalysis, which are however limited largely to small reaction systems (e.g. less than 100 atoms) on well-defined catalyst surfaces due to the high cost and poor scaling in computation. In fact, theoretical attempts were made to expedite the surface reaction exploration as early as the 1990s. These methods involve first the generation of the likely reaction patterns of molecules according to the octet rule or the bond matrix, such as Netgen (Broadbelt et al.),24,25 RMG (Green group),26,27 RING (Rangarajan et al.)28 and pReSt (Valchos group).29 The kinetics data of reactions between enumerated reaction pairs, i.e. the reaction energy (energy difference between the product and the reactant) and reaction barrier (energy difference between the transition state and the reactant), while being difficult to obtain, can then be estimated by empirical/approximate approaches, such as the Brønsted–Evans–Polanyi (BEP) relationship,30,31 scaling relationship,32–34 and UBI-QET method.35,36 In these methods, the reaction energy may be fetched either from experimental data, or estimated by the group additivity approach, the gas phase bond energies, and the atomic binding energy, or directly calculated by on-the-fly density functional theory (DFT) calculations, whilst the reaction barrier is estimated from the reaction energy by the BEP relationship or can be explicitly determined by locating the transition state (TS).37–43 While the scheme appears logically sound, there are still many methodological difficulties associated with the accurate reaction prediction. For example, the BEP relationship is a crude approach, i.e. the error bar of reaction barrier estimation is generally above 0.2 eV; the TS location requires the pre-knowledge of reaction coordinates and has a high computational cost even with DFT.
Recent years have seen great success in developing artificial intelligence (AI) methods for organic retrosynthesis,44–56 which relies on two key merits that appear to be unique to organic reactions: first, a large reaction database from organic experiments is available on the market (e.g. Reaxys, and SciFinder databases); second, the general validity of the octet rule in describing elementary organic transformation. It is thus possible to relate an organic reaction to the reactant and product using numerical descriptors, such as Simplified Molecular Input Line Entry Specification57 (SMILES) and Extended-Connectivity fingerprints58 (ECFP) where the bond order matrix can be used to detect the structural change. On the other hand, the situation in heterogeneous catalysis is rather different. The reaction steps occurring on surfaces are numerous and generally not separable until the final products are obtained. As exemplified in Fig. 1, acetol is the only one among all proposed intermediates that can be confirmed via experiment.12,23 Furthermore, an accurate account of heterogeneous reactions is virtually not possible due to the structural complexity of solid catalysts (various surface structures and compositions). It is no wonder that the reaction database for heterogeneous catalysis is not established from experiment, not even mentioning the AI-based reaction prediction based on the heterogeneous reaction database.
Herein we propose a general AI framework for predicting heterogeneous catalysis activity, namely the AI-Cat method. Our method provides a one-go solution, from the building of a heterogeneous catalytic reaction database, to the end-to-end activity prediction using machine learning. The reaction database is collected by using our recently developed global neural network (G-NN) potential59–61 that, in combination with stochastic surface walking (SSW) global optimization,62 can fast explore reactions on surfaces. The end-to-end activity predictor combines two neural network (NN) models, one for predicting possible reaction patterns and the other for providing the reaction barrier and energy, with the Monte Carlo (MC) tree search to resolve the low energy pathways in a reaction network. We illustrate our method in resolving the complex reaction network of glycerol hydrogenolysis on Cu and rationalizing the high selectivity of glycerol to 1,2-PDO.
2 Theoretical methods
Owing to the lack of experimental kinetics data on elementary reactions in heterogeneous catalysis, any successful AI model for predicting heterogeneous reaction activity must be able to build a reaction database by its own, from which the reaction pattern and kinetics information can be abstracted. The subsequent machine learning of these reaction data would then require sensitive reaction descriptors that can distinguish molecules/fragments on surfaces. Before proceeding to present our AI-Cat method, we first introduce the molecule descriptor for surface reactions developed in this work.It is well established that an organic molecule can be uniquely identified using the atom-centered extended-connectivity fingerprints, i.e. ECFP-x where x represents the largest possible fragment that has a width of x bonds (diameter in bonds) with respect to the center atom. ECFP can abstract the topological information of the molecule from the bond matrix, which can be readily established for heavy atoms (non-H atoms) if the octet-rule is satisfied. The ECFP is thus not quite compatible with heterogeneous catalytic systems for two reasons: (i) unsaturated reaction intermediates (adsorbates on surfaces) are common; and (ii) H atoms, either as adsorbates or attached to molecular fragments, are of key significance to distinguish different molecular states.
For describing surface reactions uniquely, we modified ECFP descriptors in three places: (i) the bond matrix generation allows the adsorbed atoms to not obey the octet rules and takes into account the periodicity, if necessary; (ii) the information of the catalyst, e.g. the type of metal, is embodied into the initial identifier for adsorbed atoms; (iii) H atoms are treated equally as the heavy atoms. The thus-modified ECFP-x is named surface sensitive ECFP-x (s-ECFP-x), which can produce the unique identifier for adsorbed molecules/fragments. For example, for an adsorbed HCOO that has an O adsorbed on the surface (HCOO*, * indicates the adsorbed atom), s-ECFP-x will consider the fragment to be formate HC(![[double bond, length as m-dash]](https://www.rsc.org/images/entities/char_e001.gif) O)O* by maximally letting non-adsorbed atoms (HCO) to obey the octet rule. By this way, the adsorbed carboxyl (C*(O)OH) and formate (HC(O)O*) can be readily distinguished.
O)O* by maximally letting non-adsorbed atoms (HCO) to obey the octet rule. By this way, the adsorbed carboxyl (C*(O)OH) and formate (HC(O)O*) can be readily distinguished.
An example of generating the s-ECFP-4 digital code for a coadsorbed formate fragment and H atom is given in Fig. 2 (also see ESI Section 2† for details). The new features in s-ECFP as compared to the traditional ECFP are highlighted by the red explanatory text. An iterative procedure is applied to every atom to create a series of identifiers by gradually increasing the radius around the central atom, as indicated by the red circles around 1O. Every iteration takes into account the topological information related to the circled atoms and the bonds connecting them. After all atoms are treated, a set of s-ECFP-4 fingerprints are generated to form a vector as the unique descriptor of the structure. We would like to comment that the s-ECFP-4 descriptor can distinguish different adsorbed molecules, including single molecules and coadsorbed molecules (e.g. HCOO and H in Fig. 2), but does not record their relative physical distance. This treatment is largely valid for metal catalysis since the adsorbate diffusion is generally facile and thus not important for evaluating the catalytic activity.
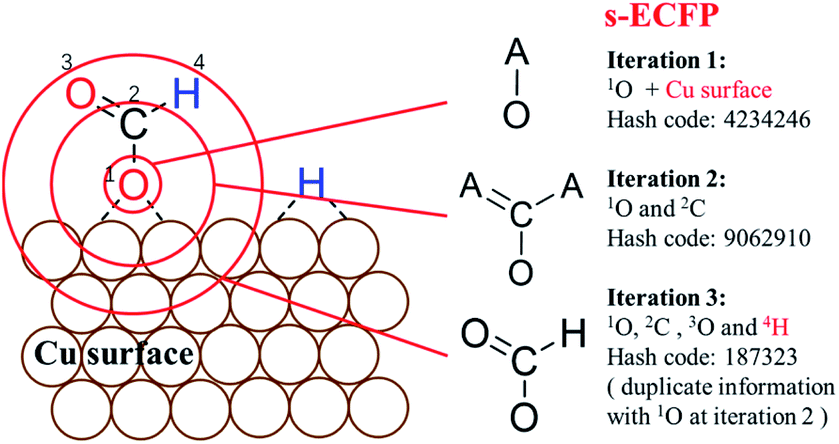 | ||
| Fig. 2 Procedure to generate identifiers for molecules on surfaces using Surface-sensitive atom-centered Extended-Connectivity FingerPrint (s-ECFP). The iterative procedure for generating s-ECFP is illustrated using the adsorbed O end (1O) of HCOO as the example. Each iteration creates an identifier for the substructure in a circle around the central atom. The identifier at iteration 1 only represents the information of the 1O atom, its attached bonds and the surface in bonding. By enlarging the circles, the next iterations include more and more information associated with the substructure centering on the 1O. Duplicate identifiers will be removed, for example, the substructure of 1O at the iteration 3 is the same as the one of atom 2C at the iteration 2. The explanatory text in red indicates the added features for s-ECFP compared to the ECFP. | ||
We now turn to the AI-Cat method, which relies on the s-ECFP-4 descriptor to distinguish different reactions. There are two parts in the AI-Cat method, i.e. (i) reaction database construction; (ii) AI model for activity prediction. The AI model can be further decomposed into two NN prediction models and an MC tree search module. They are elaborated in the following section.
2.1 Algorithm for constructing the reaction database and the reaction database for catalytic reactions on Cu surfaces
With the advent of G-NN potential based global potential energy surface (PES) sampling as implemented in the SSW-NN method, it is now feasible to predict unknown chemical systems in an automated way. In the past few years our group has managed to generate a series of four-element G-NN potentials M–C–H–O (M = Fe, Co, Ni, Cu, Ru, Rh, Pd Ag, Ir, Pt and Au) covering the most common catalytic metals and these G-NN potentials are accessible from the LASP61 project website (https://www.lasphub.com). These G-NN potentials (see ESI Section 2† for details) allow for fast PES evaluation in the SSW reaction sampling (SSW-RS)39,63 of common C1–C3 reactions on these metal surfaces.64 This work focuses on the building of the reaction database for catalytic reactions on Cu surfaces.In initiating the automatic reaction database generation, we require a minimum amount of information as input, including the metal species (e.g. Cu), the type of surface (e.g. (111), (100) surfaces), and the C![[thin space (1/6-em)]](https://www.rsc.org/images/entities/char_2009.gif) :H:O composition (e.g. the type and the number of molecules, such as CO, H2, H2O, methanol, and glycerol). The program then utilizes the SSW-RS method to search for all the likely distinct reactions at the given C:H:O composition on the surface, which is an iterative procedure to explore all the likely reactions until no new low energy minima are identified.
:H:O composition (e.g. the type and the number of molecules, such as CO, H2, H2O, methanol, and glycerol). The program then utilizes the SSW-RS method to search for all the likely distinct reactions at the given C:H:O composition on the surface, which is an iterative procedure to explore all the likely reactions until no new low energy minima are identified.
The scheme of the SSW-RS method is shown in Fig. 3a with each small circle representing a minimum and the dotted large circle representing the range of SSW-RS explorations centering this minimum. By automatically switching the starting minima in different iterations as indicated by the cycle n (n = 1, 2, …, see Fig. 3a), the global PES will be mapped out and all the likely reaction pairs, initial state (IS) and final state (FS), together with the identified transition state (TS) can be obtained. The SSW-RS method has been described in detail previously, for example, to explore the reaction space of gas phase organic reactions.65 In this work, the s-ECFP descriptor is utilized to judge whether a newly found reaction is distinct from others.
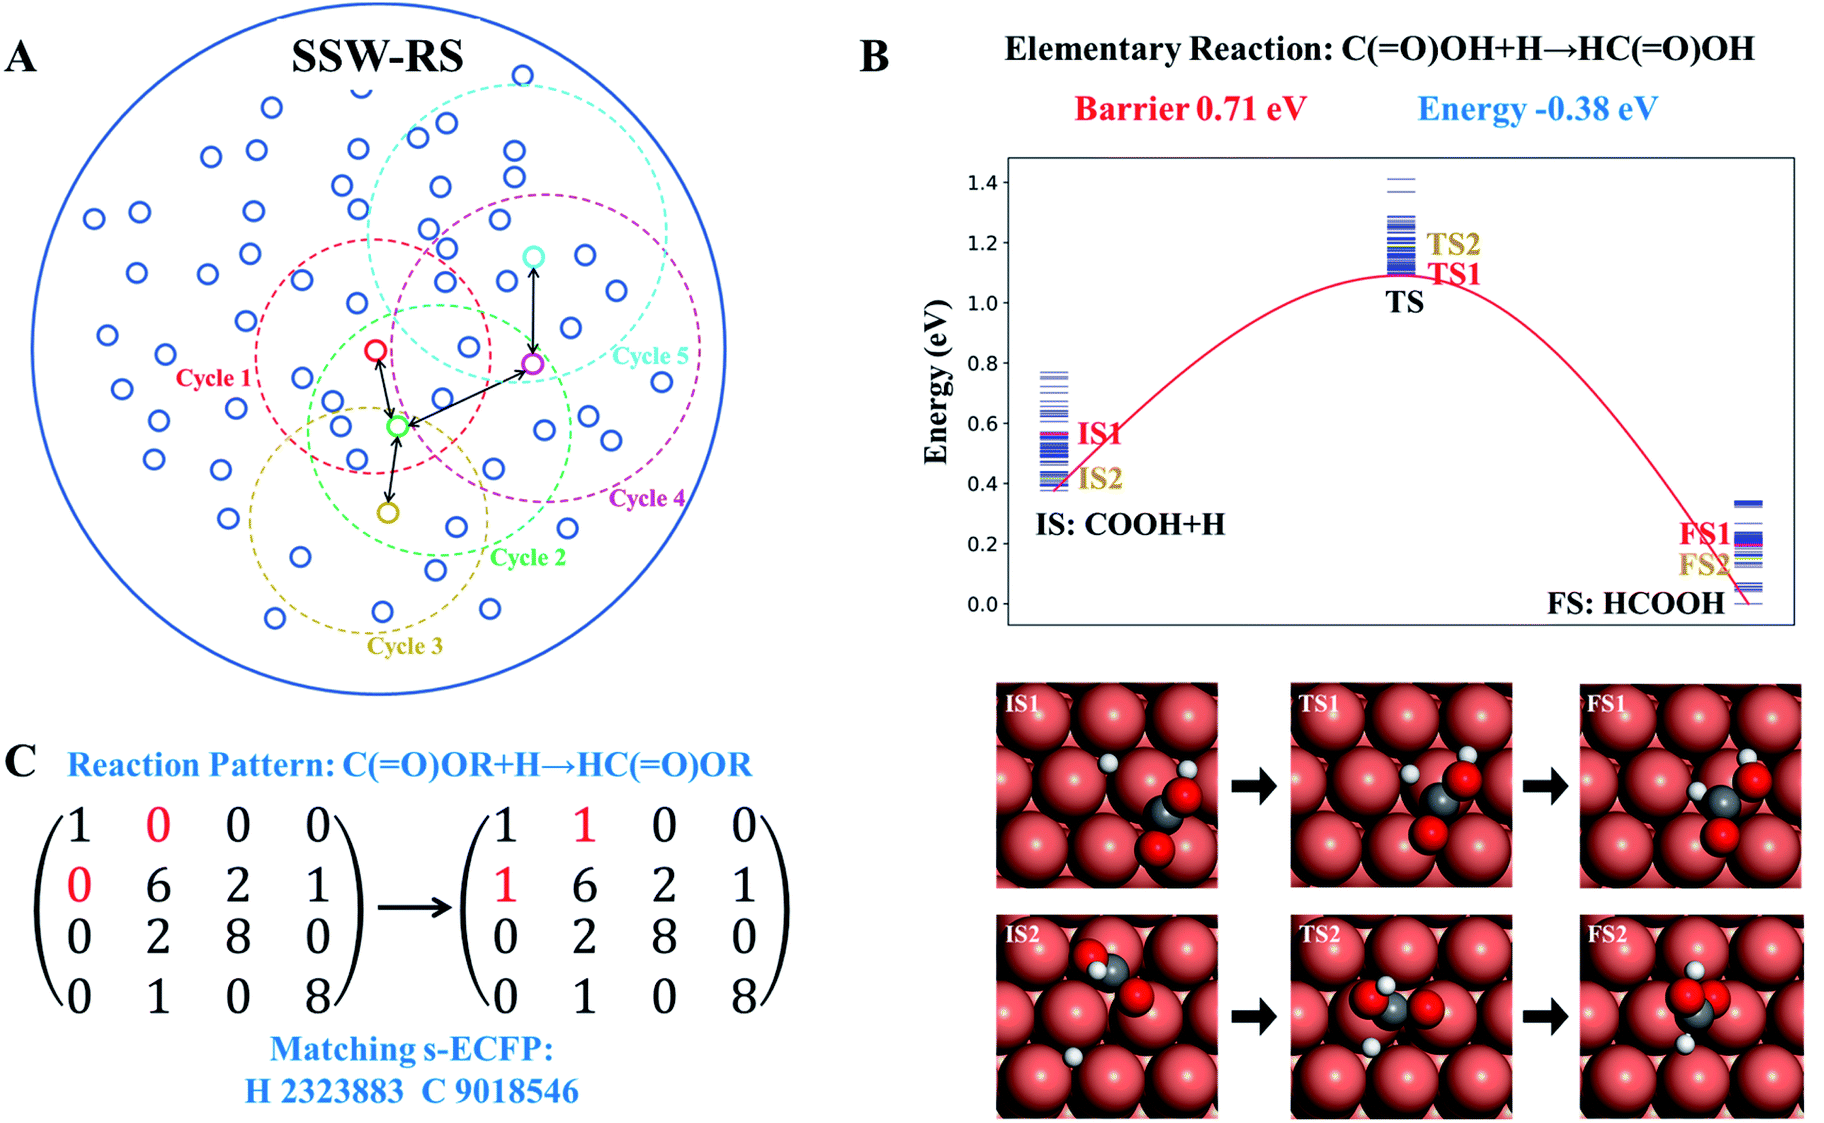 | ||
| Fig. 3 Reaction database generation with the help of SSW reaction sampling. (A) Scheme of SSW reaction sampling. Each small circle represents a distinguishable state that has many connections (pathways) to other small circles. Each SSW reaction sampling is represented by the dotted large circle that collects the pathways linking to the centering state. By automatically selecting the state for sampling, the reaction network for a complex reaction system can be established (also see text). (B). Illustration of multiple pathways connecting to the same reaction pair, where only the lowest energy IS, TS and FS, i.e. the reaction pair information, are recorded in the reaction database to provide the reaction barrier and the reaction energy. (C). Illustration of extracting the reaction pattern associated with the reaction pair using the bond matrix where the reaction center atom is uniquely identified by s-ECFP. Finally, the reaction database includes both the reaction pattern and the reaction pair information. | ||
Fig. 3b and c illustrate how a reaction database is established from the raw SSW-RS data. We use the following two strategies for purifying the raw data to maintain the key kinetics information. First, as there may well be many different pathways for the same elementary reaction (Fig. 3b), we only abstract the lowest energy minima for stationary points (IS and FS), and the lowest energy for the saddle points (TS) as long as the TS connects correctly to the IS and the FS as indicated by s-ECFP. This treatment ignores the kinetics for the transformation between molecular configurations on the surface (e.g. diffusion) since they are in general low-barrier fast reactions, particularly for C1–C3 small molecules. This stores the correct reaction energy and the lowest energy barrier between the reaction pair. Second, too rare reactions, e.g. those identified only once from SSW-RS, are not considered since kinetically relevant reactions should occur frequently.
Based on the elementary reaction pairs, the reaction patterns can then be extracted and also stored in the reaction database with a unique reaction pattern identifier (indexed by integers from 1 to n). Following the shell-based scheme to describe a reaction, proposed by Christ et al.66 and Saller and coworkers,67 we define the reaction patterns of surface reactions by the bond matrix elements for the reaction center atoms and their first neighbors, and the reaction center atoms' identifiers (s-ECFP) (also see ESI Section 3† for details). As illustrated in Fig. 3c, for a *C(O)OH + H* → HC(O)OH surface reaction, the reaction pattern is first represented by a (4 × 4) bond matrix of the reacting substructures of C(O)OR + H and HC(O)OR where R represents any connecting groups that are out of reaction centers and not recorded in the reaction pattern. The diagonal matrix element represents the atomic number (H:1, C:6, and O:8), while other elements represent the bond order between atoms. In addition, we also record the s-ECFP identifier of reaction center atoms of reactants for the purpose of reaction center recognition. The reaction pattern identifier will be the output for the AI model for reaction prediction, and utilized for predicting the kinetics data of a reaction, as presented below.
2.2 AI-Cat model for activity prediction
The AI model for activity prediction utilizes the MC tree search algorithm to identify the low energy pathways connecting the input reactant to the target product. During the reaction network search, the MC tree search algorithm needs to acquire two NNs persistently, namely a reaction pattern (R-Pat) unit to enumerate the most likely reaction patterns of a given reactant, and a kinetics information (K-Info) unit to provide the essential kinetics data.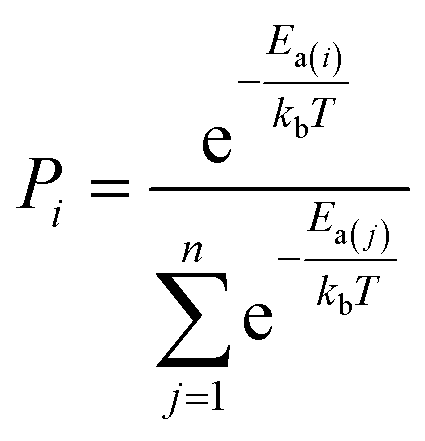 | (1) |
We consider a whole reaction network as a tree structure with each node representing an intermediate state (containing all species, including both the reacting species and spectator species) and the edges being the state-to-state connections governed by kinetics. Each node is associated with three values that can be updated during tree search, i.e. the action value Q, the visit count N and the reaction probability P. For a newly identified node, the initial value for Q and N is 0, and that for P is set as the probability from the father node to the current node computed from eqn (1), which is a weighted rate constant, where i denotes the current node and Ea(j) is the reaction barrier from the father node to its jth child node in eqn (1). Terminal nodes need to be defined for stopping a search along one tree branch, which belong to either one of the three situations, (i) the target; (ii) the dead-end states with no further connections or connecting only to those with no further connections, and (iii) the states with too high overall barriers to access. The overall barrier of a multiple-step process corresponds to the energy difference calculated from the TOF-determining transition state (TDTS) and the TOF-determining intermediate (TDI) in the energetic span model69 (the maximum energy height needed to overcome along a reaction pathway).
As shown in Fig. 4A, MC tree search has four phases that are executed iteratively until the lowest energy pathway is identified.
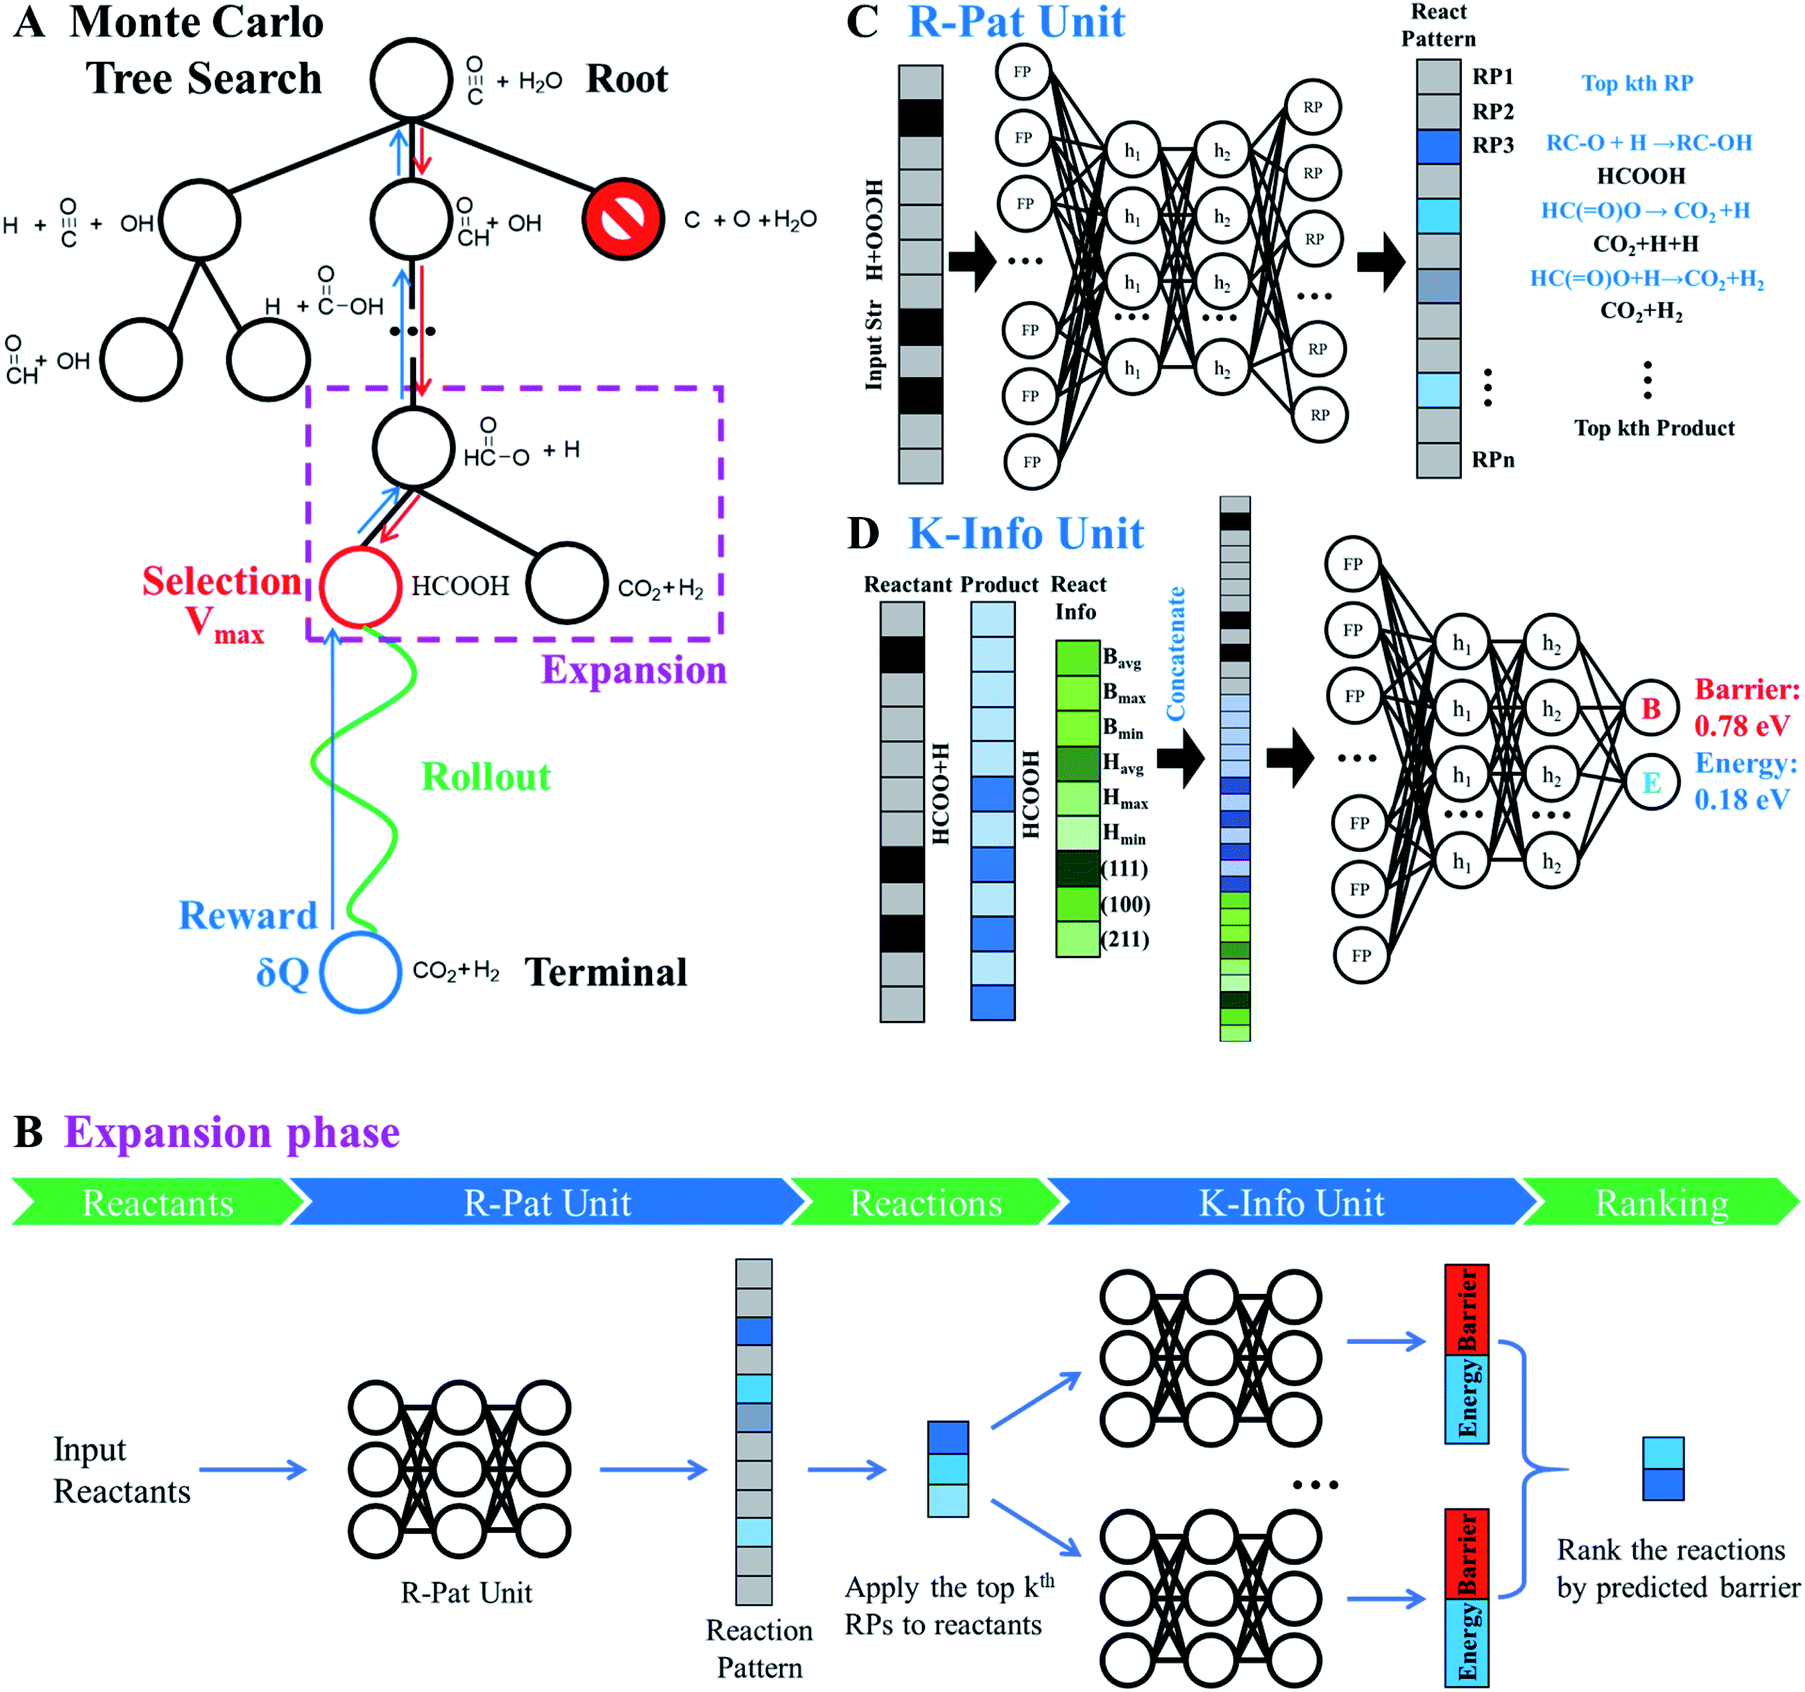 | ||
| Fig. 4 Monte Carlo tree search (MCTS) to identify the lowest energy pathway in a complex reaction network. CO + H2O reaction on Cu(111) is utilized to illustrate the MCTS, and how MCTS enquires the R-Pat and K-Info units for reaction information is illustrated by the HCOO + H reaction as indicated in the dotted purple box. (A) MCTS procedure that includes four phases: selection, rollout, reward and expansion, which are iteratively performed to explore the reaction network. Red arrow: the interactive section traverses the tree by selecting the node with maximum priority score V. Green arrow: the fast rollout evaluation starts from the selected node. Blue arrow: update the reward according to the rollout result for nodes traversed in the branch from the selected node to the root node. (B) The flowchart of the expansion phase showing the working mechanism, where the R-Pat unit and K-Info unit are utilized to obtain the kinetics information so that the child nodes are ranked. (C) R-Pat unit to predict reaction patterns for a given reactant. (D) K-Info unit to predict quantitatively the reaction barrier and energy. | ||
Phase 1 selection: starts from the root node, a selection procedure is performed iteratively to identify the most promising next node according to the priority score Vi.
 | (2) |
In eqn (2), the subscript i and fa indicate the current node and its father node. The selection traverses the tree by selecting the node with maximum V until reaching an unvisited node (N = 0). The search will then move to phase 2 if the selected node is unvisited, or to phase 4 if the node needs to be expanded (N = 1).
Phase 2 rollout: starts from the selected, non-visited node, a rollout procedure is carried out by enquiring the R-Pat unit to obtain the target product. The rollout stops if a target node is met or the maximum depth Dmax of the search is reached. Every enquiry of the R-Pat unit gives a number of possible reaction patterns, CRP, leading to the new product nodes. Due to the fast increase of nodes, we limit CRP to 3, i.e. the top 3 likely reaction patterns, and Dmax to 10.
Phase 3 reward: Q and N are updated immediately after phase 2 for the nodes traversed in the branch from the selected node to the root node. Q will be rewarded by adding 1 if the target product is reached, or be punished by deducting 1. The visit count N increases by 1 for the whole branch nodes. The current node thus changes to a visited node.
Phase 4 expansion: starts from the selected, visited node (N = 1), the expansion of the tree is performed by enquiring both the R-Pat and the K-Info units to generate the child nodes for the current node. Fig. 4B shows the flowchart of the expansion phase. As shown, the reactant is firstly converted to an s-ECFP-4 code and fed into the R-Pat unit, which returns a probability distribution over all possible RPs (RP1 to RPn). Then, for the k most probable RPs, by applying each one to the reactant for generating the product (the child node) and thus the reaction R, the K-Info unit is utilized to obtain the reaction barrier and reaction energy associated with each child node. Finally, the child nodes are ranked by the reaction barrier info. To avoid the explosion of the tree size, we limit the maximum number of child nodes to 15, where the child node should not appear previously in the same branch and the overall barrier to the child node needs to be less than a preset maximum barrier (e.g. 2.5 eV or 0.3 eV above the current lowest energy pathway, the reference).
By iteratively executing these four phases, a tree of reaction networks is established and the pathways from the reactant to the target product are recorded and ranked according to the predicted overall reaction barrier. It is worth mentioning that the key feature of our AI-Cat model is the accessibility to the kinetics information of predicted elementary reactions. By setting the current lowest energy pathway as the reference, we can efficiently rule out the node with a too high overall barrier (e.g. 0.3 eV higher than the reference with the consideration of the likely error of K-Info unit prediction) in the phase 1 selection (by setting as terminal nodes). This leads to a highly efficient removal of irrelevant and redundant branches and thus the tree search converges quickly to the low energy pathways. It is worth mentioning that the complexity of MCTS depends on the input chemical composition: the molecules defined by the input and the available reaction patterns learned from the database.
Fig. 4C illustrates the working mechanism of the R-Pat unit to predict likely reactions from the input HC(O)O* + H. First, a set of s-ECFP-4 are generated from HC(O)O* + H, which are mapped to an input vector that is 3475 dimensions in total where only 8 associated with HC(O)O* + H are indexed and the rest are zero. The probability distribution is then predicted by the R-Pat unit. Taking the predicted most likely reaction pattern, i.e. RP1: RC–O + H → RC–OH, as the example, a reaction is generated as HC(O)O* + H → HCOOH where HCOOH is the product.
Fig. 4D illustrates the architecture of the K-Info unit using the HC(O)O* + H → HCOOH on Cu(111) as an example. The input takes the information from the reactant (HC(O)O* + H), the product (HCOOH) as predicted by the R-Pat unit, and the general reaction information associated with the reaction barrier, energy and surfaces. The unit predicts the reaction barrier of 0.78 eV and reaction energy of 0.18 eV for HC(O)O* + H → HCOOH on Cu(111).
2.3 G-NN potential and DFT calculations
The quaternary Cu–C–H–O G-NN potential used for SSW-RS reaction data collection was trained by using LASP software,61 which iteratively learns the global PES data generated by SSW global optimization (see ESI Section 2† for the detailed methodology). The Cu–C–H–O G-NN potential has a double-net architecture implemented in LASP 3.0,70 a five-layer (410–80–80–80–1) feed-forward NN for all elements plus an auxiliary four-layer (258–80–80–1) feed-forward NN for C, H and O elements, equivalent to 266823 parameters in total. The potential was trained using a dataset of 90726 distinct structures that are computed using plane wave DFT calculations71,72 (DFT calculation setup can be found in the next paragraph). The final RMS accuracy of the G-NN potential is 3.77 meV per atom for energy and 0.10 eV Å−1 for atomic force (the G-NN PES accuracy is also addressed in ESI Fig. S5†).
DFT calculations have been utilized to generate the dataset for G-NN training and also for validating the surface reactions reported in this work. All the total energy calculations were carried out using the VASP software,71,72 where the basis set is expanded in plane waves and the electron–ion interaction is represented by the projector augmented wave (PAW) pseudopotential. For the G-NN training dataset, the electron exchange and correlation effects are described by the GGA-PBE functional. For reaction pathway validations, the van der Waals correction using the Grimme D3 approach (DFT-D3 (ref. 73)) has been added to the GGA-PBE total energy. In all calculations, the kinetic energy cutoff utilized is 450 eV and the first Brillouin zone k-point sampling utilizes the Monkhorst–Pack scheme with an automated mesh determined by 25 times the reciprocal lattice vectors. The finite difference method with the displacement of 0.01 Å for an atom is utilized to calculate the vibrational modes and thus to determine the zero-point energy (ZPE).
To obtain the free energy profile of glycerol hydrogenolysis (see Section 3.1), the ab initio thermodynamics approach74 is utilized to correct the Gibbs free energy under the reaction conditions (473 K). For all of the adsorbed states on the surface, the vibrational entropy is taken into account based on the harmonic frequency calculation using DFT-D3. The free energy of gas phase molecules (glycerol, acetol, 1,2-PDO, and 1,3-PDO) is computed under the typical experimental conditions (473 K, total pressure of 1 atm, glycerol:H2:H2O = 1:140:12) used in ref. 14, according to the standard thermodynamic equations.
3 Results
In this work we have explored extensively the common organic reactions up to four C atoms (C1–C4) on three Cu surfaces, namely, close-packed Cu(111), open Cu(100) and stepped Cu(211), by using automated SSW-RS sampling with the quaternary Cu–C–H–O G-NN potential. Our simulation yields more than 200000 reaction pairs and 24130 different intermediates, and after removing the duplicate ones, the final reaction database contains 30508 distinct reactions, 7776 reaction intermediates composed of 1188 distinct fragments/molecules, and 5136 reaction patterns.
In our AI-Cat model, the R-Pat unit learns 7776 intermediates and 5136 reaction patterns associated with them, 90% of them being set as the training set and the remainder as the testing set. The probability of occurrence of a reaction pattern is determined by the weighted rate constant in eqn (1), which is used to supervise the training. After training the model, the top 3 accuracy for predicting the most probable reaction pattern is perfect (99%) for the training set and 57% for the testing set; and the top 15 accuracy for the testing set reaches 81%.
The K-Info unit learns the reaction dataset of 30508 reactions on three different Cu surfaces. By splitting the dataset into 90% training set and 10% testing set, the NN finally achieves the accuracy of prediction with MAE of 0.061 and 0.054 eV for the reaction barrier and reaction energy on the training dataset, and MAE of 0.157 and 0.149 eV for the barrier and reaction energy on the testing dataset, respectively. For the purpose of the benchmarking of the AI-Cat model, we have first analyzed the AI-Cat accuracy on the reaction dataset and confirmed the good performance of AI-Cat for different types of reactions, which is much better than the simple BEP model (see ESI Section 5† for details). We then tested AI-Cat prediction ability for 21 different compositions by mixing 7 common small molecules, including H2, CO, CO2, H2O, CH3OH, CH4 and CH2CH2, and AI-Cat gives the correct activity prediction for the known reactions (see ESI Section 6† for details). We thus can move on to treat the concerned system with a complex reaction network, the glycerol hydrogenolysis on Cu.
By using the AI-Cat method, we are able to predict the likely hydrogenolysis pathways starting from glycerol and H2 reactants on Cu(111). After 150000 MCTS, we obtained 420 distinct intermediates and 2467 distinct elementary reactions, from which the lowest energy pathways are collected.
3.1 Reaction pathways and microkinetics of glycerol hydrolysis on Cu(111)
Our AI-Cat model predicts that 1,2-PDO is preferred over 1,3-PDO with a lower overall barrier among total eight products that have relatively low formation barriers (<1.6 eV). The key pathways are summarized in Fig. 5 and all pathway data from AI-Cat are detailed in the ESI.† Here we summarize the lowest barrier products, which are dihydroxyacetone, acetol, 1,2-PDO, prop-2-ene-1,2-diol, 2-oxopropanal, glyceraldehyde, 3-hydroxypropanal, and 1,3-PDO, where the predicted energy barrier from AI-Cat differs by less than 0.3 eV. Among these products, dihydroxyacetone and glyceraldehyde, while being facile to form, are both endothermic intermediates and can further convert to 1,2-PDO and 1,3-PDO. Acetol and 3-hydroxypropanal are intermediates leading to 1,2-PDO and 1,3-PDO, respectively. The remaining dehydration products, i.e. prop-2-ene-1,2-diol and 2-oxopropanal, are less exothermic to form than 1,2-PDO, but share the similar rate-limiting steps with 1,2-PDO. Therefore, from the AI-Cat energetics, only 1,2-PDO and 1,3-PDO are likely products for glycerol hydrogenolysis on Cu surfaces, where both molecules are thermodynamically highly favored products (exothermic by more than 0.7 eV).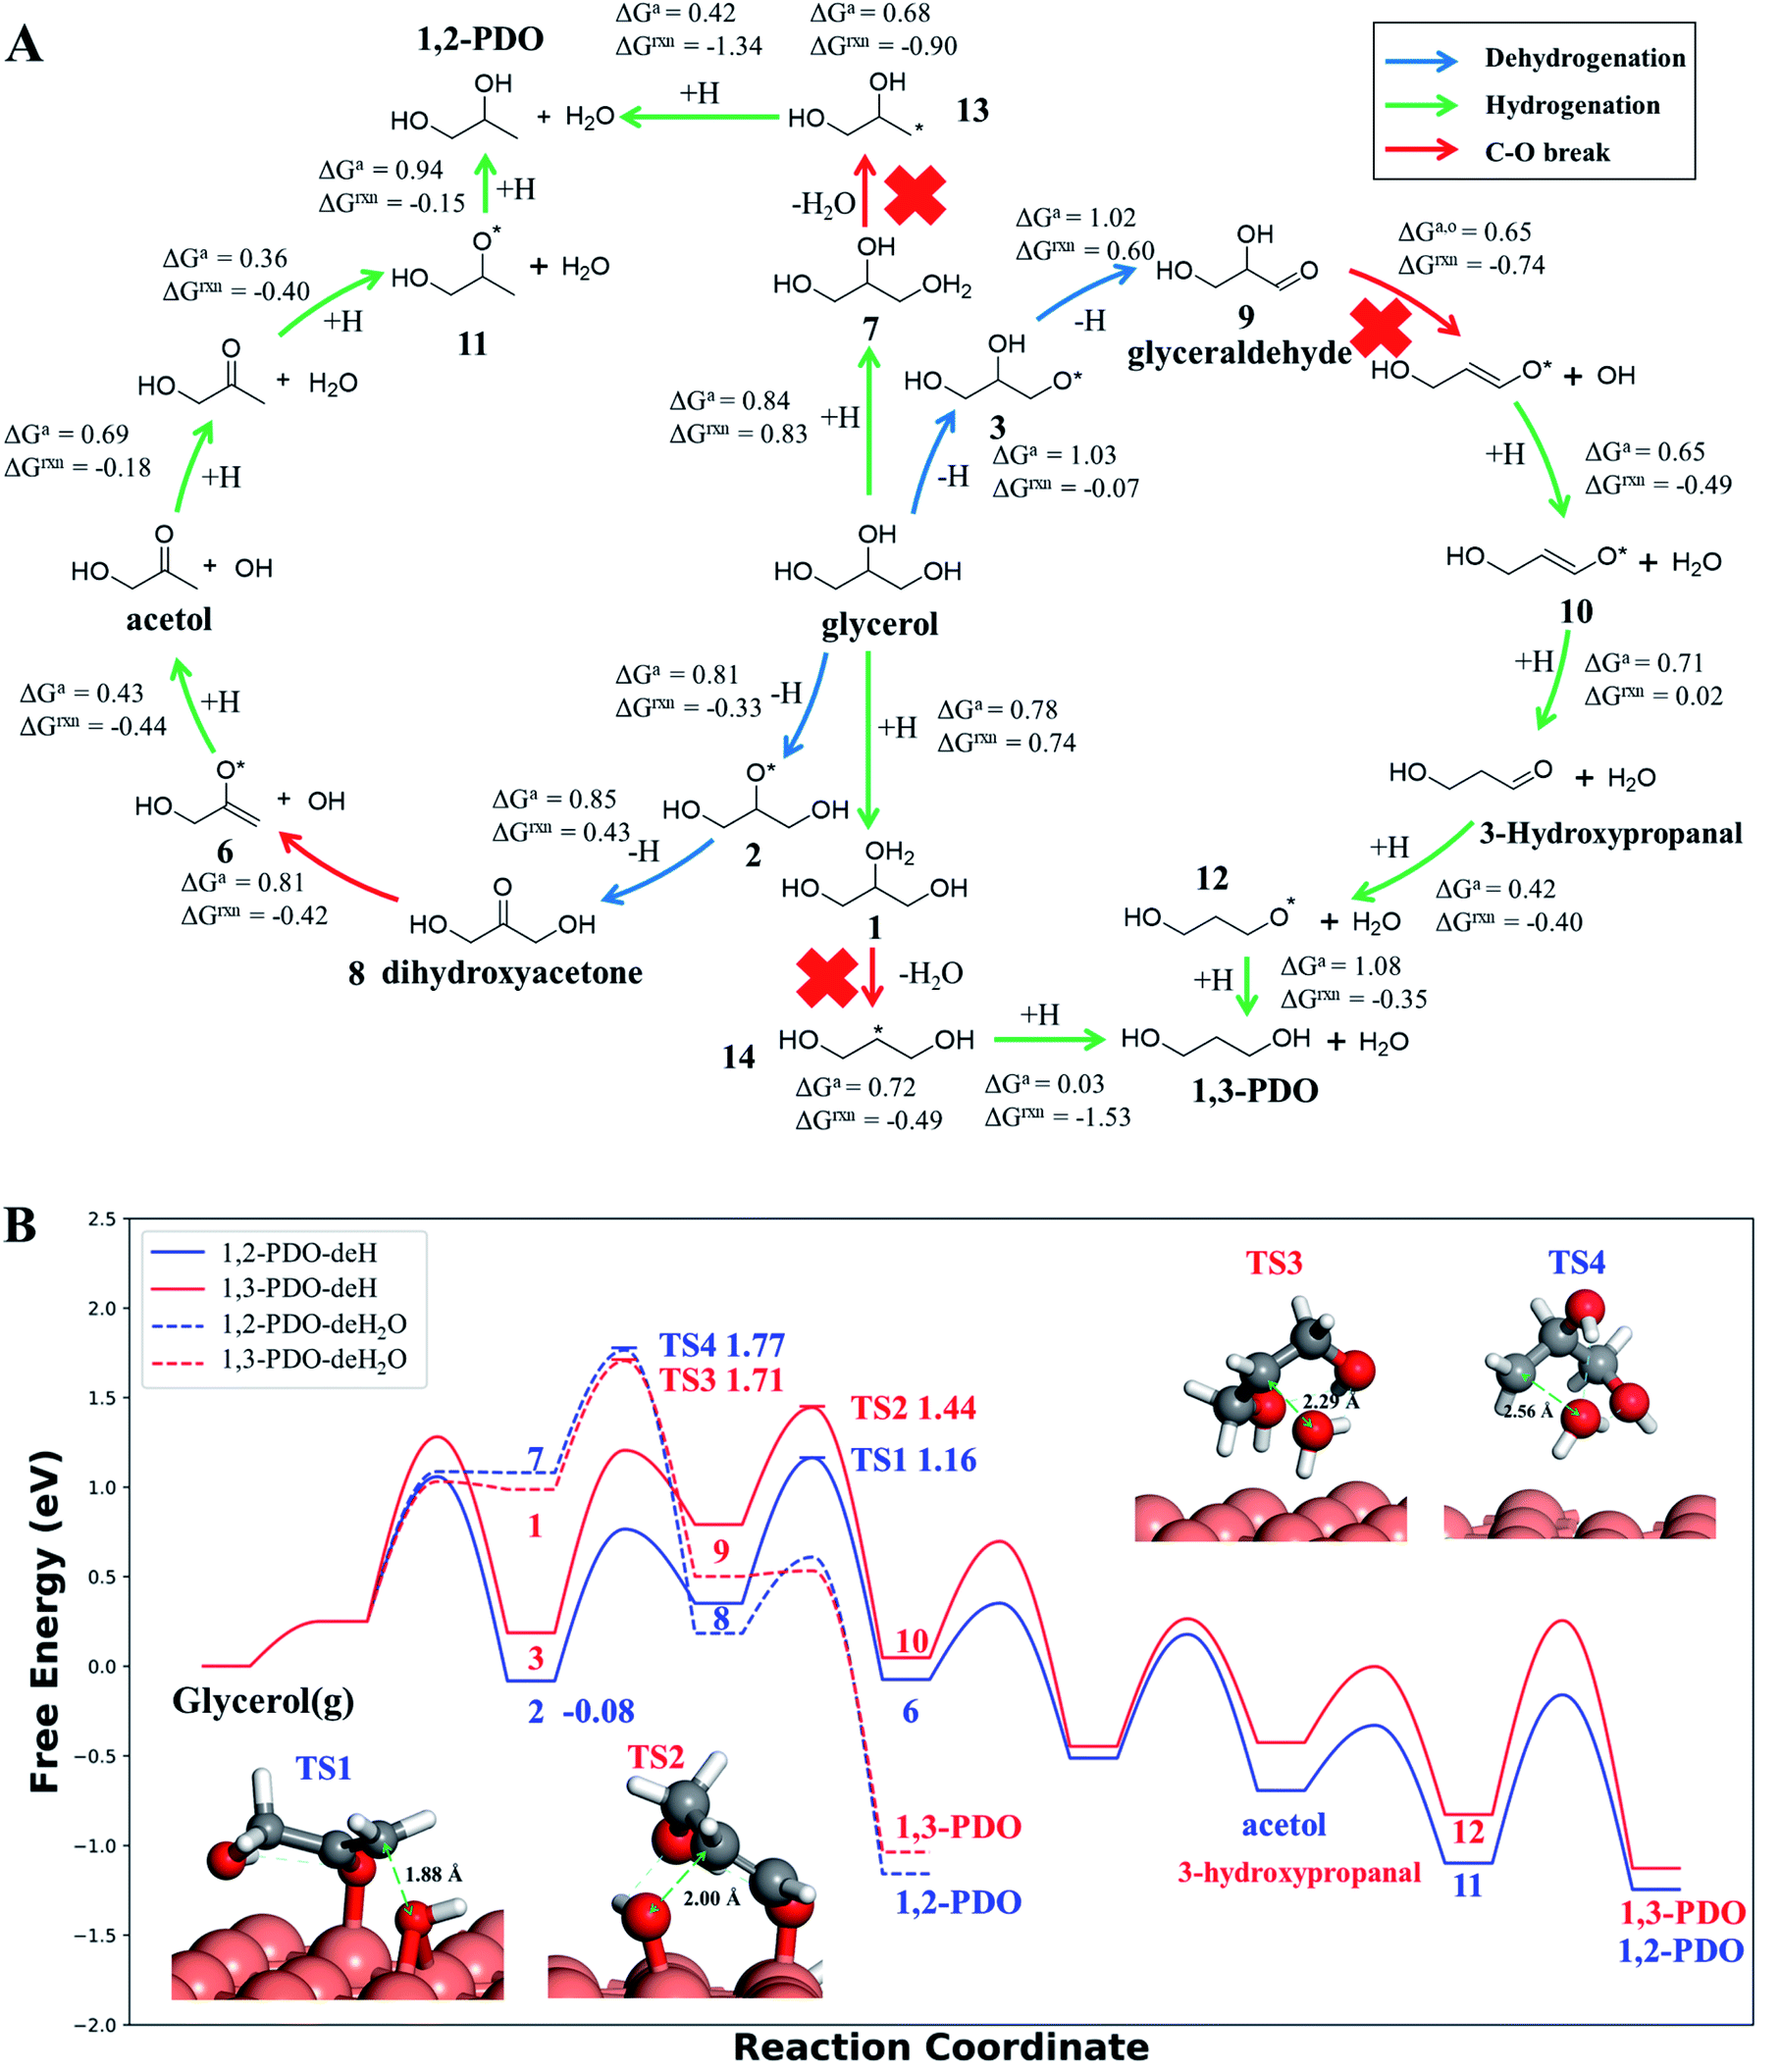 | ||
| Fig. 5 Low energy pathways of glycerol hydrogenolysis on Cu(111) to 1,2-PDO and 1,3-PDO. (A) Low energy reaction network for glycerol hydrogenolysis. The color of the arrow indicates the type of reaction, including dehydrogenation, hydrogenation and the C–O bond breaking. ΔGa,o and ΔGrxn denote the Gibbs free energy overall barrier and reaction energy in each pathway starting from glycerol, respectively (also plotted in (B)); (B) Gibbs free energy profile for four low energy pathways to 1,2-PDO and 1,3-PDO under typical experimental conditions (473 K and a total pressure of 1 atm, glycerol:H2:H2O = 1:140:12, used in ref. 14). The solid lines are the dehydrogenation (deH) pathways initiated by blue arrows in (A) and the dotted lines are the dehydration (deH2O) pathways initiated by hydrogenation (green arrow) and dehydration (red arrow) in (A). The energy zero refers to glycerol in the gas phase at 473 K and 0.0065 atm; and its dehydrogenated product, state 2 (see (A)), is the most stable species (−0.08 eV) before C–O bond breaking. The snapshots and free energy of key reaction transition states, TS1 to TS4, are also shown. | ||
In order to determine the selectivity accurately and perform the microkinetics simulation, we have further utilized DFT calculations with van der Waals correction (DFT-D3 (ref. 73)) to refine the reaction profile of the four lowest energy pathways, where all minimum structures are fully relaxed and the TSs are re-searched (the detailed comparison between G-NN and DFT energetics is detailed in the ESI, Fig. S6†). All Gibbs free energies reported hereafter are from DFT based energetics.
Both 1,2-PDO and 1,3-PDO have two low energy pathways as shown in Fig. 5, the dehydration pathway (Fig. 5a middle-to-top/bottom vertical lines) and the dehydrogenation pathway (Fig. 5a left/right circles), as distinguished by their initial steps. In addition to these four low energy pathways, 1,2-PDO also has a retro-Michael addition pathway, bifurcating from the dehydrogenation pathway to 1,3-PDO (see ESI Fig. S7†). Fig. 5b highlights the lowest energy reaction profiles for glycerol hydrogenolysis to 1,2-PDO and to 1,3-PDO, which all belong to the dehydrogenation pathway (the circles in Fig. 5a), together with the two higher barrier pathways via initial dehydration.
By analyzing the low energy pathways from AI-Cat, we can glean key information on this catalytic system. (i) The lowest barrier elementary reactions are the dehydrogenation (blue arrow in Fig. 5a) and the hydrogenation (green arrow) reactions, which are followed by the C–O bond breaking (OH or H2O removal) reactions (red arrow). As a result, in between every C–O breaking, there are a series of dehydrogenation/hydrogenation fast equilibrium steps, e.g. glycerol with dihydroxyacetone, 1,2-PDO with acetol; (ii) the secondary C is always the first reaction site for both the dehydrogenation and the direct C–O bond breaking, which is in line with the general knowledge in organic chemistry; (iii) the 1,2 β-elimination dehydration (Fig. 1) and the C–C bond breaking are kinetically prohibited on Cu surfaces. These are consistent with the general tendency to retain C–O and C–C bonds for common C1–C2 reactions on Cu catalysts as shown in ESI Table S3.†
In the lowest pathway to 1,2-PDO, the secondary OH (linking with the secondary C) of glycerol is first dehydrogenated on Cu(111) (state 2 Fig. 5a) followed by the secondary C–H bond breaking to form dihydroxyacetone, which is also the key step determining the selectivity. Next, dihydroxyacetone breaks one of its terminal OH groups via a Cu-mediated keto–enol tautomeric resonance (surface Cu replacing H in the enol form) and then undergoes a hydrogenation reaction to acetol, which is the rate-limiting step with 1.25 eV overall free energy barrier with respect to the adsorbed state 2, the most stable state along the pathway. After the C–O breaking, acetol readily converts to 1,2-PDO with three low barrier steps, involving hydrogenation and water generation. The further hydrogenolysis from acetol to 2-propanol is however kinetically prohibited (free energy barrier 1.45 eV) because of the high stability of acetol (see ESI Fig. S8† for the reaction profile of deep hydrogenolysis).
The lowest energy pathway to 1,3-PDO follows exactly the same pattern as that to 1,2-PDO except that the reaction is initiated from the primary C and the overall barrier increases by 0.2 eV. Obviously, the higher barrier in forming 1,3-PDO can be attributed to the fact that the aldehyde (glyceraldehyde) is less stable than the acetone form (dihydroxyacetone) and so does the TS for C–O bond dissociation. It should be mentioned that, as shown in ESI Fig. S7,† even if glyceraldehyde is produced, the presence of a low-barrier dehydration channel via the retro-Michael addition reaction will still favor the selectivity to 1,2-PDO.
Compared to the dehydrogenation pathways, the dehydration pathways (Fig. 5b dotted lines) generally have a higher free energy barrier, 1.71 eV to 1,3-PDO and 1.77 eV to 1,2-PDO and are thus essentially non-selective to these two products. The higher barrier is mainly due to the poor ability of the protonated glycerol precursor (states 1 and 7 in Fig. 5a) on Cu(111). From our DFT calculations, the adsorbed state 2 in the dehydrogenation pathway is 1.07 eV more stable than the protonated glycerol, in which the vibrational zero-point-energy and van der Waals interaction together account for 0.35 eV energy difference.
Microkinetics simulations based on the DFT free energy profile are then applied to compute the steady-state rate, where the species coverages are determined explicitly to compute the rate. The computation is done by solving the ordinary differential equation (ODE) of all reactions using the Backward Differentiation Formula (BDF) method.75 The simulation is under the typical reaction conditions, i.e. 473 K, pH2 = 1 bar, Pothers = 0.0065 bar (other saturated glycerol derivatives). All the kinetics data are obtained from the above results and listed in ESI Table S6.†
Our simulation results show that the major pathways of the 1,2-PDO or 1,3-PDO generation are dehydrogenation pathways, which contribute 2.1 × 10⁻⁴ s−1 and 2.3 × 10⁻⁷ s−1 for 1,2-PDO and 1,3-PDO, respectively, and the dehydration pathways are kinetically forbidden, which only contribute 1.6 × 10⁻⁹ s−1 and 6.9 × 10⁻⁹ s−1 for 1,2-PDO and 1,3-PDO, respectively. The final TOF is 2.1 × 10⁻⁴ s−1 for 1,2-PDO and 2.4 × 10⁻⁷ s−1 for 1,3-PDO, which leads to a high selectivity of 99.88% to 1,2-PDO, in agreement with the experiment selectivity of 96.1%.14,16
We would like to point out that the previous proposed pathways to 1,2-PDO (see Fig. 1) are not favored kinetically: they do not show up as the lowest energy pathways from our AI-Cat search and are also confirmed as high barrier pathways by manually checking with DFT calculations. For example, the glyceraldehyde formation followed by the retro-Michael reaction as suggested by Montassier et al.5 (black arrow in Fig. 1) has been a popular mechanism for 1,2-PDO in the literature.13,21 However, our results show that glyceraldehyde formed by the dehydrogenation at the primary C is kinetically less favored than that at the secondary C in forming dihydroxyacetone by 0.22 eV (see Fig. 5b), although the subsequent retro-Michael addition reaction is kinetically feasible. The other proposed pathways include the formation of acetol (observed intermediate in experiments) as an intermediate, but those involving either 1,2 β-elimination dehydration or direct C–O bond breaking are non-site-selective, which are readily ruled out from our AI-Cat search due to their high barriers.
3.2 Discussions on glycerol hydrolysis
Our new reaction mechanism for glycerol hydrogenolysis on Cu catalysts can rationalize the experimental observations on Cu-based catalysts reported so far, which are summarized as follows.First, acetol is a stable product together with 1,2-PDO. Ample evidence from experiments12,23 suggests that acetol is indeed generated from glycerol on Cu surfaces, instead of being a dehydrogenated product from 1,2-PDO. In particular, the selectivity could be dominated by acetol (90 mol%) when the reaction is operated in a N2 atmosphere23 (250 °C and Cu/Al2O3 catalyst). Indeed, from our results, acetol can be thermodynamically as stable as 1,2-PDO depending on H2 pressure and thus can readily desorb from Cu surfaces. The high stability of acetol also leads to further C–O bond breaking (to 2-propanol) becoming kinetically impossible and the hydrogenation to 1,2-PDO is left as the only viable route (see ESI Fig. S8†).
Second, dihydroxyacetone is a key intermediate in forming acetol and 1,2-PDO. By comparing glycerol conversions on Cu–ZnO (1:1) and Cu in a N2 atmosphere,21 Liu et al. found that both acetol and its hydrogenated form 1,2-PDO are produced in the absence of H2. This indicates that dehydrogenation should be involved in the catalysis process, which would otherwise lead only to the formation of the dehydration product (acetol) due to the lack of H supply. Our results confirm that the dehydrogenation steps are kinetically most favored on Cu surfaces and dihydroxyacetone is the precursor to acetol and 1,2-PDO.
Third, the selectivity to 1,3-PDO on Cu catalysts can be improved if the dehydration pathways are invoked which are however non-selective to 1,2-PDO and 1,3-PDO. Indeed, Huang et al. showed that the SiO2-supported Cu–H4SiW12O40 catalyst can reach a maximum 1,3-PDO selectivity of 32.1%, while 1,2-PDO selectivity is also 22.2% at 83.4% conversion.18 Similarly, Li et al. showed that 2Cu–6WOx–TiO2 can reach a maximum 1,3-PDO selectivity of 32.3%, while 1,2-PDO selectivity is 27.6% at 12.7% conversion.19 From our results, the presence of strong acidity as introduced by H4SiW12O40/WOx helps to stabilize the protonated glycerol (states 1 and 7) and thus benefit the non-selective direct dehydration pathways over the selective dehydrogenation pathways. In line with this, the high H2 pressure that depresses the dehydrogenation channel should also be effective to increase 1,3-PDO selectivity. Indeed, we note that under acidic conditions, by replacing Cu with Pt, the 1,3-PDO selectivity can be much improved,76,77 which is in line with the fact that the Pt surface can adsorb H stronger and achieve the saturated H coverage. This effectively blocks the 1,2-PDO selectivity that needs first dehydrogenation. For example, the Qiao group reported that tungsten-doped siliceous mesocellular foam supported Pt catalysts (Pt/W-MCFs) can reach a high 1,3-PDO selectivity of 65% at 423 K and H2 pressure of 4.0 MPa.77
We note that the mechanism identified here for glycerol hydrogenolysis can be readily applied to understand the dehydration of other polyols. For example, 1, 2-butanediol is reported to be selectively converted to 1-hydroxy-2-butanone (>95%) over the CuZnCrAlO (CuO:ZnO:ZrO2:Al2O3 = 12:1:2:2) catalyst at 210 °C under a N2 atmosphere.78 The selective dehydrogenation to ketone products is in line with our finding that the dehydrogenation which is kinetically favored selectively occurs at the secondary C and further dehydration is kinetically unfavored because of the high stability (similar to acetol). Similarly, 1,3-butanediol is found to be mainly converted to 4-hydroxy-2-butanone (∼42%) and 2-butanone (∼35%) over 25.0 wt% Cu–SiO2 catalyst at 250 °C under a N2 atmosphere.79 From our mechanisms, the main products should be produced from the selective secondary C–OH dehydrogenation (4-hydroxy-2-butanone) which is then followed by dehydration via the retro-Michael addition (2-butanone).
For more complex polyols, Sato et al. reported that 1,2,3-butanetriol can transform into four major products over Cu–Al2O3 catalyst at 250 °C under a N2 atmosphere,23 including 1-hydroxy-2-butanone (selectivity 21.2%), 3-hydroxy-2-butanone (15.5%), 2,3-butanedione (20.0%) and acetol (17.1%), and 1,2,4-butanetriol mainly transforms into 1-hydroxy-2-butanone (51.4%). Obviously, all main products are all ketones instead of aldehydes, which is in line with our finding that the dehydrogenation which is kinetically favored selectively occurs at the secondary C.
3.3 Low-energy C–O bond cleavage channels in general
Our AI-Cat confirms that despite the huge number of possible reaction intermediates from glycerol hydrogenolysis, the C–O bond cleavage must follow several low energy reaction patterns. This leads us to wonder how many low energy reaction channels are available for C–O bond cleavage on Cu surfaces, which should be of general significance for understanding polyol catalysis on metals in general.By analyzing our reaction database which contains 1948 reactions and 592 reaction patterns that are related to C–O bond breaking, we identified six low energy reaction patterns, which start from saturated or close-to-saturated molecules/fragments where the unsaturated bond is terminated by the surface. These six types of reactions are summarized in the left panel of Fig. 6 and ordered according to their reaction barriers on Cu surfaces. They are further elaborated in the following.
 | ||
| Fig. 6 (A) Six low-barrier C–O bond cleavage patterns (type I to VI) identified from the reaction database; (B) the charge density difference contour plot for three low-barrier C–O bond cleavage TSs that appeared in glycerol hydrogenolysis, i.e., TS of retro-Michael addition (type III), TS1 (type IV) and TS3 (type VI). Also see Fig. 5 for TS1 and TS3. The charge density difference is obtained by subtracting the total electron density of the surface and the reacting molecule from that of the TS. The isosurface density is at 0.003|e|/bohr.3 Blue: density increase; yellow: density decrease. | ||
Types I and II: the most feasible C–O bond breaking (barrier < 0.5 eV) occurs on the C atom with dual C–O bonds. This includes COOH → CO + OH (type I) and R2C(OH)OR → R2CO + HOR (type II).
Types III, IV and V: these reaction types feature a non-sp3 C (α-C) neighbouring the C–O bond, which generally have the barrier of 0.5–1 eV. This unsaturated C can either be sp2 C atom with a double-bond or a C radical site, which can adsorb on metal surfaces and is thus stabilized as a reaction intermediate. These α-C are in analogy to the allylic site or the α-site of carbonyl in organic chemistry, and the presence of catalysts stabilizes the site and makes these patterns widely present in the reaction database. Among them, both III and IV are typical examples with α-site sp2 C. Type III, RC(O)CH(R)CH2(OR) → RC(O)C(R)CH2 + *H + *OR, is the retro-Michael addition, also found in the glycerol hydrogenolysis reaction network (glyceraldehyde to 2-hydroxyacrylaldehyde); type IV, RC(O)CH2(OR) → RC(–O*)CH2 + *OR, is the keto–enol tautomerization facilitated C–O bond breaking, which is the key reaction in glycerol hydrogenolysis (dihydroxyacetone → 6); type V reaction, R2C–*CH2(OR) → R2CCH2 + *OR, can be considered as an α-C radical pattern appearing in the base catalyzed E2 elimination.
Type VI: the direct C–O bond breaking can occur by a first hydrogenation followed by dehydration with the barrier being ∼1–1.5 eV. The reaction pattern is similar to the strong-acid-promoted dehydration of alcohols in solution chemistry. This is because the metal catalyst can act as the electron reservoir to store the extra electron from H to allow the protonation of the alcohol.
To better understand how the surface promotes the C–O bond breaking reactions, we have analyzed the electronic structures for three reaction types appearing in glycerol hydrogenolysis, i.e. TS1 in Fig. 5 (type III), TS from glyceraldehyde to 2-hydroxyacrylaldehyde in ESI Fig. S7† (type IV, a retro-Michael addition mechanism) and TS3 in Fig. 5 (type VI). The charge density difference isosurface contour plot for these TSs are shown in the right panel of Fig. 6, which are obtained by subtracting the total charge density of the surface and the reacting molecule from that of the TS.
We found that in type III and IV patterns the Cu surface gives rise to strong covalent bonding with the reacting molecule. Specifically, in type III the Cu–O bond at O1 helps to stabilize the enol precursor and thus facilitates the retro-Michael addition. Similarly, in type IV (TS1) the Cu–O bond at the O2 site donates an electron to the carbonyl O atom and thus assists the keto–enol tautomerization to form the C–C π–π interaction. In contrast, in the type VI reaction, there is no obvious orbital mixing between the surface and the reacting molecule, instead the surface acts as an electron acceptor to stabilize the hydrogenated molecule, leading to the protonated TS.
4 Conclusion
By developing a general-purpose activity predictor for heterogeneous catalysis, the AI-Cat method, this work provides a new perspective to the long-standing puzzles on the high selectivity of glycerol hydrogenolysis to 1,2-PDO on Cu catalysts, and points out the directions to optimize the selectivity towards 1,3-PDO. Our AI-Cat method is an end-to-end approach to resolve the reaction profile from simple inputs (e.g. glycerol, H2 molecules and Cu catalyst). It predicts correctly the kinetic preference of 1,2-PDO production in glycerol hydrogenolysis, which features the Cu-mediated enol–keto tautomeric resonance to facilitate the primary C–OH bond breaking at dihydroxyacetone. The overall barrier to 1,2-PDO is 0.20 eV lower than that to 1,3-PDO on Cu(111). Six low energy C–O bond cleavage channels are discovered from the reaction database, which is of general significance for polyol catalysis on metals. We demonstrate that AI-Cat possesses high efficiency and much better accuracy than traditional BEP relationship approaches in reaction prediction. The age for automated reaction prediction in heterogeneous catalysis is now coming.Data availability
The database for reactions on Cu surfaces and the trained NN models is available on the website (https://github.com/lasphub/AI-Cat).Code availability
The AI-Cat code is openly available on the website (https://github.com/lasphub/AI-Cat).Author contributions
Z. P. L. conceived the project and contributed to the design of the calculations and analyses of the data. P. L. K. wrote the AI-Cat/lasp code and carried out most of the calculations and wrote the draft of the paper. S. C. wrote the SSW/lasp code and contributed to the analysis of the data. Y. F. S. wrote the microkinetics simulations code and analyzed the microkinetics results. All authors discussed the results and commented on the manuscripts.Conflicts of interest
There are no conflicts to declare.Acknowledgements
This work was supported by the National Key Research and Development Program of China (2018YFA0208600), National Science Foundation of China (12188101, 22033003, 91945301, 91745201, 92145302, 22122301, and 92061112) and the Tencent Foundation for XPLORER PRIZE.References
- G. W. Huber, J. W. Shabaker and J. A. Dumesic, Science, 2003, 300, 2075–2077 CrossRef CAS PubMed.
- A. Corma, S. Iborra and A. Velty, Chem. Rev., 2007, 107, 2411–2502 CrossRef CAS PubMed.
- D. M. Alonso, S. G. Wettstein and J. A. Dumesic, Chem. Soc. Rev., 2012, 41, 8075 RSC.
- J. N. Chheda, G. W. Huber and J. A. Dumesic, Angew. Chem., Int. Ed., 2007, 46, 7164–7183 CrossRef CAS PubMed.
- C. Montassier, D. Giraud and J. Barbier, in Studies in Surface Science and Catalysis, Elsevier, 1988, vol. 41, pp. 165–170 Search PubMed.
- A. M. Ruppert, K. Weinberg and R. Palkovits, Angew. Chem., Int. Ed., 2012, 51, 2564–2601 CrossRef CAS PubMed.
- D. Sun, Y. Yamada, S. Sato and W. Ueda, Appl. Catal., B, 2016, 193, 75–92 CrossRef CAS.
- S. Wang, K. Yin, Y. Zhang and H. Liu, ACS Catal., 2013, 3, 2112–2121 CrossRef CAS.
- C.-W. Chiu, M. A. Dasari, G. J. Suppes and W. R. Sutterlin, AIChE J., 2006, 52, 3543–3548 CrossRef CAS.
- D. Coll, F. Delbecq, Y. Aray and P. Sautet, Phys. Chem. Chem. Phys., 2011, 13, 1448–1456 RSC.
- S. Sato, M. Akiyama, R. Takahashi, T. Hara, K. Inui and M. Yokota, Appl. Catal., A, 2008, 347, 186–191 CrossRef CAS.
- M. A. Dasari, P.-P. Kiatsimkul, W. R. Sutterlin and G. J. Suppes, Appl. Catal., A, 2005, 281, 225–231 CrossRef CAS.
- X. Zhang, G. Cui, H. Feng, L. Chen, H. Wang, B. Wang, X. Zhang, L. Zheng, S. Hong and M. Wei, Nat. Commun., 2019, 10, 5812 CrossRef CAS PubMed.
- S. Sato, M. Akiyama, K. Inui and M. Yokota, Chem. Lett., 2009, 38, 560–561 CrossRef CAS.
- Z. Yuan, L. Wang, J. Wang, S. Xia, P. Chen, Z. Hou and X. Zheng, Appl. Catal., B, 2011, 101, 431–440 CrossRef CAS.
- M. Akiyama, S. Sato, R. Takahashi, K. Inui and M. Yokota, Appl. Catal., A, 2009, 371, 60–66 CrossRef CAS.
- M. Chia, Y. J. Pagán-Torres, D. Hibbitts, Q. Tan, H. N. Pham, A. K. Datye, M. Neurock, R. J. Davis and J. A. Dumesic, J. Am. Chem. Soc., 2011, 133, 12675–12689 CrossRef CAS PubMed.
- L. Huang, Y. Zhu, H. Zheng, G. Ding and Y. Li, Catal. Lett., 2009, 131, 312–320 CrossRef CAS.
- D. Li, Z. Zhou, J. Qin, Y. Li, Z. Liu and W. Wu, ChemistrySelect, 2018, 3, 2479–2486 CrossRef CAS.
- A. D. da Silva Ruy, R. M. de Brito Alves, T. L. Reis Hewer, D. de Aguiar Pontes, L. S. Gomes Teixeira and L. A. Magalhães Pontes, Catal. Today, 2021, 381, 243–253 CrossRef CAS.
- S. Wang, Y. Zhang and H. Liu, Chem.–Asian J., 2010, 5, 1100–1111 CrossRef CAS PubMed.
- J. ten Dam and U. Hanefeld, ChemSusChem, 2011, 4, 1017–1034 CrossRef PubMed.
- S. Sato, M. Akiyama, R. Takahashi, T. Hara, K. Inui and M. Yokota, Appl. Catal., A, 2008, 347, 186–191 CrossRef CAS.
- L. J. Broadbelt, S. M. Stark and M. T. Klein, Ind. Eng. Chem. Res., 1994, 33, 790–799 CrossRef CAS.
- D. J. Klinke II and L. J. Broadbelt, Chem. Eng. Sci., 1999, 54, 3379–3389 CrossRef.
- C. W. Gao, J. W. Allen, W. H. Green and R. H. West, Comput. Phys. Commun., 2016, 203, 212–225 CrossRef CAS.
- C. F. Goldsmith and R. H. West, J. Phys. Chem. C, 2017, 121, 9970–9981 CrossRef CAS.
- S. Rangarajan, A. Bhan and P. Daoutidis, Comput. Chem. Eng., 2012, 45, 114–123 CrossRef CAS.
- U. Gupta and D. G. Vlachos, J. Chem. Inf. Model., 2021, 61, 3431–3441 CrossRef CAS PubMed.
- A. Michaelides, Z.-P. Liu, C. J. Zhang, A. Alavi, D. A. King and P. Hu, J. Am. Chem. Soc., 2003, 125, 3704–3705 CrossRef CAS PubMed.
- T. Bligaard, J. K. Nørskov, S. Dahl, J. Matthiesen, C. H. Christensen and J. Sehested, J. Catal., 2004, 224, 206–217 CrossRef CAS.
- F. Abild-Pedersen, J. Greeley, F. Studt, J. Rossmeisl, T. R. Munter, P. G. Moses, E. Skúlason, T. Bligaard and J. K. Nørskov, Phys. Rev. Lett., 2007, 99, 016105 CrossRef CAS PubMed.
- S. Wang, V. Petzold, V. Tripkovic, J. Kleis, J. G. Howalt, E. Skúlason, E. M. Fernández, B. Hvolbæk, G. Jones, A. Toftelund, H. Falsig, M. Björketun, F. Studt, F. Abild-Pedersen, J. Rossmeisl, J. K. Nørskov and T. Bligaard, Phys. Chem. Chem. Phys., 2011, 13, 20760 RSC.
- Z. W. Ulissi, A. J. Medford, T. Bligaard and J. K. Nørskov, Nat. Commun., 2017, 8, 14621 CrossRef PubMed.
- E. Shustorovich, Surf. Sci. Rep., 1998, 31, 1–119 CrossRef CAS.
- I. Fishtik and R. Datta, Surf. Sci., 2002, 512, 229–254 CrossRef CAS.
- P. M. Zimmerman, J. Comput. Chem., 2013, 34, 1385–1392 CrossRef CAS PubMed.
- T. Gu, B. Wang, S. Chen and B. Yang, ACS Catal., 2020, 10, 6346–6355 CrossRef CAS.
- X.-J. Zhang, C. Shang and Z.-P. Liu, J. Chem. Phys., 2017, 147, 152706 CrossRef PubMed.
- S. Maeda, T. Taketsugu and K. Morokuma, J. Comput. Chem., 2014, 35, 166–173 CrossRef CAS PubMed.
- Q. Zhao and B. M. Savoie, Nat. Comput. Sci., 2021, 1, 479–490 CrossRef.
- C. A. Grambow, A. Jamal, Y.-P. Li, W. H. Green, J. Zádor and Y. V. Suleimanov, J. Am. Chem. Soc., 2018, 140, 1035–1048 CrossRef CAS PubMed.
- S. Ma, C. Shang and Z.-P. Liu, J. Chem. Phys., 2019, 151, 050901 CrossRef.
- B. Mikulak-Klucznik, P. Gołębiowska, A. A. Bayly, O. Popik, T. Klucznik, S. Szymkuć, E. P. Gajewska, P. Dittwald, O. Staszewska-Krajewska, W. Beker, T. Badowski, K. A. Scheidt, K. Molga, J. Mlynarski, M. Mrksich and B. A. Grzybowski, Nature, 2020, 588, 83–88 CrossRef CAS PubMed.
- M. H. S. Segler, M. Preuss and M. P. Waller, Nature, 2018, 555, 604–610 CrossRef CAS PubMed.
- J. L. Baylon, N. A. Cilfone, J. R. Gulcher and T. W. Chittenden, J. Chem. Inf. Model., 2019, 59, 673–688 CrossRef CAS PubMed.
- B. Liu, B. Ramsundar, P. Kawthekar, J. Shi, J. Gomes, Q. Luu Nguyen, S. Ho, J. Sloane, P. Wender and V. Pande, ACS Cent. Sci., 2017, 3, 1103–1113 CrossRef CAS PubMed.
- M. H. S. Segler and M. P. Waller, Chem.–Eur. J., 2017, 23, 5966–5971 CrossRef CAS PubMed.
- C. W. Coley, R. Barzilay, T. S. Jaakkola, W. H. Green and K. F. Jensen, ACS Cent. Sci., 2017, 3, 434–443 CrossRef CAS PubMed.
- P. Schwaller, T. Laino, T. Gaudin, P. Bolgar, C. A. Hunter, C. Bekas and A. A. Lee, ACS Cent. Sci., 2019, 5, 1572–1583 CrossRef CAS PubMed.
- A. F. Zahrt, J. J. Henle, B. T. Rose, Y. Wang, W. T. Darrow and S. E. Denmark, Science, 2019, 363, eaau5631 CrossRef CAS PubMed.
- C. W. Coley, W. H. Green and K. F. Jensen, Acc. Chem. Res., 2018, 51, 1281–1289 CrossRef CAS PubMed.
- C. W. Coley, N. S. Eyke and K. F. Jensen, Angew. Chem., Int. Ed., 2020, 59, 22858–22893 CrossRef CAS PubMed.
- C. W. Coley, W. Jin, L. Rogers, T. F. Jamison, T. S. Jaakkola, W. H. Green, R. Barzilay and K. F. Jensen, Chem. Sci., 2019, 10, 370–377 RSC.
- J. N. Wei, D. Duvenaud and A. Aspuru-Guzik, ACS Cent. Sci., 2016, 2, 725–732 CrossRef CAS PubMed.
- P. Schwaller, T. Gaudin, D. Lányi, C. Bekas and T. Laino, Chem. Sci., 2018, 9, 6091–6098 RSC.
- D. Weininger, J. Chem. Inf. Model., 1988, 28, 31–36 CrossRef CAS.
- D. Rogers and M. Hahn, J. Chem. Inf. Model., 2010, 50, 742–754 CrossRef CAS PubMed.
- S.-D. Huang, C. Shang, X.-J. Zhang and Z.-P. Liu, Chem. Sci., 2017, 8, 6327–6337 RSC.
- S.-D. Huang, C. Shang, P.-L. Kang and Z.-P. Liu, Chem. Sci., 2018, 9, 8644–8655 RSC.
- S. Huang, C. Shang, P. Kang, X. Zhang and Z. Liu, Wiley Interdiscip. Rev.: Comput. Mol. Sci., 2019, 9, e1415 CAS.
- C. Shang and Z.-P. Liu, J. Chem. Theory Comput., 2013, 9, 1838–1845 CrossRef CAS PubMed.
- X.-J. Zhang and Z.-P. Liu, Phys. Chem. Chem. Phys., 2015, 17, 2757–2769 RSC.
- P.-L. Kang and Z.-P. Liu, iScience, 2021, 24, 102013 CrossRef PubMed.
- P.-L. Kang, C. Shang and Z.-P. Liu, J. Am. Chem. Soc., 2019, 141, 20525–20536 CrossRef CAS PubMed.
- C. D. Christ, M. Zentgraf and J. M. Kriegl, J. Chem. Inf. Model., 2012, 52, 1745–1756 CrossRef CAS PubMed.
- A. Bøgevig, H.-J. Federsel, F. Huerta, M. G. Hutchings, H. Kraut, T. Langer, P. Löw, C. Oppawsky, T. Rein and H. Saller, Org. Process Res. Dev., 2015, 19, 357–368 CrossRef.
- D. Silver, A. Huang, C. J. Maddison, A. Guez, L. Sifre, G. van den Driessche, J. Schrittwieser, I. Antonoglou, V. Panneershelvam, M. Lanctot, S. Dieleman, D. Grewe, J. Nham, N. Kalchbrenner, I. Sutskever, T. Lillicrap, M. Leach, K. Kavukcuoglu, T. Graepel and D. Hassabis, Nature, 2016, 529, 484–489 CrossRef CAS PubMed.
- S. Kozuch and S. Shaik, Acc. Chem. Res., 2011, 44, 101–110 CrossRef CAS PubMed.
- P. Kang, C. Shang and Z. Liu, Chin. J. Chem. Phys., 2021, 34, 583–590 CrossRef CAS.
- G. Kresse and J. Furthmüller, Comput. Mater. Sci., 1996, 6, 15–50 CrossRef CAS.
- G. Kresse and D. Joubert, Phys. Rev. B, 1999, 59, 1758–1775 CrossRef CAS.
- S. Grimme, J. Antony, S. Ehrlich and H. Krieg, J. Chem. Phys., 2010, 132, 154104 CrossRef PubMed.
- V. Wang, N. Xu, J.-C. Liu, G. Tang and W.-T. Geng, Comput. Phys. Commun., 2021, 267, 108033 CrossRef CAS.
- G. D. Byrne and A. C. Hindmarsh, ACM Trans. Math Software, 1975, 1, 71–96 CrossRef.
- J. Oh, S. Dash and H. Lee, Green Chem., 2011, 13, 2004 RSC.
- S. Cheng, Y. Fan, X. Zhang, Y. Zeng, S. Xie, Y. Pei, G. Zeng, M. Qiao and B. Zong, Appl. Catal., B, 2021, 297, 120428 CrossRef CAS.
- S. Sato, R. Takahashi, T. Sodesawa, H. Fukuda, T. Sekine and E. Tsukuda, Catal. Commun., 2005, 6, 607–610 CrossRef CAS.
- P. A. Torresi, V. K. Díez, P. J. Luggren and J. I. Di Cosimo, Appl. Catal., A, 2013, 458, 119–129 CrossRef CAS.
Footnote |
| † Electronic supplementary information (ESI) available: Summary of the experimental data of glycerol hydrogenolysis on Cu-based catalysts; SSW-NN method for dataset generation and G-NN potential training; methodology for reaction rule extraction; training of NN models for R-Pat and K-Info units; reaction database analysis for catalytic reactions on Cu surfaces; validation of AI-Cat predicted reactions on Cu surfaces; benchmark of G-NN PES accuracy; all pathway data on glycerol hydrogenolysis from AI-Cat and from DFT; kinetics data used in microkinetics simulation. XYZ coordinates for all the structures in Fig. 5 (PDF). See https://doi.org/10.1039/d2sc02107b |
| This journal is © The Royal Society of Chemistry 2022 |