DOI:
10.1039/D2RA07613F
(Paper)
RSC Adv., 2022,
12, 35950-35958
Achieving vibrational energies of diatomic systems with high quality by machine learning improved DFT method
Received
30th November 2022
, Accepted 8th December 2022
First published on 15th December 2022
Abstract
When using ab initio methods to obtain high-quality quantum behavior of molecules, it often involves a lot of trial-and-error work in algorithm design and parameter selection, which requires enormous time and computational resource costs. In the study of vibrational energies of diatomic molecules, we found that starting from a low-precision DFT model and then correcting the errors using the high-dimensional function modeling capabilities of machine learning, one can considerably reduce the computational burden and improve the prediction accuracy. Data-driven machine learning is able to capture subtle physical information that is missing from DFT approaches. The results of 12C16O, 24MgO and Na35Cl show that, compared with CCSD(T)/cc-pV5Z calculation, this work improves the prediction accuracy by more than one order of magnitude, and reduces the computation cost by more than one order of magnitude.
1 Introduction
Diatomic molecules and their corresponding energy spectra are widely used in astrophysics, ultracold molecules, fundamental physical constants and thus on.1–5 Various experimental techniques have been developed for high-precision spectra measurement such as velocity modulation laser spectroscopy (VMS),6 noise immune cavity enhanced optical heterodyne molecular spectroscopy (NICE-OHMS),7 laser-induced breakdown spectroscopy (LIBS)8 and so forth. However, limited by experimental conditions, generally only part of the energy levels corresponding to lower quantum numbers can be measured accurately. In the theoretical side, there are two main options: (1) ab initio methods based on the principles of quantum mechanics, such as Hartree Fock and its extension, DFT, etc.9–13 The post-Hartree Fock methods like multireference configuration interaction methods have decent performance in accuracy, whereas the steep computation cost and lengthy time make them limited to small systems.12,14,15 The DFT method is compromised in accuracy, but it has rapid calculation speed, which makes it the first choice for the calculation of large systems.16–18 In order to improve the performance of DFT, both general and accurate exchange-correlation functionals and basis set are required,16,18–20 which is still a challenge to us.18,21,22 (2) Data driven algorithms, such as empirical potential energy function and direct parameter formulas for energy levels.23,24 The accuracy of data driven algorithms are higher than ab initio methods except that they are only applicable to some molecular systems which have superior-quality experimental data.
Recently, the machine learning algorithm has made many achievements in spectroscopy study.25–27 In this work, machine learning algorithm was applied to improve the performance of DFT in the study of diatomic vibrational spectrum. To obtain the best prediction, three widely used machine learning regression algorithms were tested with H35Cl as an example. Then, the best performing algorithm was used to predict the vibrational energy levels of 12C16O, 24MgO, and Na35Cl. Finally, the spectral quality of many systems (24MgO, HF, N2, H35Cl, Na35Cl, 12C16O, BeH, and SiN et al.) were greatly improved.
2 Theory and method
2.1 DFT for vibrational energies
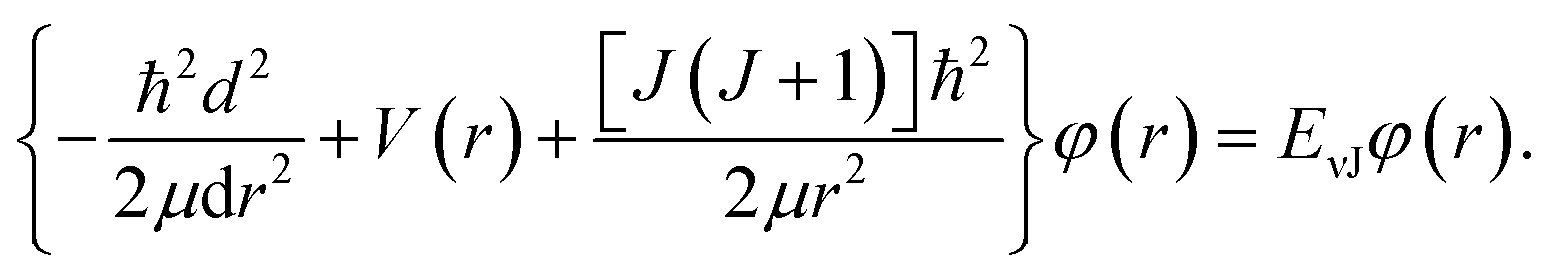
For the purpose of obtain the vibrational energy spectrum of diatomic molecules systems, it is inevitable to solve the Schrodinger equation (r and R denote the electronic and the nuclear coordinate, respectively),where Ĥ, E and Ψ(r, R) represent the Hamiltonian of the system, total energy and wave function, respectively. It is worth noting that the wave function must be first order continuous differentiable, square integrable, and so on, which makes the partial solutions of the Schrodinger equation called mathematical but nonphysical.28 In other words, the wave function is the result of approximation. Then, when studying the radial motion of the binuclear system, taking nonrelativistic approximation and Born–Oppenheimer approximation (BOA) into consider, eqn (1) can be simplified to| |
 | (2) |
where ℏ = h/2π (h is the Planck constant), μ is the reduced mass of two nucleus, J is total angular momentum quantum number, r is internuclear distance, and V(r) corresponds to the electrostatic interaction of all the particles.23 One problem is that the exchange–correlation energy has no universal accurate form,29 which introduces error to results. Finally, the ro-vibrational energy level EνJ can be expressed asand| |
 | (4) |
| |
 | (5) |
While J = 0, EνJ degenerates to Gν, namely vibrational energy level.30
A conclusion is drawn that obtaining the vibrational energy levels of molecules, a large quantity of approximations need to be included, and various approximations affect each other. Error is often unavoidable and difficult to predict in advance.
2.2 Combining machine learning algorithm and DFT
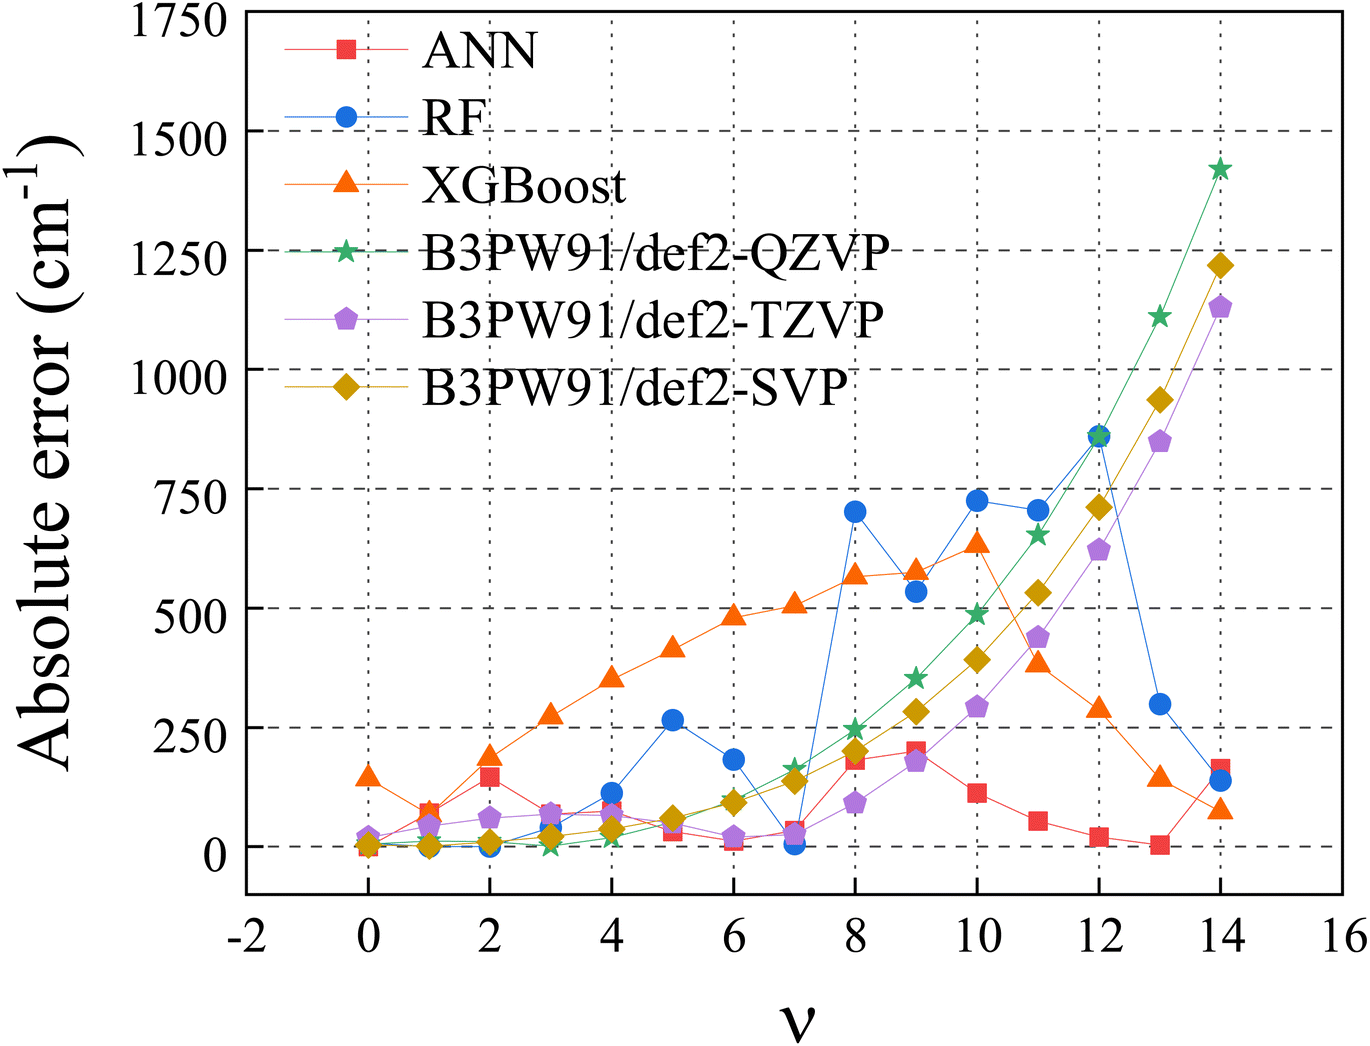
2.2.1 Machine learning algorithm. Among a variety of machine learning (ML) regression algorithms, artificial neural network (ANN),31,32 random forest (RF)33,34 and extreme gradient boosting (XGBoost)35 algorithms were widely used and usually found successful. All three algorithms have been tested in this work for vibrational energy prediction. The results were compared in the Fig. 1. The absolute error is the predicted values minus the experimental values. Clearly, ANN performs the best. Thus, it is the algorithm used in this work.
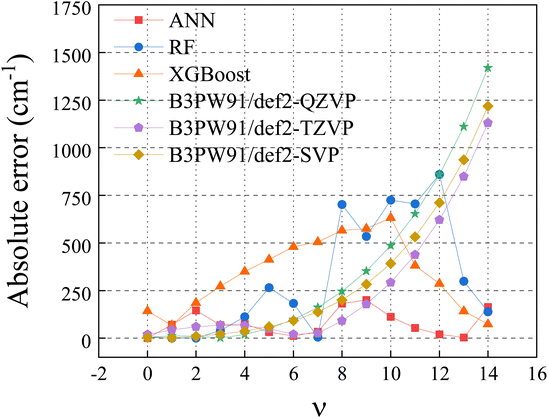 |
| | Fig. 1 Absolute error of H35Cl in ML algorithms and DFT methods. | |
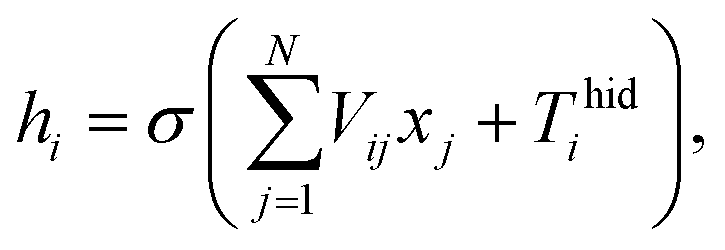
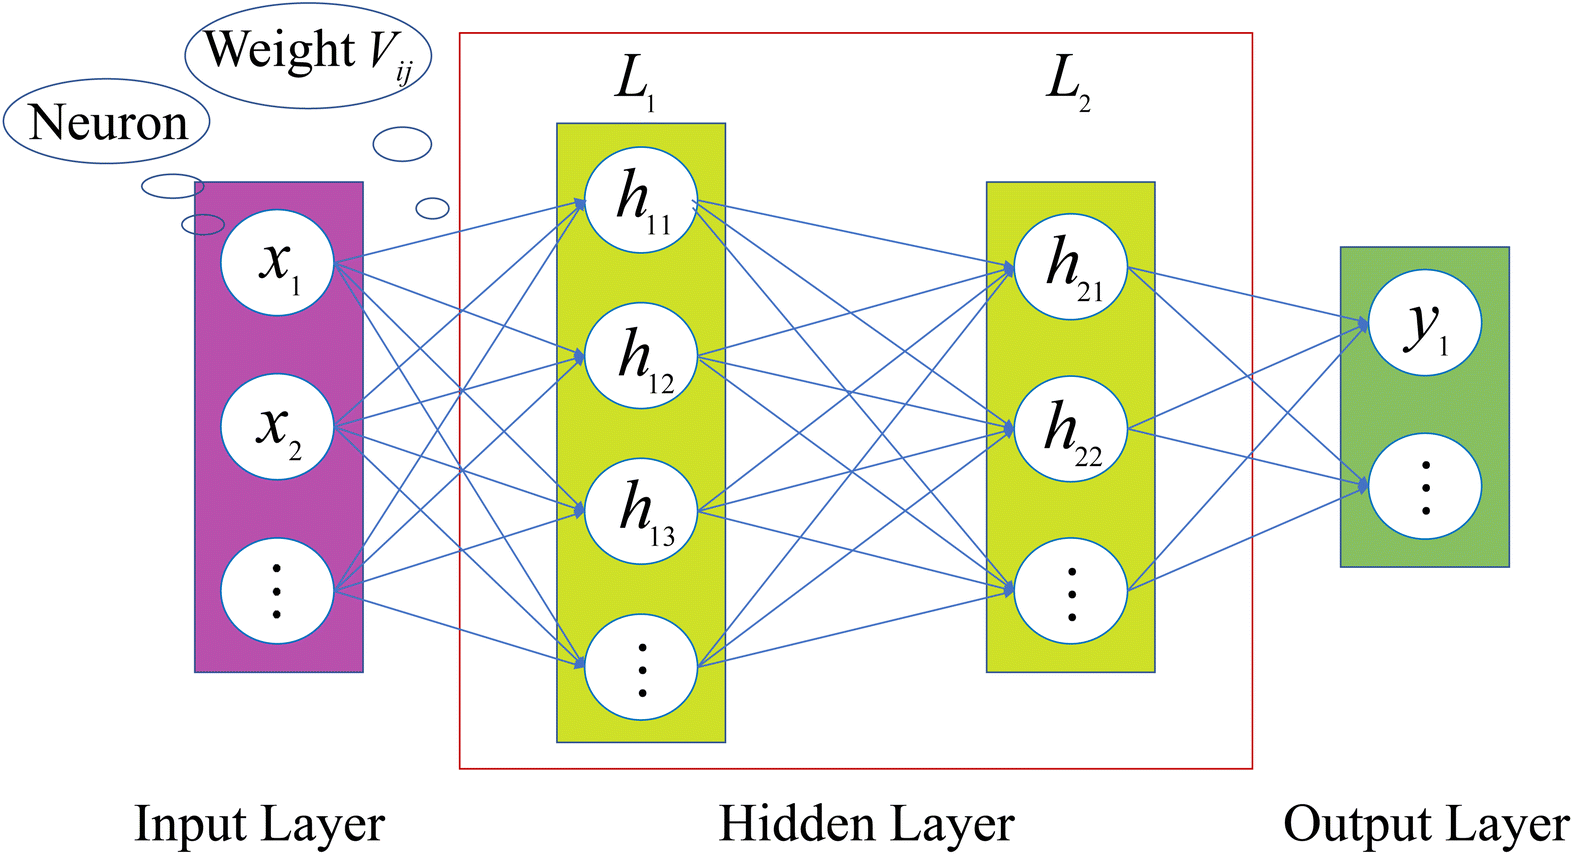
An ANN consists of an input layer of neurons, followed by many hidden layers (two, three or more layers are all fine), and a final layer of output neurons. Neurons are connected by weights Vij. Given the input, xj, the output, hi, of neuron i is,
| |
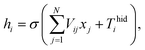 | (6) |
where
σ(*) is called activation function,
N is the number of input neurons, and
Thidi is the threshold term of the neurons.
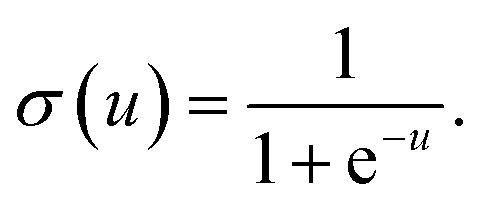
31 It is worth noting that activation function not only introduces nonlinearity into the neural network, but also constrains the value of neurons to prevent the ANN from being paralyzed by divergent neurons. And a common example of the activation function is the sigmoid function,
31 defined as
| |
 | (7) |
The architecture is shown in Fig. 2. When ANN is used to establish a high-dimensional functional relationship between input and output variables, the data samples will be divided into three groups, namely training set, validation set, and test set. For convenience, the training set and the validation set are also called sub-sample set uniformly. Similar to how humans learn through feedback, neural networks obtain training errors through their performance on the training set. Then, the weights between the connected neurons are adjusted for learning, which reduces the training error. The performance of ANN on the validation set is tracked during the learning process. And the one that performs the best is selected as the chosen model. Finally, the test set is used to determine the performance level of the ANN.31
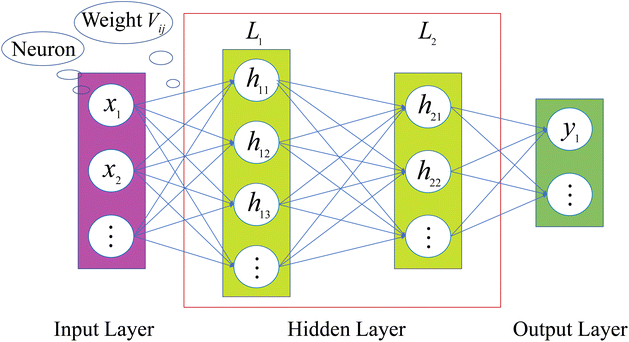 |
| | Fig. 2 Architecture of an ANN. | |
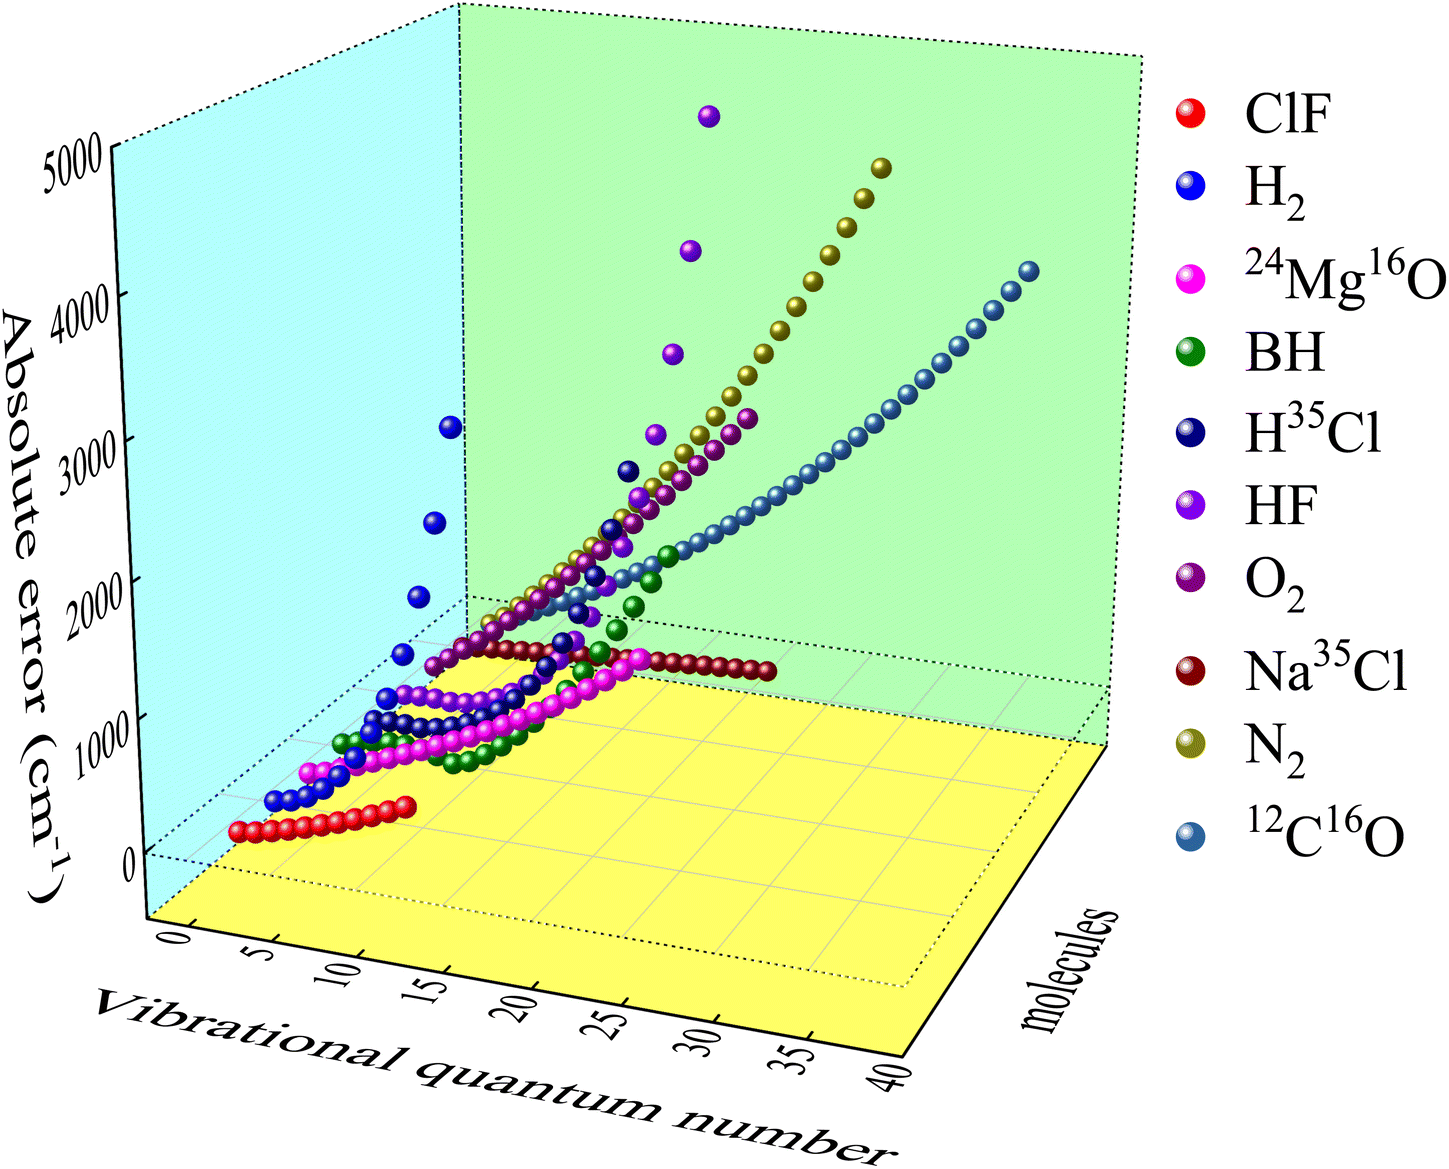
2.2.2 Prediction of vibrational energies. By analyzing the error data between DFT and experimental results, a definite and clear trend is found. It is illustrated in Fig. 3 (take B3PW91/def2-QZVP as an example) that higher vibrational quantum number means greater error, and the error trajectories of different molecules are similar. The absolute error here is the theoretical vibrational energy minus the experiment value. This trend law with abundant details can be learned by ML method. Therefore, after getting the theoretical value Eabv of the DFT methods and the corresponding experimental results, the systematic error Esysv of DFT methods can be obtained through ANN. Ultimately, the predicted vibrational energy Eν is defined as| | |
Ev(α) = Eabv + Esysv(α),
| (8) |
where α represents the kind of diatomic molecular system. It's worth noting that Esysv(α) is an error function associated with molecules. So that it is not a fixed constant.
 |
| | Fig. 3 Systematic error of B3PW91/def2-QZVP in vibrational energy levels prediction. | |
3 Results and discussion
3.1 Obtain initial sample set
The potential energy curves of 39 molecules, such as H2, 12C16O, ClF, et al., were obtained by Gaussian 09 (ref. 36) with B3PW91/def2-XVP (where X = QZ, TZ or S). Then Eabv was obtained by solving eqn (2) by LEVEL.37 The corresponding data of partial experimental vibration energy levels38–59 are displayed in Table 1 as the initial sample set. Finally, the predicted vibrational energy and relative deviation δ of the molecules are obtained through ANN. And the expression of δ is:| |
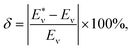 | (9) |
where  represents the theoretical energy (the value of DFT or ANN), Eν represents the experimental value. The input characteristic variables are shown below:
Table 1 Partial experimental vibrational energy levels of molecules in the ground state (cm−1)
| ν |
BH |
12C16O |
12C17O |
12C18O |
13C16O |
13C17O |
13C18O |
14C16O |
| 0 |
1171.08 |
1081.77 |
1068.03 |
1055.71 |
1057.72 |
1043.66 |
1031.05 |
1036.74 |
| 1 |
3440.30 |
3225.04 |
3184.32 |
3147.84 |
3153.79 |
3112.11 |
3074.74 |
3091.61 |
| 2 |
5614.11 |
5341.83 |
5274.81 |
5214.74 |
5224.54 |
5155.92 |
5094.38 |
5122.15 |
| 3 |
7694.67 |
7432.21 |
7339.54 |
7256.48 |
7270.04 |
7175.14 |
7090.03 |
7128.44 |
| 4 |
9684.16 |
9496.24 |
9378.60 |
9273.14 |
9290.35 |
9169.83 |
9061.73 |
9110.52 |
| ν |
14C17O |
14C18O |
24Mg16O |
25Mg16O |
26Mg16O |
SO |
AlO |
BeH |
| 0 |
1022.39 |
1009.51 |
391.14 |
388.01 |
385.10 |
576.94 |
488.00 |
1021.30 |
| 1 |
3049.05 |
3010.88 |
1165.88 |
1156.60 |
1147.99 |
1740.42 |
1453.40 |
3008.15 |
| 2 |
5052.07 |
4989.20 |
1930.32 |
1915.05 |
1900.90 |
2916.75 |
2404.76 |
4921.11 |
| 3 |
7031.50 |
6944.51 |
2684.16 |
2663.08 |
2643.55 |
4105.98 |
3342.12 |
6760.67 |
| 4 |
8987.38 |
8876.87 |
3427.11 |
3400.42 |
3375.67 |
5308.16 |
4265.42 |
8527.35 |
| ν |
BeD |
BeT |
BF |
ClF |
H35Cl |
H37Cl |
D35Cl |
D37Cl |
| 0 |
759.86 |
649.25 |
742.00 |
390.50 |
1483.88 |
1482.76 |
1066.60 |
1065.04 |
| 1 |
2248.84 |
1925.35 |
2208.00 |
1164.00 |
4369.86 |
4366.64 |
3157.66 |
3153.10 |
| 2 |
3697.03 |
3171.70 |
3651.00 |
1927.60 |
7151.86 |
7146.69 |
5195.04 |
5187.63 |
| 3 |
5104.62 |
4388.42 |
5072.00 |
2681.20 |
9830.66 |
9823.69 |
7179.05 |
7168.96 |
| 4 |
6471.83 |
5575.64 |
6470.00 |
3424.50 |
12![[thin space (1/6-em)]](https://www.rsc.org/images/entities/char_2009.gif) 406.70 406.70 |
12398.10 |
9109.98 |
9097.36 |
| ν |
HF |
DF |
H2 |
HBr |
MgH |
N2 |
Na35Cl |
Na37Cl |
| 0 |
2050.77 |
1490.30 |
2170.88 |
1314.65 |
739.11 |
1175.77 |
181.90 |
179.94 |
| 1 |
6012.19 |
4396.97 |
6332.02 |
3873.57 |
2171.09 |
3505.69 |
543.05 |
537.24 |
| 2 |
9801.57 |
7212.12 |
10257.99 |
6341.99 |
3539.79 |
5806.93 |
900.70 |
891.11 |
| 3 |
13423.60 |
9937.66 |
13953.23 |
8719.91 |
4841.14 |
8079.47 |
1254.89 |
1241.59 |
| 4 |
16882.40 |
12575.30 |
17421.24 |
11007.00 |
6070.50 |
10323.30 |
1605.65 |
1588.71 |
| ν |
NaLi |
O2 |
SiC |
SiCl |
SiN |
SiO |
| 0 |
127.81 |
787.14 |
475.47 |
267.25 |
574.0616 |
619.20 |
| 1 |
384.08 |
2343.47 |
1416.67 |
798.54 |
1712.46 |
1848.90 |
| 2 |
631.07 |
3876.15 |
2344.87 |
1325.50 |
2837.85 |
3066.50 |
| 3 |
877.74 |
5385.51 |
3260.07 |
1847.50 |
3950.20 |
4272.30 |
| 4 |
1121.07 |
6871.86 |
4162.27 |
2365.50 |
5049.46 |
5466.10 |
(1) Vibrational energy of B3PW91/def2-QZVP: EQZv;
(2) Vibrational energy of B3PW91/def2-TZVP: ETZv;
(3) Vibrational energy of B3PW91/def2-SVP: ESv.
The output variable is written as EBv. A case in point is 24MgO in Table 2. The task of the ANN is to learn the correct mapping relationship between input characteristic variables and system deviation Esysv.
Table 2 The input characteristic variables of 24MgO (cm−1)
| EQZv |
ETZv |
ESv |
| 380.703 |
385.124 |
379.880 |
| 1203.812 |
1145.498 |
1141.218 |
| 2016.469 |
1894.550 |
1890.964 |
| 2818.615 |
2632.317 |
2629.060 |
| 3610.286 |
3358.877 |
3355.515 |
| 4391.528 |
4074.295 |
4070.334 |
| 5162.374 |
4778.626 |
4773.501 |
| 5922.839 |
5471.926 |
5465.001 |
| 6672.946 |
6154.270 |
6144.839 |
| 7412.729 |
6825.742 |
6813.034 |
| 8142.228 |
7486.417 |
7469.602 |
| 8861.481 |
8136.358 |
8114.558 |
| 9570.527 |
8775.622 |
8747.914 |
| 10269.395 |
9404.272 |
9369.688 |
| 10958.118 |
10022.374 |
9979.911 |
| 11636.728 |
10630.005 |
10578.627 |
| 12305.264 |
11227.241 |
11165.886 |
| 12963.767 |
11814.158 |
11741.743 |
| 13612.285 |
12390.825 |
12306.256 |
| 14250.864 |
12957.311 |
12859.483 |
| 14879.549 |
13513.684 |
13401.489 |
3.2 Prediction results of vibrational energies
The initial sample set (39 molecules in all) was assigned to the sub-sample set (36 molecules) and the test set (3 molecules). After plenty of parameter set tests, and considering the calculation time and accuracy comprehensively, the most balanced set of parameters was chosen as the training parameters, which are listed in Table 3. The relative deviation (see eqn (9)) is used to measure the performance of ANN. For the test set consists of Na35Cl, 24MgO and 12C16O, the average relative deviation of the final ANN model is 0.42%, the maximum relative deviation is 4.65%, the minimum relative deviation is 0.0000099%. On the sub-sample set, the average relative deviation is 1.10%, the maximum relative deviation is 15.92%, the minimum relative deviation is 0.0000038%. The result shows consistent performance on the training and sub-sample set, which means that the learned model is reliable.
Table 3 Main parameter settings of ANNa
| Hidden layer 1 |
Hidden layer 2 |
trainRatio |
valRatio |
Train function |
Error function |
Divide function |
| trainRatio = the number of train set/the number of subsample set. valRatio = the number of validation set/the number of subsample set. |
| 30 |
20 |
0.85 |
0.15 |
trainbr |
mse |
Dividerand |
3.3 Comparison and analysis
The comparison with CCSD(T)/cc-pV5Z results are listed in Table 4. As shown in Tables 2 and 4, it can be found that ANN can effectively improve the performance of B3PW91/def2-XVP, even better than the more complex ab initio method (CCSD(T)/cc-pV5Z). In detail, the error of ab initial methods increases significantly at high energy levels and easily exceeds 100 cm−1, not to mention the maximum error of B3PW91/def2-QZVP exceeds 1000 cm−1. However, the maximum error of ANN does not exceed 70 cm−1, and the minimum error is only 0.006 cm−1. In addition, the error of the current method is smaller than that of CCSD(T) at each vibrational energy level.
Table 4 Prediction of vibrational energies of 12C16O/24MgO/Na35Cl (cm−1)a
| ν |
12C16O |
24MgO |
Na35Cl |
| Ev |
EBv − Ev |
E5v − Ev |
Ev |
EBv − Ev |
E5v − Ev |
Ev |
EBv − Ev |
E5v − Ev |
| Eν represents the experimental vibrational energy. EBν represents the vibrational energy predicted by machine learning method. E5ν represents the vibrational energy of CCSD(T)/cc-pV5Z. |
| 0 |
1081.77 |
20.430 |
−41.597 |
391.14 |
−7.408 |
−24.315 |
181.90 |
−8.463 |
−5.210 |
| 1 |
3225.04 |
40.073 |
−47.228 |
1165.88 |
23.542 |
−67.207 |
543.05 |
−8.877 |
−13.490 |
| 2 |
5341.83 |
50.975 |
−52.550 |
1930.32 |
37.748 |
−105.760 |
900.70 |
−9.328 |
−21.736 |
| 3 |
7432.21 |
16.260 |
−57.526 |
2684.16 |
39.576 |
−139.913 |
1254.89 |
−9.697 |
−29.886 |
| 4 |
9496.24 |
−48.621 |
−62.174 |
3427.11 |
34.611 |
−169.528 |
1605.650 |
−9.806 |
−37.961 |
| 5 |
11533.99 |
−21.454 |
−66.434 |
4158.89 |
28.412 |
−194.442 |
1953.01 |
−9.425 |
−45.949 |
| 6 |
13545.54 |
66.471 |
−70.264 |
4879.21 |
24.892 |
−214.454 |
2297.02 |
−8.353 |
−53.853 |
| 7 |
15530.95 |
21.302 |
−73.663 |
5587.77 |
24.813 |
−229.336 |
2637.69 |
−6.375 |
−61.666 |
| 8 |
17490.31 |
29.300 |
−76.624 |
6284.28 |
25.498 |
−238.849 |
2975.08 |
−3.382 |
−69.383 |
| 9 |
19423.68 |
18.285 |
−79.126 |
6968.45 |
22.793 |
−242.728 |
3309.20 |
0.641 |
−77.004 |
| 10 |
21331.14 |
−32.063 |
−81.149 |
7640.00 |
15.022 |
−240.705 |
3640.09 |
5.541 |
−84.527 |
| 11 |
23212.78 |
−44.368 |
−82.679 |
8298.63 |
5.976 |
−232.502 |
3967.80 |
10.937 |
−91.957 |
| 12 |
25068.67 |
−13.295 |
−83.713 |
8944.06 |
2.979 |
−217.836 |
4292.33 |
16.183 |
−99.282 |
| 13 |
26898.89 |
−44.542 |
−84.264 |
9575.98 |
9.678 |
−196.420 |
4613.74 |
20.281 |
−106.509 |
| 14 |
28703.54 |
−10.990 |
−84.316 |
10194.12 |
20.080 |
−167.961 |
4932.05 |
21.831 |
−113.634 |
| 15 |
30482.68 |
12.240 |
−83.849 |
10798.17 |
22.109 |
−132.166 |
5247.30 |
19.027 |
−120.651 |
| 16 |
32236.41 |
4.691 |
−82.890 |
11387.86 |
10.540 |
−88.739 |
5559.51 |
9.710 |
−127.571 |
| 17 |
33964.80 |
1.2907 |
−81.508 |
11962.89 |
−3.230 |
−37.381 |
5868.71 |
−8.600 |
−134.390 |
| 18 |
35667.96 |
5.946 |
−79.757 |
12522.96 |
−1.051 |
22.204 |
6174.94 |
−38.528 |
−141.106 |
| 19 |
37345.95 |
−1.119 |
−77.713 |
13067.80 |
8.500 |
90.311 |
|
|
|
| 20 |
38998.86 |
7.838 |
−75.525 |
13597.10 |
−47.268 |
167.237 |
|
|
|
| 21 |
40626.79 |
3.069 |
−73.411 |
|
|
|
|
|
|
| 22 |
42229.80 |
0.363 |
−71.673 |
|
|
|
|
|
|
| 23 |
43807.99 |
−1.943 |
−70.756 |
|
|
|
|
|
|
| 24 |
45361.43 |
−0.141 |
−71.309 |
|
|
|
|
|
|
| 25 |
46890.20 |
−0.872 |
−74.258 |
|
|
|
|
|
|
| 26 |
48394.02 |
−2.294 |
−80.588 |
|
|
|
|
|
|
| 27 |
49874.02 |
−0.886 |
−93.253 |
|
|
|
|
|
|
| 28 |
51329.22 |
3.742 |
−113.948 |
|
|
|
|
|
|
| 29 |
52760.00 |
5.960 |
−146.852 |
|
|
|
|
|
|
| 30 |
54166.50 |
1.847 |
−196.933 |
|
|
|
|
|
|
| 31 |
55548.70 |
−1.806 |
−268.367 |
|
|
|
|
|
|
| 32 |
56906.67 |
−0.006 |
−360.419 |
|
|
|
|
|
|
| 33 |
58240.46 |
−0.339 |
−466.403 |
|
|
|
|
|
|
| 34 |
59550.10 |
−0.563 |
−583.000 |
|
|
|
|
|
|
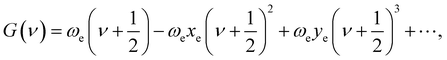
In order to further illustrate the reliability of the current method, many more diatomic molecules have been studied and compared with CCSD(T)/cc-pV5Z. Some are shown in Fig. 4, the height of red pillar is the average relative deviation of CCSD(T)/cc-pV5Z and the height of blue pilar is the average relative deviation of ANN. It shows that the improvement in prediction introduced by ANN over the ab initio method is better than that obtained by expanding the basis set.
 |
| | Fig. 4 Comparison of the average relative deviation of vibrational energy levels between ANN and CCSD(T)/cc-pV5Z. | |
It should also be emphasized that this work also considerably reduces the computational cost. Taking Na35Cl for an example, it takes more than 40 hours to obtain the results of CCSD(T)/cc-pV5Z, compared to less than one hour for the current method, which includes preparing DFT data and executing the ANN algorithm.
4 Conclusion
In this work, a general method is presented to obtain vibrational spectra of diatomic molecules of high quality by starting from conventional DFT calculations and modifying them with artificial neural network models. This approach provides a different path to improve DFT results without introducing sophisticated models (such as specific hybrid functionals) and large basis sets. Compared with the results of CCSD(T)/cc-pV5Z, the current work reduces the vibrational energies prediction error for diatomic systems from hundreds to dozens, even to tenths, and takes less than a tenth of the time. Since the strategy employed in this paper is a general data-driven approach, it can be easily extended to calculations of other molecular properties. For example, current DFT calculations of fluorescence spectra of macromolecular systems can be easily exceed 1000 cm−1.60,61 In future work, it is expected that the fluorescence spectral prediction capability of DFT can be improved by building a fluorescence spectral data set and adopting a correction method similar to that used in this work. There are several keys that should be attention: (1) collect accurate experimental (or computational) data of macromolecular system properties to establish a data set; (2) from simple to complex, try a variety of DFT methods for these properties, so that the calculation error on the data set can show a certain trend (similar to Fig. 3); (3) build a high-dimensional function through ANN and learn the rule of calculation error; (4) combine DFT and ANN error model to achieve higher prediction quality.
Conflicts of interest
There are no conflicts to declare
Acknowledgements
This research is supported by the National Natural Science Foundation of China (Grant No. 11904295), the Program of Science and Technology of Sichuan Province of China (Grant No. 2021ZYD0050), the Open Foundation of Key Laboratory of Advanced Reactor Engineering and Safety (Grant No. ares-2019-01) and the Open Re-search Fund Program of the Collaborative Innovation Center of Extreme Optics (Grant No. KF2020003).
Notes and references
- M. S. Safronova, D. Budker, D. DeMille, D. F. J. Kimball, A. Derevianko and C. W. Clark, Search for new physics with atoms and molecules, Rev. Mod. Phys., 2018, 90, 025008 CrossRef CAS.
- C. R. Baiz, B. Błasiak, J. Bredenbeck, M. Cho, J.-H. Choi, S. A. Corcelli, A. G. Dijkstra, C.-J. Feng, S. Garrett-Roe, N.-H. Ge, M. W. D. Hanson-Heine, J. D. Hirst, T. L. C. Jansen, K. Kwac, K. J. Kubarych, C. H. Londergan, H. Maekawa, M. Reppert, S. Saito, S. Roy, J. L. Skinner, G. Stock, J. E. Straub, M. C. Thielges, K. Tominaga, A. Tokmakoff, H. Torii, L. Wang, L. J. Webb and M. T. Zanni, Vibrational Spectroscopic Map, Vibrational Spectroscopy, and Intermolecular Interaction, Chem. Rev., 2020, 120, 7152–7218 CrossRef CAS PubMed.
- D. J. Fink and E. G. Myers, Deuteron-to-proton mass ratio from simultaneous measurement of the cyclotron frequencies of H2+ and D+, Phys. Rev. Lett., 2021, 127, 243001 CrossRef CAS PubMed.
- Y. Li, T. Sato and K. L. Ishikawa, Implementation of a time-dependent multiconfiguration self-consistent-field method for coupled electron-nuclear dynamics in diatomic molecules driven by intense laser pulses, Phys. Rev. A, 2021, 104, 043104 CrossRef CAS.
- W. Liu, J. Wu, J. Ma, P. Li, V. B. Sovkov, L. Xiao and S. Jia, Observation and analysis of the hyperfine structure of near-dissociation levels of the NaCs c3∑+ state below the dissociation limit 3S1/2+6P3/2, Phys. Rev. A, 2016, 94, 032518 CrossRef.
- G. Chen, X. Yang, X. Ying, G. Liu, Y. Huang and Y. Chen, Optical heterodyne detected velocity modulation molecular ionic spectroscopy, Chin. Sci. Bull., 2004, 49, 2354–2359 CrossRef CAS.
- A. Foltynowicz, F. M. Schmidt, W. Ma and O. Axner, Noise-immune cavity-enhanced optical heterodyne molecular spectroscopy: current status and future potential, Appl. Phys. B: Photophys. Laser Chem., 2008, 92, 313–326 CrossRef CAS.
- F. J. Fortes, J. Moros, P. Lucena, L. M. Cabalín and J. J. Laserna, Laser-induced breakdown spectroscopy, Anal. Chem., 2013, 85, 640–669 CrossRef CAS PubMed.
- A. Kolezynski and M. Krol, Molecular Spectroscopy—Experiment and Theory: From Molecules to Functional Materials, Springer International Publishing, Berlin, 2019, pp. 1–48 Search PubMed.
- H. Lischka, D. Nachtigallová, A. J. A. Aquino, P. G. Szalay, F. Plasser, F. B. C. Machado and M. Barbatti, Multireference approaches for excited states of molecules, Chem. Rev., 2018, 118, 7293–7361 CrossRef CAS PubMed.
- S. Bubin, M. Pavanello, W. C. Tung, K. L. Sharkey and L. Adamowicz, Born–Oppenheimer and Non-Born–Oppenheimer, atomic and molecular calculations with explicitly correlated Gaussians, Chem. Rev., 2013, 113, 36–79 CrossRef CAS PubMed.
- M. Chen and D. A. Dixon, Low-Lying electronic states of irn clusters with n = 2–8 predicted at the DFT, CASSCF, and CCSD(T) levels, J. Phys. Chem., 2013, 117, 3676–3688 CrossRef CAS PubMed.
- R. Liu, R. Wang, D. Li, Y. Zhu and X. Yang, An ab initio study on boundaries for characterizing cooperative effect of hydrogen bonds by intermolecular compression, Chin. Chem. Lett., 2022, 107857 CrossRef.
- T. Jonathan, L. Lorenzo, K. M. Laura and N. Y. Sergei, The ab initio calculation of spectra of open shell diatomic molecules, J. Phys. B: At. Mol. Opt. Phys., 2016, 40, 102001 Search PubMed.
- J. Fu, J. Jian, S. Long, Z. Fan, Q. Fan, F. Xie, Y. Zhang and J. Ma, Study on potential energy curves and ro-vibrational energies of DT, HT and T2 molecules, Spectrochim. Acta, Part A, 2021, 260, 119913 CrossRef CAS PubMed.
- M. A. Palafox, DFT computations on vibrational spectra: scaling procedures to improve the wavenumbers, Phys. Sic. Rev., 2018, 3, 20170184 Search PubMed.
- A. Erba, J. Baima, I. Bush, R. Orlando and R. Dovesi, Large-Scale condensed matter DFT simulations: performance and capabilities of the CRYSTAL Code, J. Chem. Theory Comput., 2017, 13, 5019–5027 CrossRef CAS PubMed.
- S. Mohr, L. E. Ratcliff, L. Genovese, D. Caliste, P. Boulanger, S. Goedecker and T. Deutsch, Accurate and efficient linear scaling DFT calculations with universal applicability, Phys. Chem. Chem. Phys., 2015, 17, 31360–31370 RSC.
- G. Rauhut, S. Puyear, K. Wolinski and P. Pulay, Comparison of NMR Shielding calculated from Hartree-Fock and density Functional wave functions using gauge-including atomic orbitals, J. Phys. Chem., 1996, 100, 6310–6316 CrossRef CAS.
- G. Rauhut and H. Werner, The vibrational spectra of furoxan and dichlorofuroxan: a comparative theoretical study using density functional theory and local electron correlation methods, Phys. Chem. Chem. Phys., 2003, 5, 2001–2008 RSC.
- A. J. Cohen, P. Mori-Sanchez and W. Yang, Insights into current limitations of density functional theory, Science, 2008, 321, 792–794 CrossRef CAS PubMed.
- Y. Zhang, X. Xu and W. A. Goddard III, Doubly hybrid density functional for accurate descriptions of nonbond interactions, thermochemistry, and thermochemical kinetics, Proc. Natl. Acad. Sci. U. S. A., 2009, 106, 4963–4968 CrossRef CAS PubMed.
- J. Fu, S. Long, J. Jian, Z. Fan, Q. Fan, F. Xie, Y. Zhang and J. Ma, A joint data and model driven method for study diatomic vibrational spectra including dissociation behavior, Spectrochim. Acta, Part A, 2020, 239, 118363 CrossRef CAS PubMed.
- C. A. Onate, I. B. Okon, M. C. Onyeaju and O. Ebomwonyi, Vibrational energies of some diatomic molecules for a modified and deformed potential, Sci. Rep., 2021, 11, 22498 CrossRef CAS PubMed.
- J. Zhao, G. Tian, Y. Qiu and H. Qu, Rapid quantification of active pharmaceutical ingredient for sugar-free Yangwei granules in commercial production using FT-NIR spectroscopy based on machine learning techniques, Spectrochim. Acta, Part A, 2011, 245, 118878 CrossRef PubMed.
- H. Li, Z. Xiang, C. Qin, Y. Li and M. Sun, Spectra-based blood species discrimination by machine learning: between human and non-human, Infrared Phys. Technol., 2022, 122, 104062 CrossRef CAS.
- J. Niskanen, A. Viadyka, J. A. Kettunen and C. J. Sahle, Machine learning in interpretation of electronic core-level spectra, J. Electron Spectrosc. Relat. Phenom., 2022, 260, 147243 CrossRef CAS.
- L. Piela, Ideas of Quantum Chemistry – Volume 1: From Quantum Physics to Chemistry, Elsevier, Amsterdam, 3rd edn, 2020, p. 764 Search PubMed.
- L. Piela, Ideas of Quantum Chemistry, vol. 2, Interactions, Elsevier, Amsterdam, 3rd edn, 2020, p. 660 Search PubMed.
- B. P. Stoicheff, High resolution Raman spectroscopy of Gasesix. spectra of H2, HD, and D2, Can. J. Phys., 1957, 35, 730–741 CrossRef CAS.
- S. C. Wang, Artificial Neural Network, Springer, Boston, 2003, p. 743 Search PubMed.
- O. I. Abiodun, A. Jantan, A. E. Omolara, K. V. Dada, N. A. Mohamed and H. Arshad, State-of-the-art in artificial neural network applications: a survey, Heliyon, 2018, 4, e00938 CrossRef PubMed.
- Y. Li, C. Zou, M. Berecibar, E. Nanini-Maury, J. C. W. Chan, P. V. D. Bossche, J. V. Mierlo and N. Omar, Random forest regression for online capacity estimation of lithium-ion batteries, Appl. Energy, 2018, 232, 197–210 CrossRef CAS.
- E. M. Abdel-Rahman, F. B. Ahmed and R. Ismail, Random forest regression and spectral band selection for estimating sugarcane leaf nitrogen concentration using EO-1 Hyperion hyperspectral data, Int. J. Rem. Sens., 2013, 32, 712–728 CrossRef.
- T. Chen and C. Guestrin, Proceedings of the 22nd ACM SIGKDD International Conference on Knowledge Discovery and Data Mining, 2016, p. 785 Search PubMed.
- M. J. Frisch, G. W. Trucks, H. B. Schlegel and G. E. Scuseria, et al., Gaussian 09, Revision A. 02, Gaussian, Inc., Wallingford ct, 2016 Search PubMed.
- R. J. Le Roy, LEVEL: a computer program for solving the radial Schrödinger equation for bound and quasibound levels, J. Quant. Spectrosc. Radiat. Transfer, 2017, 186, 167–178 CrossRef CAS.
- K. A. Peterson and R. C. Woods, An ab initio investigation of the spectroscopic properties of BCl, CS, CCl+, BF, CO, CF+, N2, CN−, and NO+, J. Chem. Phys., 1987, 87, 4409–4418 CrossRef CAS.
- M. A. A. Clyne and I. S. McDermid, B3Π(o+) states of IF, ICl and IBr. Part 1 — Calculation of the RKR turning points and Franck–Condon factors for the B–X Systems, J. Chem. Soc., 1976, 72, 2242–2251 CAS.
- J. A. Coxon and P. G. Hajigeorgiou, Born–Oppenheimer breakdown in the ground state of carbon monoxide: a direct reduction of spectroscopic line positions to analytical radial Hamiltonian operators, Can. J. Phys., 1992, 70, 40–54 CrossRef CAS.
- R. S. Ram, M. Dulick, B. Guo, K. Q. Zhang and P. F. Bernath, Fourier transform infrared emission spectroscopy of NaCl and KCl, J. Mol. Spectrosc., 1997, 183, 360–373 CrossRef CAS PubMed.
- M. D. Saksena, M. N. Deo, K. Sunanda, S. H. Behere and C. T. Londhe, Fourier transform spectral study of B2∑+−X2∑+ system of AlO, J. Mol. Spectrosc., 2008, 247, 47–56 CrossRef CAS.
- A. Shayesteh, R. D. E. Henderson, R. J. Le Roy and P. F. Bernath, Ground State PotentialEnergy Curve and Dissociation Energy of MgH, J. Phys. Chem. A, 2007, 111, 12495–12505 CrossRef CAS PubMed.
- J. A. Coxon and P. G. Hajigeorgiou, Isotopic dependence of Born-Oppenheimer breakdown effects in diatomic hydrides: the B1∑+ and X1∑+ states of HF and DF, J. Mol. Spectrosc., 1990, 142, 254–278 CrossRef CAS.
- J. A. Coxon and P. G. Hajigeorgiou, Improved direct potential fit analyses for the ground electronic states of the hydrogen halides: HF/DF/TF, HCl/DCl/TCl, HBr/DBr/TBr and HI/DI/TI, J. Quant. Spectrosc. Radiat. Transfer, 2015, 151, 133–154 CrossRef CAS.
- C. E. Blom, H. G. Hedderich, F. J. Lovas, R. D. Suenram and A. G. Maki, Infrared and microwave spectra of SrO and BaO, J. Mol. Spectrosc., 1992, 152, 109–118 CrossRef CAS.
- S. Edwards, J. Y. Roncin, F. Launay and F. Rostas, The Electronic Ground State of Molecular Nitrogen, J. Mol. Spectrosc., 1993, 162, 257–267 CrossRef CAS.
- T. G. Slanger and P. C. Cosby, Oxygen spectroscopy below 5.1 eV, J. Phys. Chem., 1988, 92, 267–282 CrossRef CAS.
- R. J. Le Roy, D. R. T. Appadoo, R. Colin and P. F. Bernath, On the X2∑+, A2Π, and C2∑+ states of BeH, BeD, and BeT, J. Mol. Spectrosc., 2006, 236, 178–188 CrossRef CAS.
- R. R. Reddy, T. V. R. Rao and R. Viswanath, Potential energy curves and dissociation energies of NbO, SiC, CP, PH+, SiF+, and NH+, Astrophys, Space Sci., 1992, 189, 29–38 CrossRef CAS.
- R. S. Speth, C. Braatz and E. Tiemann, REMPI spectroscopy of SO singlet states, J. Mol. Spectrosc., 1998, 192, 69–74 CrossRef CAS PubMed.
- R. R. Reddy, Y. N. Ahammed, K. R. Gopal, P. A. Azeem and S. Anjaneyulu, RKRV potential energy curves, dissociation energies, γ-Centroids and Franck-Condon factors Of YO, CrO, BN, ScO,SiO And AlO Molecules, Astrophys. Space Sci., 1998, 262, 223–240 CrossRef CAS.
- M. Venkataramanaiah and S. V. J. Lakshman, Potential energy curves and dissociation energy of SiCl, J. Quant. Spectrosc. Radiat. Transfer, 1981, 26, 11–13 CrossRef CAS.
- Z. L. Cai, J. M. L. Martin, J. P. François and R. Gijbels, Ab initio study of the X2∑+ and A2Π states of the SiN radical, Chem. Phys. Lett., 1996, 252, 398–404 CrossRef CAS.
- P. Botschwina, Spectroscopic properties of BH, BF, and HBF+ calculated by SCEP-CEPA, J. Mol. Spectrosc., 1986, 118, 76–87 CrossRef CAS.
- I. Dabrowski, The Lyman and Werner bands of H2, Can. J. Phys., 1984, 62, 1639–1664 CrossRef CAS.
- C. E. Fellows, J. Vergs and C. Amiot, The NaLi electronic ground state studied by laser induced fluorescence and Fourier transform spectroscopy, Mol. Phys., 1988, 63, 1115–1122 CrossRef CAS.
- J. A. Coxon and P. G. Hajigeorgiou, The Radial Hamiltonians for the X1∑+ and B1∑+ states of HCl, J. Mol. Spectrosc., 2000, 203, 49–64 CrossRef CAS PubMed.
- R. R. Reddy, Y. N. Ahammed, D. B. Basha, K. Narasimhulu, L. S. S. Reddy and K. R. Gopal, Spectroscopic studies of atmospheric interest on NO and NO+, J. Quant. Spectrosc. Radiat. Transfer, 2006, 97, 344–453 CrossRef CAS.
- D. Jacquemin, E. A. Perpete, G. Scalmani, M. J. Frisch, H. Ciofini and C. Adamo, Fluorescence of 1,8-naphthalimide: a PCM-TD-DFT investigation, Chem. Phys. Lett., 2007, 448, 3–6 CrossRef CAS.
- Y. Cui, Y. Zhang, K. Xie and W. Dong, A Newly Synthesized Heterobimetallic NiII−GdIII Salamo-BDC-Based Coordination Polymer: Structural Characterization, DFT Calculation, Fluorescent and Antibacterial Properties, Crystals, 2019, 9, 596 CrossRef CAS.
|
| This journal is © The Royal Society of Chemistry 2022 |
Click here to see how this site uses Cookies. View our privacy policy here. 
 Open Access Article
 This Open Access Article is licensed under a Creative Commons Attribution-Non Commercial 3.0 Unported Licence
 a,
Zhitao Wana,
Li Liua,
Jia Fu*a,
Qunchao Fan*a,
Feng Xieb,
Yi Zhangc and
Jie Mad
a,
Zhitao Wana,
Li Liua,
Jia Fu*a,
Qunchao Fan*a,
Feng Xieb,
Yi Zhangc and
Jie Mad
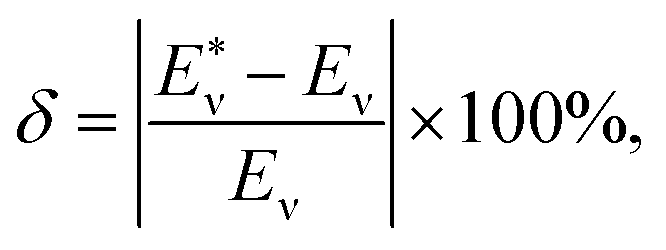
 represents the theoretical energy (the value of DFT or ANN), Eν represents the experimental value. The input characteristic variables are shown below: