DOI:
10.1039/D2RA06873G
(Paper)
RSC Adv., 2022,
12, 35290-35299
Molecular dynamics simulation of adsorption and separation of xylene isomers by Cu-HKUST-1†
Received
31st October 2022
, Accepted 4th December 2022
First published on 9th December 2022
Abstract
Metal–organic frameworks (MOFs) are widely used in the adsorption separation of various gases. A fundamental understanding of the effective separation of xylene isomers helps improve aromatic products' separation efficiency and reduce industrial separation costs. Grand Canonical Monte Carlo (GCMC) simulations combined with Molecular Science is widely used to predict gas adsorption and diffusion in single crystals with metal–organic frameworks. We performed a GCMC + MD combined approach to study xylene isomers' adsorption and separation in Cu-HKUST-1 to predict the permeability and selectivity of the ternary gas mixture in the MOF with the adsorption and diffusion usage data. Most current studies take into account the computational cost and difficulty. Most recent research models are limited to the adsorption of a single or specific molecule, such as hydrogen, methane, carbon dioxide, etc. For this reason, we report an attempt to study the adsorption separation of aromatic gases (p-xylene/o-xylene/m-xylene) based on Cu-HKUST-1 single-crystal materials based on some previous research methods with an appropriate increase in computational cost. To predict the adsorption selectivity and permeability of the ternary mixture of xylene isomers on the MOF surface, the model simulation calculates key parameters of gas adsorption, including gas adsorption volume (N), the heat of adsorption (Qst), Henry coefficient (K), and diffusion coefficient (D).
1 Introduction
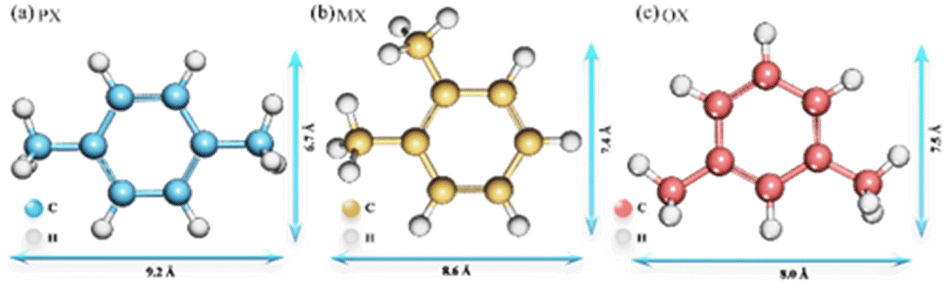
Xylene isomers (Fig. 1), are important raw materials for the manufacture of various high value-added chemicals and polymers, respectively.1 para-Xylene (p-xylene, PX) is a critical material for the preparation of polyethylene terephthalate (PET), polyesters, and synthetic resins. ortho-Xylene (o-xylene, OX) is a common raw material for phthalic anhydride and plasticizers. meta-Xylene (m-xylene, MX) is mainly used for the synthesis of iso-phthalic acid, which is further used for the mixing of PET resins. After catalytic reforming of crude oil, these three isomers exist as a mixture. Therefore, the separation of single component gas products from mixed xylene isomers is significant for the petrochemical industry.2 In terms of current industry development, the separation and purification of chemical products are critical and high consumption processes in the chemical industry.3 Moreover, the similar physical and chemical properties of the three isomers make them more difficult to be separated. The specific structural parameters of the xylene isomers are shown in Table S1.† Therefore, there is an urgent need to find a less costly separation method and screening of adsorbent materials with high adsorption performance for the separation of xylene isomers. Metal–organic frameworks (MOFs) materials are widely used in the adsorption and separation of chemical products because of their high specific surface area and high porosity, as they have the advantages of high adsorption capacity, high selectivity, and recyclability.4 In addition, MOFs are promising for hydrogen storage,5 catalysts,6 magnetic materials,7 optical materials,8 drug release,9 electrical materials,10 and other related applications, so they are valuable for research on environmental and energy supply issues.
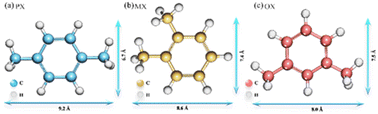 |
| | Fig. 1 Structure and molecular size of xylene isomers. | |
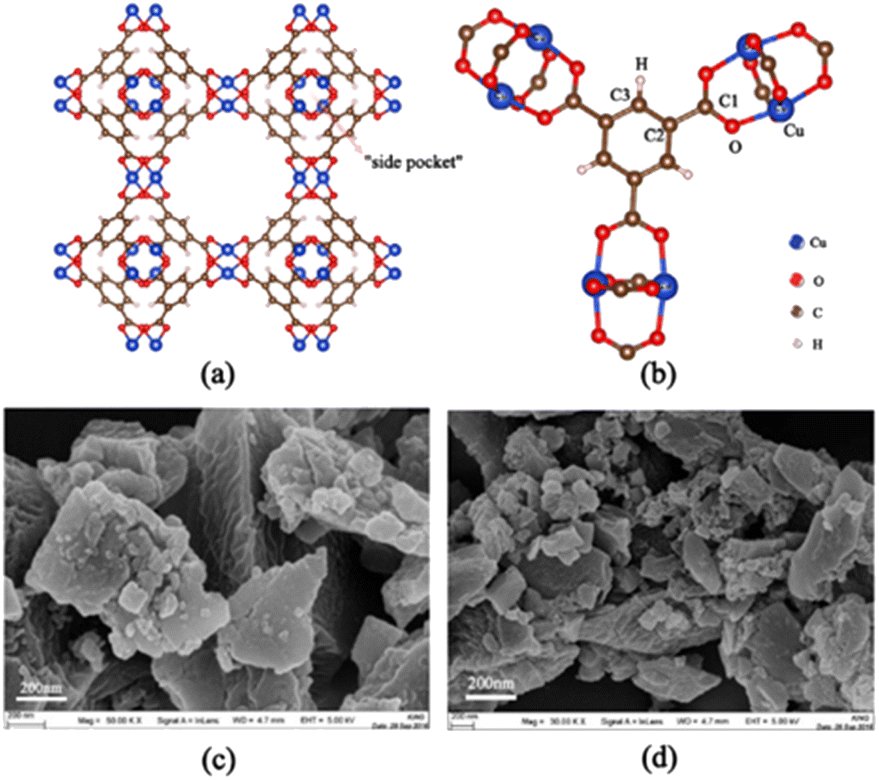
In this paper, we focus on the adsorption separation of ternary mixed xylene isomers by Cu-HKUST-1, a recent class of promising porous materials for adsorption of gas storage.11 The structure of Cu-HKUST-1 is shown in Fig. 2(a) and (b) by VESTA version.3.5.7.12 TEM images were taken on a JEOL JEM2 100 transmission electron microscope at an accelerating voltage of 200 kV. Field-emission SEM images of the samples were taken with a Zeiss Supra 55 microscope at 30 kV are shown in Fig. 2(c) and (d). Cu-HKUST-1 was first proposed by Chui et al.13 in 1999. The high adsorption capacity and stability of Cu-HKUST-1 are due to the mutual static electricity between the porous structures.14 The material is described as dimeric coordination of copper coordinated with four carboxylate ligands, and the resulting structure shows a three-dimensional porosity consisting of three types of pore channels. The most interesting feature of this structure is the presence of unsaturated metal centers (copper atoms), whose unsaturated sites become potential strong adsorption sites.15,16 At the same time, mass transfer limitations need to be understood to use this material effectively. Because adsorbents must rapidly adsorb and diffuse into the interior of Cu-HKUST-1, where they are temporarily trapped (by physical adsorption) and can react at active sites within Cu-HKUST-1 (by chemisorption at open metal sites). Therefore, it is crucial to understand the adsorption mechanism of the adsorbent on the Cu-HKUST-1 surface. However, there are few detailed studies on the mechanism of the effect of MOFs on xylene adsorption, especially at the microscopic level.
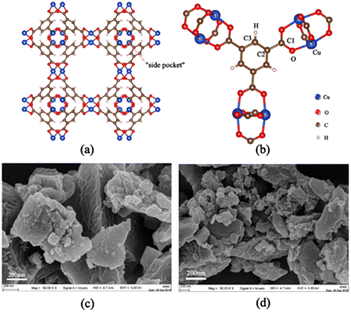 |
| | Fig. 2 (a) Two-dimensional structure of Cu-HKUST-1, where the smallest pore, usually named “side pocket”, has a pore diameter of 4.6 Å, inaccessible to any xylene isomer. Eight side pockets are arranged in the four corners of a cube, forming two types of large pores with internal diameters of 10 Å and 12 Å. (b) The potential functions of the atoms are named. (c) and (d) SEM structure diagram. | |
On the one hand, David Peralta and Karin Barthelet et al.15 investigated the xylene adsorption in CPO-27-Ni and zeolite NaY. In Cu-HKUST-1, the metal center is more accessible than that of CPO-27-Ni due to electrostatic interactions playing a greater role. The pore geometry of Cu-HKUST-1 is inherently para-selective, but the para-selectivity is overcompensated by electrostatic effects, which overall leads to a slight preference for OX adsorption. However, they contend that for this para-site selectivity to prevail, the MOF must have a low electrostatic field to prevent preferential adsorption of other isomers. Bárcia et al.17 mentioned UiO-66 as the more favorable adsorption of OX compared to other xylene isomers. They concluded that the reverse shape selectivity in the adsorption of xylene isomers could be attributed to the rotational degrees of the molecules' freedom in the small cavities. On the other hand, Tyler G. Grissom et al.18 used isothermal diffusion experiments to reveal that the diffusivity of xylene in UiO-66 ranged between 10−8 and 10−12 cm2 s−1, where the relative diffusivity followed the following trend: OX < MX < PX. Qiao et al.19 simulated the conformation and heat of adsorption of C8 aromatics (ethylbenzene, p-xylene, o-xylene, and m-xylene) in MIL-125 by Materials Studio software. The results showed that among these four isomers, the heat of adsorption of PX and the binding energy of PX in the MIL-125 tetrahedral cage was the largest, so the adsorption of PX was characterized to be greater than the other isomers. The reason is that PX and EB can be adsorbed in both the tetrahedral and octahedral cages of MIL-125, MX and OX can only be adsorbed in the octahedral cages, and the binding energy of the four isomers in the tetrahedral cage is higher than that in the octahedral cage. PX has the highest binding energy in the tetrahedral cage, which may be the reason for the preferential adsorption of PX in MIL-125. Therefore, the adsorption of xylene in MOFs is still controversial.
So far, most reported computational models are limited to a simple small molecule or other specific molecules, such as hydrogen, methane, nitrogen, carbon dioxide, the mixture of CO2/H2,20 the mixture of CH4/H2 etc.21 Grand Canonical Monte Carlo (GCMC) method is widely used with Equilibrium Molecular Dynamics (EMD) to predict gas adsorption and diffusion in the single crystals of MOFs. Several studies1,2,16,21,22 have evidenced the great potential for using GCMC + MD numerical simulation to screen the adsorption properties of a large number of materials. We combine adsorption and diffusion data from these simulations to predict the gas permeability and selectivity of MOF membranes.21,22 Z. W. Qiao et al.2 studied the separation of xylenes in MOF by adsorption in concert with the high throughput screening (HTS) method and machine learning (ML) method. The results showed that pore limit diameter (PLD) and larger cavity diameter (LCD) have greater importance. While this study provides useful insight into the separation of xylenes in MOFs, several points need to be noted. First, the initial screening was based on a rigid MOF without consideration of framework flexibility. In principle, this is acceptable because there is no universal transferable force field to accurately describe the flexibility of the various MOFs. The flexibility of the framework as demonstrated according to the article may also strongly affect the separation performance, especially the selectivity. Sütay et al.23 used Monte Carlo (MC) and Molecular Dynamics (MD) simulations to study the adsorption of dihalogen molecules on raw graphene surfaces, focusing on adsorption sites, adsorption capacities, coverage factors, adsorption isotherms, and adsorption kinetics. The adsorption energies of all adsorbates were also calculated. It is also mentioned that MD simulations can reproduce the real adsorbent effects compared to experimental chemisorption and physical adsorption data in the literature. In addition, DFT is one of the most effective methods to study the adsorption properties of gases. Grissom et al.18 used DFT to calculate the interaction of toluene with the UiO-66 tetrahedral cavity, Perdew–Burke–Ernzerhof general functions for periodic DFT calculations of the cell, and VASP for projection-enhanced wave potential and empirical dispersion correction.
In this study, we focus on the adsorption properties of xylene isomers on the surface of the composite Cu-HKUST-1 using the numerical simulation method GCMC + MD in EMD. The results (N, Qst, K, D) of GCMC simulations (amount of gas load adsorbed) are used as inputs for MD simulations to calculate evaluation parameters, such as adsorption selectivity (Sads), diffusivity (Sdiff), and permeability (P). These evaluation parameters provide helpful guidance for better studying the adsorption characteristics of the Cu-HKUST-1 film.
2 Computational methods
2.1 Potential energy model
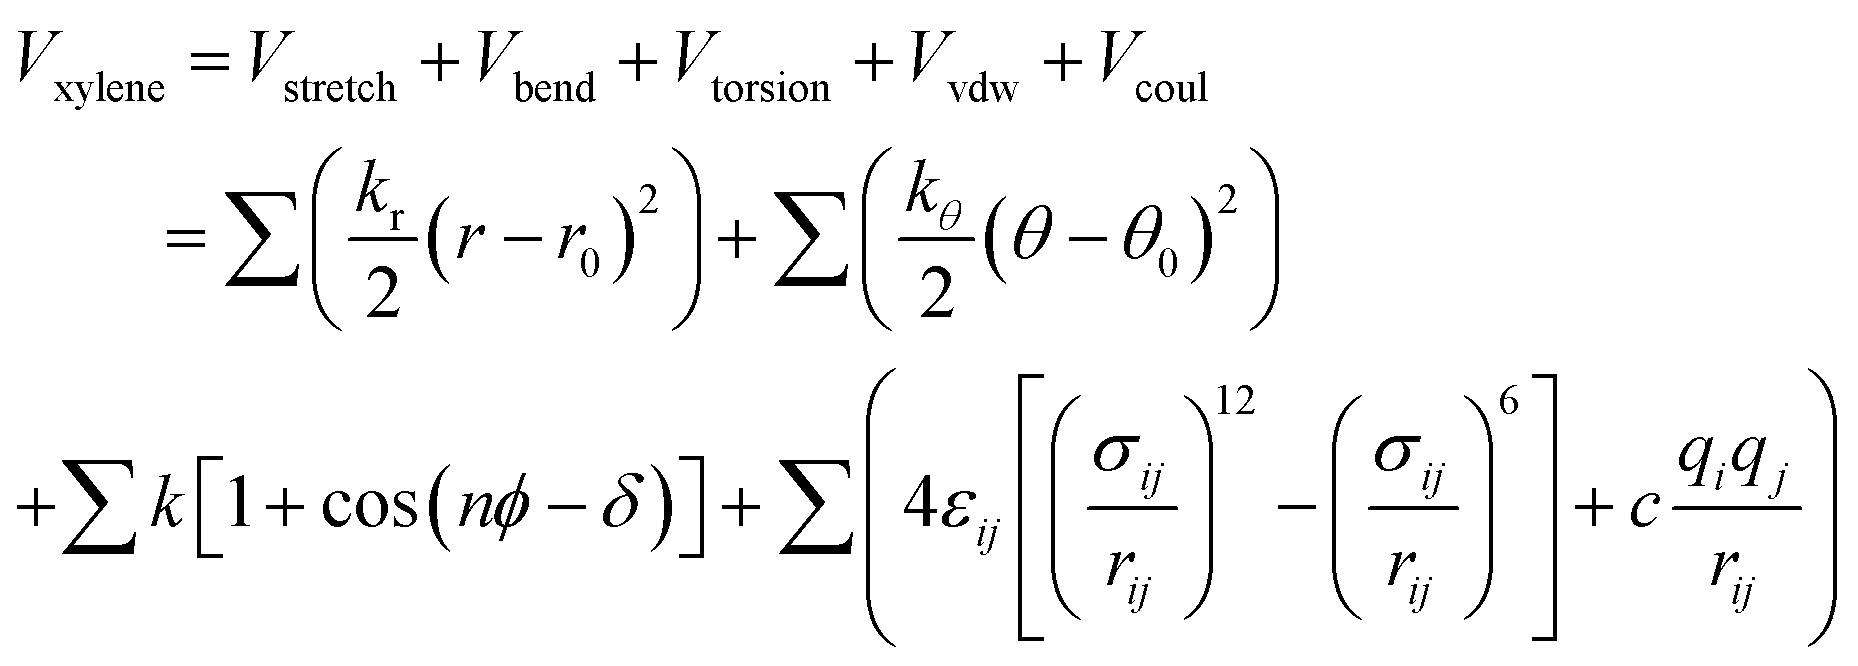
The four atom types for the xylene isomer molecule: CA, CT, HA, and HT, see Fig. S1.† The atomic foot labeled A belongs to the carbon atom on the aromatic ring, and the trace labeled T belongs to the part forming the methyl group. CA1 and CA2 are the aromatic C atoms with H and CH3, respectively. Interaction between PX, MX, and OX molecular mixtures and pore walls of metal–organic architecture materials using the amber force field developed by W. D. Cornell et al.24 For the total potential parameter values used for the simulation process, see Tables S2 and S3.† The total potential energy of the adsorption complex can be divided into four parts of energy composition, see eqn (1).| | |
Vtotal = Vintraxylene + Vintra_mof + Vxylene–xylene + Vxylene_mof
| (1) |
Vintraxylene is the intramolecular potential energy of the xylene molecule, Vintra_mof is the potential energy within the Cu-HKUST-1 crystal structure, and Vxylene–xylene is the potential energy between the molecules of the xylene isomers, Vxylene_mof is the internal potential energy of the xylene isomer molecule with the Cu-HKUST-1 crystal structure.
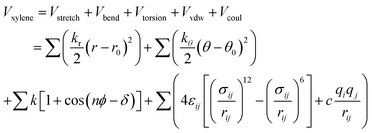
The functional form of the total potential includes: harmonic potential with bond length (Vstretch) and angle (Vbend) as units. The equilibrium bond lengths and bond angles were obtained by charge derivation using the split valence 6-31g(d,p) basis sets at the Hartree–Fock (HF) approximation level. (Vtorsion) is energy involved in dihedral angles. The values of point charges are estimated from the wave functions of isolated molecules according to the extended charge equilibration (EQeq)25 scheme, and the point charges of atoms of the same type are equalized to their average values.26 The first three summations are for the appropriate coordinates, and the last summation is for all “non-bonded” intramolecular distances, see eqn (2).
| |
 | (2) |
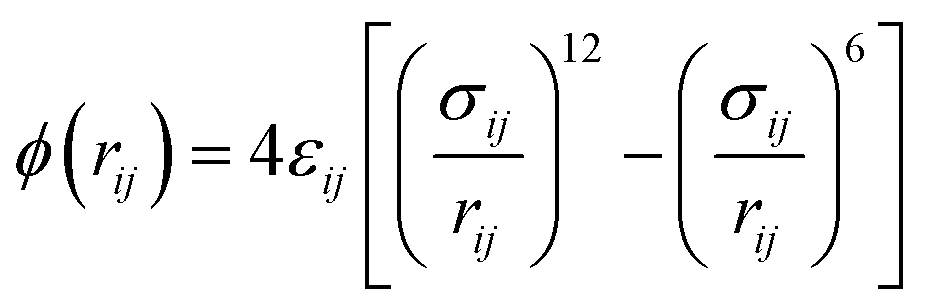
In the simulations, the non-bonding interaction potentials between the molecules of PX, MX, and OX gases and the bonding potential energy between the internal molecules are described by the Lennard–Jones (LJ) 12–6 possible energy model for both intermolecular van der Waals interactions (Vvdw) and electrostatic interactions treated by Coulomb interactions (Vcoul). The pair of particles i and j with relative distance rij, their interaction potential energy is shown in eqn (3).
| |
 | (3) |
where
σ and
ε are the LJ molecular diameter and potential energy.
i and
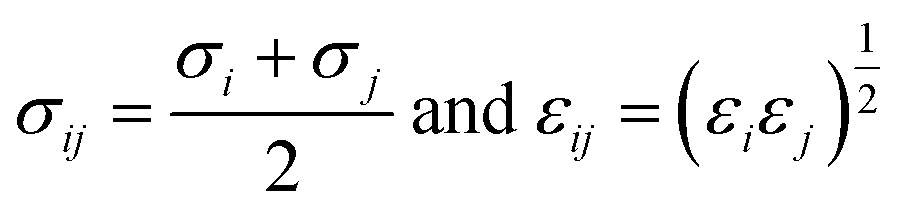
j can refer to PX, MX, and OX molecules, respectively. The parameters of the solid (Cu-HKUST-1)-fluid (PX, MX, and OX) interactions were calculated using the Lorentz–Berthelot combination rule obtained, see
eqn (4).
| |
 | (4) |
Finally, the simulations were performed at infinite dilutions, and we neglected the intermolecular interactions between adsorbents and adsorbents. The charge of Cu-HKUST-1 is allocated using an approximate charge allocation method. Computational cost is critical in large-scale molecular structure studies, and many assumptions are made to reduce the computational power and time required. In this study, we defined the skeleton of Cu-HKUST-1 as a rigid structure and applied the universal force field (UFF) described by A. K. Rappe et al.27 and the DFF force field to the skeleton structure in the simulation process. Detailed parameters are shown in Fig. S2 and Table S4.† When using the force field, we preferentially choose the DFF force field, considering that the DFF force field has no transition element Cu, and then use the UFF force field.
2.2 Simulation detail
2.2.1 GCMC calculation. The GCMC method is described in ESI S3.† We used RASPA28 to simulate the adsorption properties of the xylene isomer gas mixture by the GCMC method. In the simulation process, the simulation unit composed of Cu-HKUST-1 crystal structure with xylene isomer molecules was defined, and periodic boundary conditions were applied in the x, y, and z axes. Simulation early in keeping the system volume, under the premise of constant temperature and adsorption potential energy, the particles in the random selection system translational action. The system's power tends to decrease with a certain probability after receiving it. Pressure, temperature, and mixture were selected as control variables to simulate the adsorption behavior of mixed gas under different parameter combinations. The temperatures were selected including 348 K, 373 K, and 398 K. The pressure range was 1–1000 Pa. In the simulation process, the GCMC method is used in RASPA to set the number of loop simulation steps to 100![[thin space (1/6-em)]](https://www.rsc.org/images/entities/char_2009.gif) 000 and the balance steps to 20000. The external temperature control was 298 K, and the thermostat time scale was 0.15 ps. The pressure regulator time scale parameter was 0.15 ps. The cross-term was first tested using the Lorentz–Berthelot mixing rule, and the full host–guest interaction calculation was used for the test. The potential energy was calculated using spherical truncation and the truncation radius of fluid intermolecular interaction was 13 Å.
000 and the balance steps to 20000. The external temperature control was 298 K, and the thermostat time scale was 0.15 ps. The pressure regulator time scale parameter was 0.15 ps. The cross-term was first tested using the Lorentz–Berthelot mixing rule, and the full host–guest interaction calculation was used for the test. The potential energy was calculated using spherical truncation and the truncation radius of fluid intermolecular interaction was 13 Å.
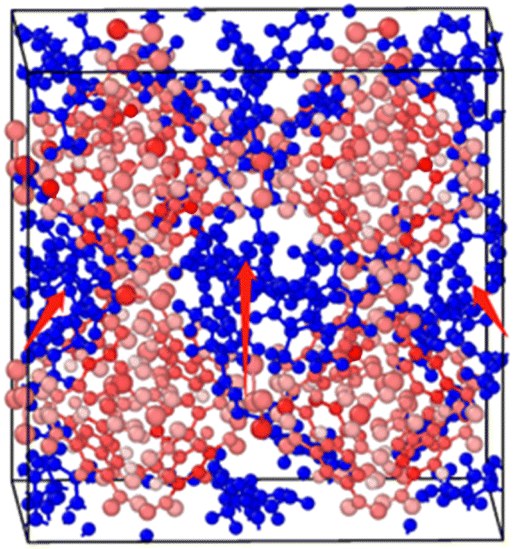
2.2.2 MD calculation. The molecular dynamics component was calculated using the Large-Scale Atom/Molecular Weight Parallel Simulator (LAMMPS).29 Based on the 1 × 1 × 1 Cu-HKUST-1 cell unit model (Fig. 3), a 3 × 3 × 3 supercell model structure was established by cell expansion. The size of the supercell model is a = 79.029 Å, b = 79.029 Å, c = 79.029 Å. Using the UFF force field between molecules and the skeleton, AMBER force field for the description of the force field between molecules of adsorbate materials. Periodic boundary conditions were applied with cutoff of 13 Å, and a time step of 1 fs was used for all simulations. Use the Nosé–Hoover thermostat to balance each run by 100 ps in the canonical NVT (constant atomic number, volume, and temperature) ensemble.
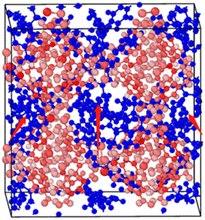 |
| | Fig. 3 Adsorption conformation of the xylene isomers on a 1 × 1 × 1 Cu-HKUST-1 cell model. In this figure, the xylenes can only pass through the channels due to the largest size of Cu-HKUST-1. | |
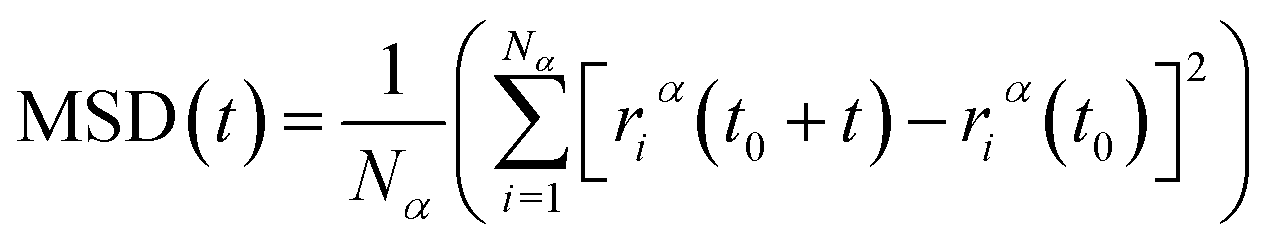
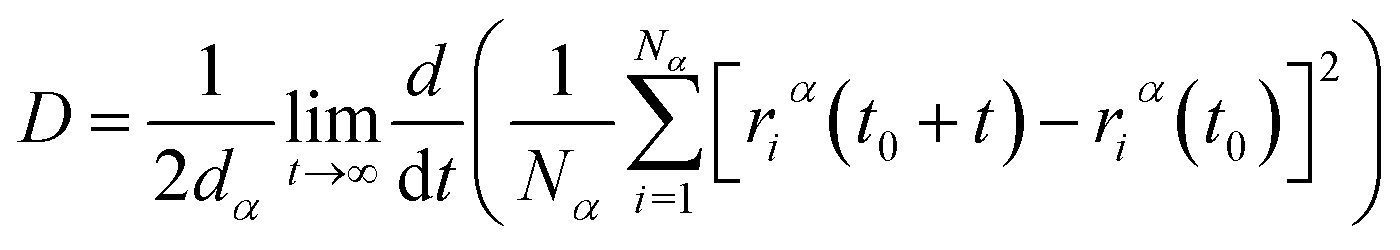
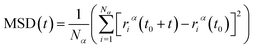
After model initialization, energy minimization, and atomic interaction configuration, the gas adsorption of xylene isomers in rigid Cu-HKUST-1 was investigated at three temperatures (348 K, 373 K, and 398 K) respectively. We mainly use molecular dynamics to calculate the diffusivity of each xylene isomer gas particle in limited system size, and the Mean Square Displacement obtains the diffusivity (MSD),30 as indicated in eqn (5). MSD is the average ensemble after balance, and the sequential n-order algorithm31 used to measure MSD can capture the correlation, in short, medium, and long-time conveniently and effectively.32,33 The MSD for all molecular dynamics runs was calculated every 100 timesteps using the centroid form. It is worth noting that the effect of any drift in the mass of atoms in this study was subtracted before calculating the displacement of each atom.34 The data are processed as 250 uniformly distributed multiple time starting points, and the diffusivity (D) is estimated from the slope of MSD over the time interval δt by the Einstein relation (eqn (6)),35 with dα being the spatial dimension (dα = 3).
| |
 | (5) |
where
Nα is the number of molecules or atoms in component
α,
t is time, and (
t0 +
t) − (
t0) is the vector distance traveled by particle
i in component
α in a period.
| |
 | (6) |
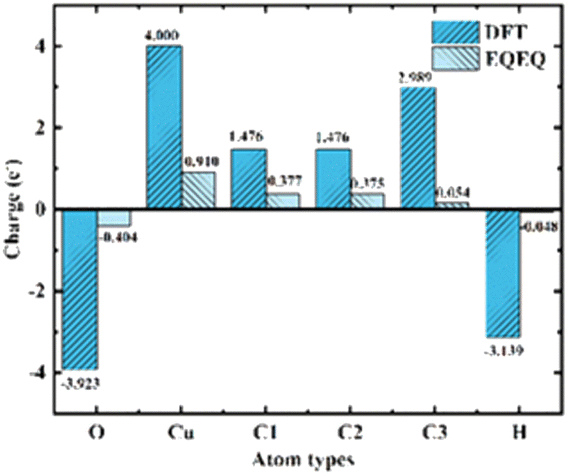
2.2.3 Charge calculation. E. W. Christopher et al.36 developed an extended charge balance (EQeq) method that includes all available ionization energies for each atom in the periodic table to estimate the charge of Cu-HKUST-1. As for the charge part, two charge calculation schemes, EQeq and DFT, were carried out. Although DFT computes charges more accurately, EQeq charges perform as well as electrostatic potentials due to the more extensive computational system. EQeq requires only a fraction of the computational cost, and approximation schemes such as the EQeq method may produce reasonable predictions in less time. We simultaneously compare the changing trend of the two charge calculation results (Fig. 4). DFT calculated the atomic charge of the xylene isomer. Considering the large model of metal–organic frame structure and a large number of atoms, the atomic charge of the frame structure was calculated by EQeq. See charge calculation details in ESI S3.†
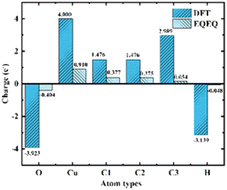 |
| | Fig. 4 Comparison of charge calculated by EQeq and DFT. Atomic types are illustrated in Fig. 2(b). | |
3 Results and discussion
3.1 Characterization of Cu-HKUST-1
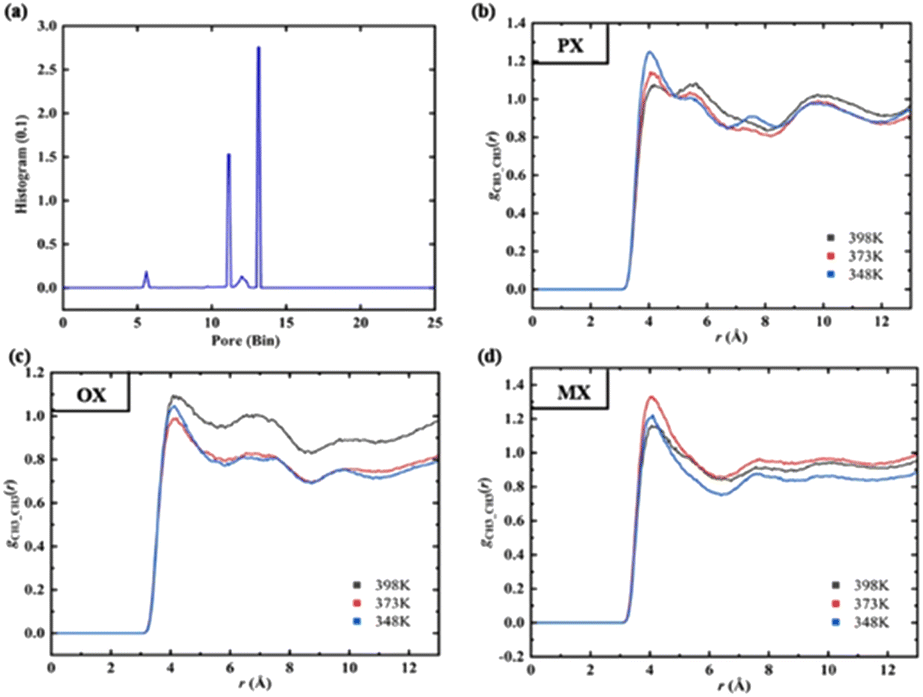
We used Zeo++ v0.3 version37 to characterize the structure of Cu-HKUST-1 in terms of pore limit diameter (PLD), maximum cavity diameter (LCD), body surface area (SBET), free volume (Vfree), and porosity (φ). Table S6† shows the detailed parameters. The spherical probe (N2) measures the pore structure distribution. This analysis gives an exact distribution of the pore size for materials consisting of spherical, cylindrical, or slit-type pores. This geometric pore size definition is still fully applicable to irregular materials.38 The pore size distribution (PSD) Fig. 5(a) is calculated geometrically in Zeo++ by using the Voronoi methods (Fig. S6†).
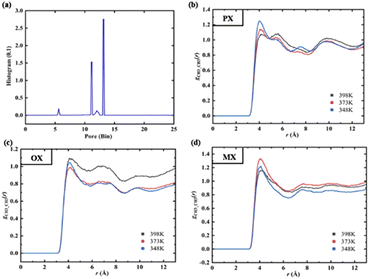 |
| | Fig. 5 (a) Histogram of the pore size distribution (PSD). (b–d) RDF between –CH3 group of xylenes at different temperatures. | |
The PSD gives information about the size of specific pores corresponding to each point in the void volume, finding the giant sphere that encloses the issue but does not overlap with any frame atom, which gives the cumulative pore volume curve.39 For the principle of the analysis, see Fig. 5(b–d). In the present study, each cell is set up with 5000 Monte Carlo samples, and the fraction of sample points in the nodal sphere is 0.38, where the minimum atomic radius is 1.2 Å, while the maximum atomic radius is 1.7 Å. By default, the histogram has 1000 containers of size 0.1 Å. It is recommended to use a detection radius similar to the atomic radius, which should have a peak accuracy of 0.1 Å. Some material characterization supplements for Cu-HKUST-1 are included in ESI S5.†
3.2 Adsorption of xylene isomers
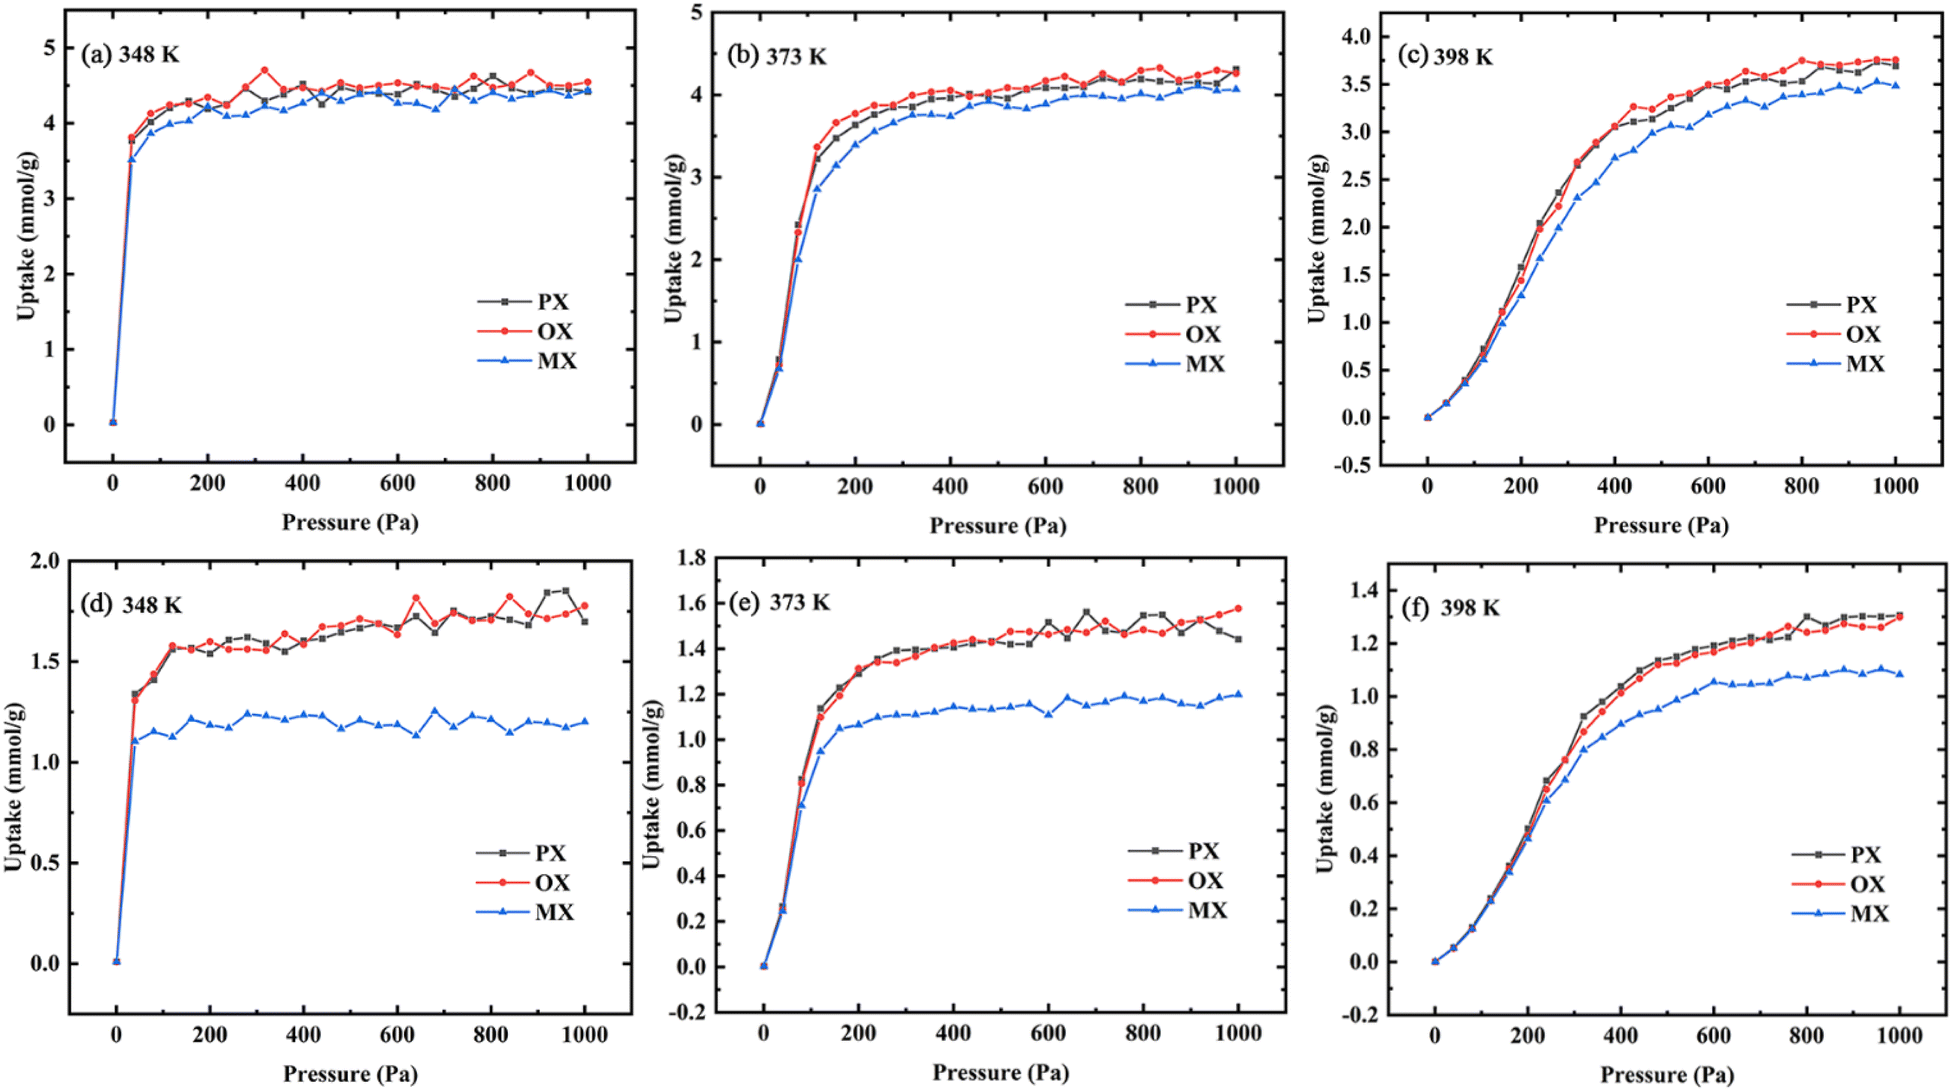
3.2.1 Gas uptake. The basic concepts of adsorption science are adsorption isotherms, which describe the interaction between adsorption and adsorbent.40 In this paper, the adsorption isotherms of xylene isomers in Cu-HKUST-1 were described using the GIBBS ensemble method.41 Fig. 6 shows the adsorption isotherms of Cu-HKUST-1 for single components (a), (b), (c) and ternary mixed components (d), (e), (f) at 348 K, 373 K, and 398 K, respectively. The selectivity trend for ternary mixtures is the same as that for single components. In Fig. S7,† this selectivity with increasing pressure is consistent with the previous breakthrough experiments at 398 K.43 The characterized adsorption order (OX > PX > MX) obtained by simulation is consistent with the experiment at the highest temperature of 398 K. However, the gas uptakes obtained by simulation is significantly higher than the experimental data, which may be related to the influence of impurity error in the experimental process. Moreover, the rigid metal–organic frameworks used in the simulation have better adsorption and separation performance. In the adsorption process of single components and ternary mixed components, the increasing temperature leads to a decrease in the total adsorption capacity of the channel. The isotherms at 348 K and 373 K are much steeper than the isotherms at 398 K. This may be due to the effect of temperature on the structure of the metal–organic skeleton, resulting in the change of the frame structure with temperature. In the equimolar ternary mixture, Cu-HKUST-1 showed significant selectivity for MX/OX and MX/PX with the change of temperature. The adsorption tendency of OX and PX was better than MX, but the adsorption capacity of each isomer component in the single component was not much different.
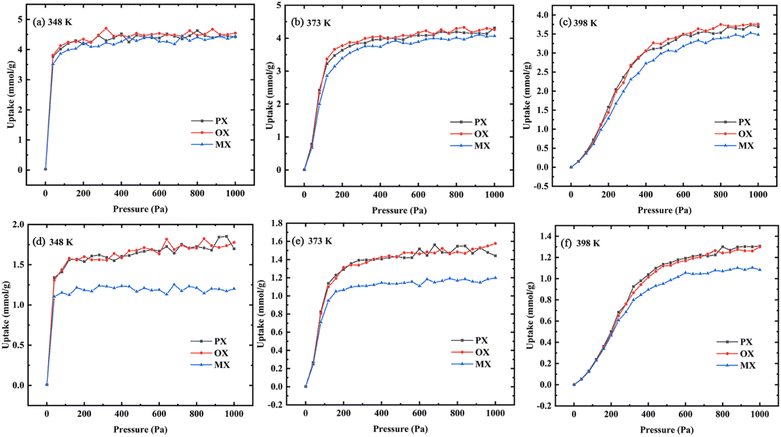 |
| | Fig. 6 Adsorption isotherms of single-component (a–c) and ternary mixed component (d–f) in Cu-HKUST-1 at different temperatures (PX, square; OX, circular; MX, triangle). | |
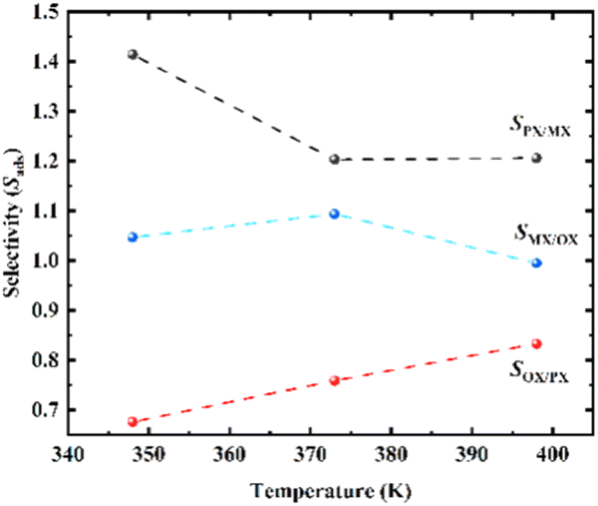
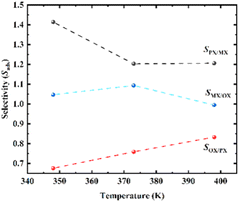
Adsorption selectivity (Sads) is a crucial research index to evaluate the separation performance of MOF adsorbed gas.42,44 The ideal selectivity is calculated as the ratio of the single component absorption (N) of the more adsorbed gas component (i) to the absorption of the other gas species (j) at a predetermined pressure (eqn (7)). The separation simulation results of equimolar mixed xylene isomeric components on Cu-HKUST-1 material are shown in Table 1. Selectivity values (Sads) for separation of binary mixtures of xylenes as shown in Fig. 7.
Table 1 Overview of separation selectivity for xylene isomers on MOFs
| Adsorbent |
T (K) |
Adsorption capacity (mmol g−1) |
Separation selectivity (Sads) |
Adsorption trend |
Ref. |
| PX |
OX |
MX |
OX/MX |
MX/PX |
OX/PX |
| Experimental values obtained from breakthrough experiments. Two isomers could not be separated. |
| MOF-5 |
423 |
— |
— |
— |
0.53 |
1.21 |
0.65 |
MX > PX > OX |
45 |
| 553 |
— |
— |
— |
1.07 |
1.78 |
1.91 |
OX > MX > PX |
45 |
| MOF-monoclinic |
423 |
— |
— |
— |
2.24 |
0.23 |
0.52 |
OX > MX > PX |
45 |
| 453 |
— |
— |
— |
0.58 |
0.24 |
0.14 |
PX > MX > OX |
45 |
| CPO-27-Ni |
398 |
— |
— |
— |
1.67 |
2.00 |
3.33 |
OX > MX > PX |
43 |
| 298a |
— |
— |
— |
0.4 |
0.8 |
0.7 |
PX > MX > OX |
46 |
| Cu-HKUST-1 |
348 |
1.70 |
1.78 |
1.20 |
1.47 |
0.71 |
1.05 |
OX > PX > MX |
This work |
| 373 |
1.44 |
1.58 |
1.20 |
1.31 |
0.83 |
1.09 |
|
This work |
| 398 |
1.31 |
1.30 |
1.08 |
1.20 |
0.82 |
1.00 |
|
This work |
| NaY |
398 |
— |
— |
— |
0.63 |
2.50 |
1.43 |
MX > OX > PX |
43 |
| UIO-66 |
398 |
— |
— |
— |
6.87 |
1.36 |
9.35 |
OX > MX > PX |
47 |
| 423 |
0.14 |
1.24 |
0.21 |
7.30 |
1.23 |
8.95 |
|
47 |
| CD-MOF-1 |
298 |
— |
— |
— |
5.7 |
1.9 |
10.8 |
|
48 |
| 318 |
— |
— |
— |
6.1 |
1.3 |
7.9 |
|
48 |
| Co2(dobdc) |
306a |
— |
— |
— |
2.5 |
1.6 |
3.9 |
|
49 |
| 298a |
— |
— |
— |
— |
0.4 |
b |
|
50 |
| 343a |
— |
— |
— |
1.17 |
2.07 |
1.01 |
|
51 and 52 |
| MIL-47 |
343 |
— |
— |
— |
8.2 |
5.7 |
1.4 |
|
52 |
| 383 |
— |
— |
— |
3.5 |
3.0 |
1.5 |
|
51 |
| 423 |
— |
— |
— |
3.2 |
1.9 |
1.5 |
|
51 |
| 298 |
— |
3.37 |
— |
2.7 |
b |
3.5 |
|
53 |
| MIL-53 (Al) |
313 |
— |
6.76 |
— |
2.1 |
— |
2.1 |
|
54 |
| 323 |
— |
— |
— |
1.58 |
1.83 |
2.53 |
|
54 |
 |
| | Fig. 7 Selectivity values (Sads) for separation of binary mixtures of xylenes on Cu-HKUST-1 at 1000 Pa. | |
Compared with several MOFs with better separation performance of xylene isomers, it is found that most MOF materials are better selective for OX than the other two isomers (Table 1). MOF-5 exhibit PX preferential adsorption in low pressure. As pressure increases, MOF-monoclinic adsorption to PX increases significantly, and OX and MX adsorption do not change significantly.45 CPO-27-Ni and Cu-HKUST-1 have similar separation behaviors, both are OX selective adsorbents, MX and PX are saturated before OX. However, the separation selectivity of CPO-27-Ni is higher than Cu-HKUST-1. Cu-HKUST-1 is inherently less selective for PX, with little apparent separation observed for MX/PX mixtures. The layered Cu-HKUST-1 microcrystals obtained in this work show better separation ability for PX than previously reported Cu-HKUST-1 single crystals under similar conditions, while other MOFs as a whole show no obvious selection advantage for PX.43,46 At low pressure, OPLS and charged AUA models predicted that UiO-66 was selective to OX over the entire pressure range. Trappe expanded models predict higher para-xylene capacities at pressures higher than 3–7 kPa. The results show that the adsorption capacity of OX is higher than that of other isomers, and the least adsorption is PX.47 CD-MOF-1 has high selectivity for xylene isomers. The maximum separation for OX/PX is shown at 298 K and 318 K in CD-MOF-1, and the dynamic adsorption capacity for PX increases with temperature increase. At 318 K, PX and MX first elute as a mixture, which is similar to MIL-53 (Al).48,54 In terms of separation factor Co2 (dobdc) and Co2(m-dobdc) performed better than NaY separation of industry-related zeolite materials.49 Both the experiment and the molecular simulation show that MIL-47 has great adsorption selectivity to xylene isomer, the selectivity factor obtained at low temperatures is larger than that of the experiment. The MIL-53 of xylene (Al) is the strongest in OX adsorption. Compared with MIL-53 (Al), MIL-47 has a smaller aperture (about 6 Å) and exhibits better xylene selectivity. Cu-HKUST-1 OX is retained preferentially over the other two isomers, similar to the performance of MIL-53 (Al). Compared to MIL-53 (Al), MIL-47 has a preference for PX and shows poor selectivity between OX.50
The Langmuir and Freundlich models were used to fit the absolute adsorption curves nonlinearly, some properties of the adsorbent were derived from the model fitting parameters (Table S7†).55 The isotherm constants and correlation coefficients were fitted as shown in Table S8.† The Langmuir and Freundlich isotherm models were statistically significant at the 95% confidence level. We discussed the shape of the isotherms to predict the desirability of the adsorption system. We found that the adsorption of Cu-HKUST-1 on xylene isomers correlated well with the adsorption of the Langmuir equation (r2 > 0.95), whereas the adsorption of Cu-HKUST-1 on xylene isomers correlated poorly with the adsorption of the Freundlich equation (r2 < 0.95). Therefore, according to the requirement of correlation coefficient r2 > 0.95, the isotherm of adsorption of Cu-HKUST-1 on xylene isomers coincides with the conditions for fitting the Langmuir equation.
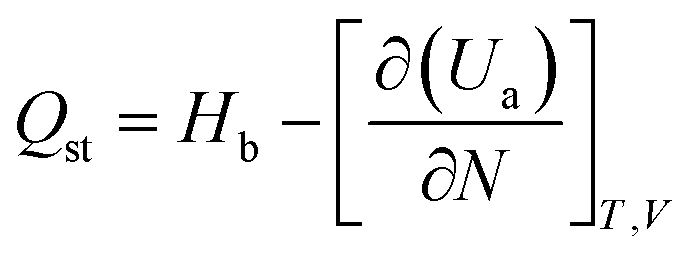
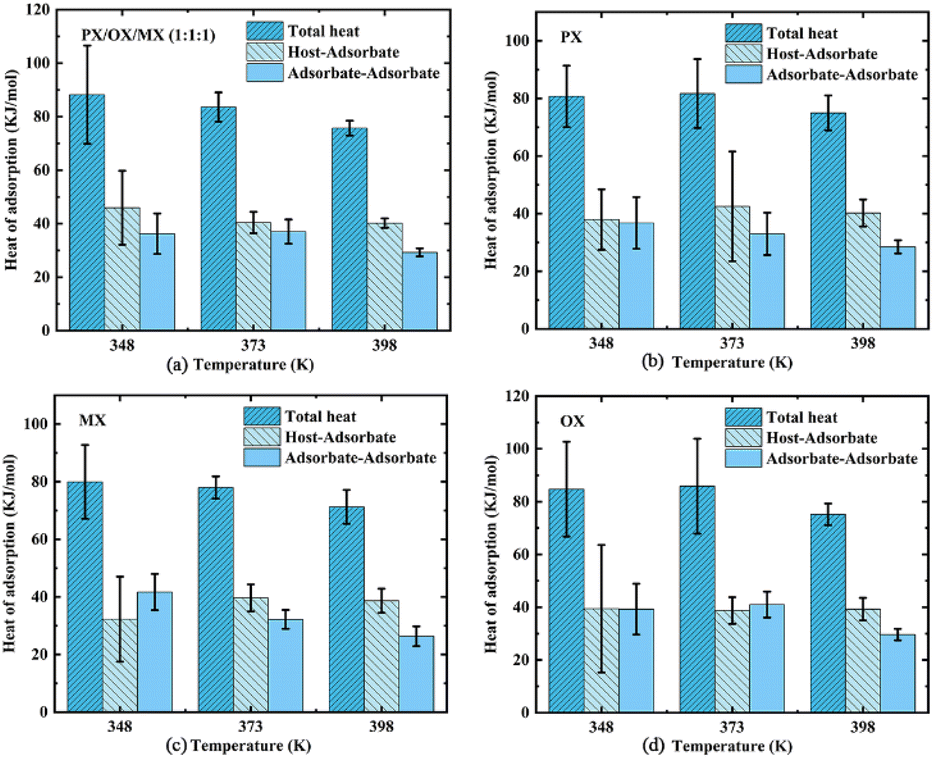
3.2.2 Adsorption heat. The heat generated by the adsorption process is the adsorption heat, which can accurately represent the adsorption phenomenon's physical or chemical nature, the activity of the adsorbent, and the strength of the adsorption capacity.35 The magnitude of the adsorption heat shows the ability of adsorption. The greater the adsorption heat, the stronger the adsorption capacity. The heat of adsorption obtained under different pressure conditions can be statistically analyzed. Using the fluctuation method under the ideal gas hypothesis, the isothermal adsorption heat can be easily calculated from GCMC simulation. Isothermal adsorption heat can be calculated by eqn (8).| |
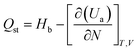 | (8) |
where Hb is the enthalpy of the bulk phase, Ua is the energy of the adsorption phase, and N is the number of adsorbed molecules. The adsorption heat of xylene isomers in Cu-HKUST-1 is shown in Table 2. The heat comparison of adsorption under equimolar mixing at different temperatures is shown in Fig. 8.
Table 2 Adsorption heat of xylene isomer in Cu-HKUST-1 at 1000 Pa (kJ mol−1)
| T (K) |
Total heat |
Host-adsorbate |
Adsorbate–adsorbate |
PX/OX/MX (1![[thin space (1/6-em)]](https://www.rsc.org/images/entities/b_char_2009.gif) :1:1) _1000 Pa :1:1) _1000 Pa |
| 348 |
88.200 |
45.933 |
36.222 |
| 373 |
83.589 |
40.401 |
37.018 |
| 398 |
75.705 |
40.179 |
29.260 |
|
| PX_1000 Pa |
| 348 |
80.717 |
37.977 |
36.767 |
| 373 |
81.706 |
42.521 |
32.988 |
| 398 |
74.968 |
40.222 |
28.473 |
|
| OX_1000 Pa |
| 348 |
84.711 |
39.432 |
39.273 |
| 373 |
85.870 |
38.707 |
40.984 |
| 398 |
75.170 |
39.262 |
29.619 |
|
| MX_1000 Pa |
| 348 |
79.948 |
32.292 |
41.681 |
| 373 |
77.979 |
39.653 |
32.197 |
| 398 |
71.230 |
38.669 |
26.351 |
 |
| | Fig. 8 The comparison of adsorption heat and overall adsorption heat between adsorbent and adsorbent at different temperatures and the correlation error analysis. | |
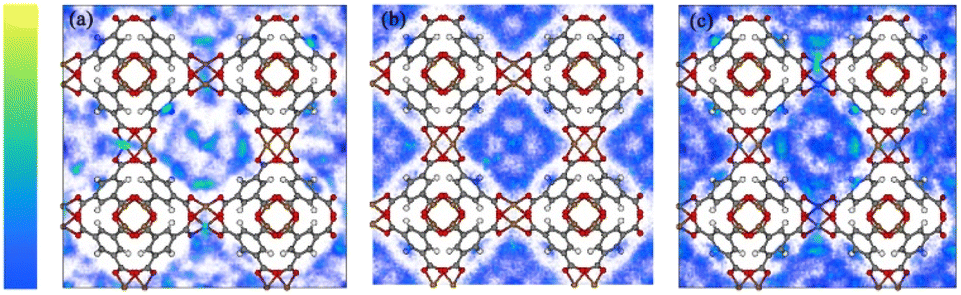
Combinations of potential energy functions for all positions and directions of the gas molecules were used to generate configurations. These integrals are solved in GCMC simulations to obtain the probability densities of gas molecules at different adsorption sites. Such densities reflect minor differences in the adsorption heat. Further insight into the interaction energy trend of the xylene isomer with the adsorbent surface can be obtained by observing the simulated probability densities at the PX, MX, and OX positions, respectively, in the Cu-HKUST-1 material (Fig. 9). It reflects the slight difference in adsorption heat. As a result of the interaction between the adsorbent and Cu-HKUST-1, the adsorption molecular dynamics size is large, preventing the entry of molecules through micropores and mesopores.
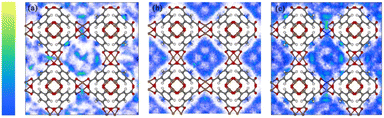 |
| | Fig. 9 Probability density plot of adsorbate locations in Cu-HKUST-1 generated by Monte Carlo NVT simulations. (a) PX, (b) MX, and (c) OX. The yellow region is stronger than the blue region. Adsorption density of PX at 348 K and 398 K (Fig. S8†). | |
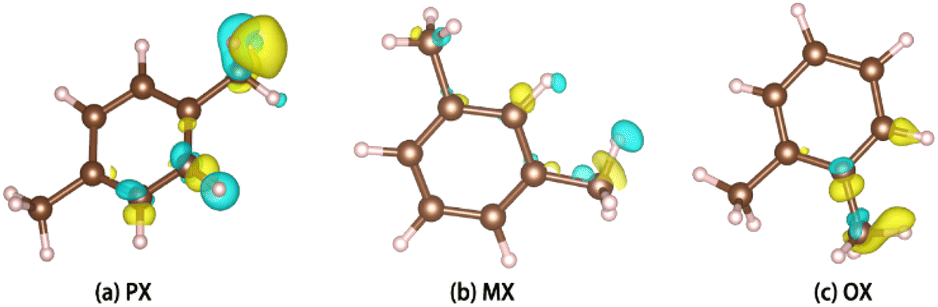
PX, MX, and OX isomers lose electrons at the hydrogen end after adsorption, and the charge distribution of hybrid orbitals around the carbon atom changes. Charge difference means that the three isomers interact strongly with the metal skeleton (Fig. 10).
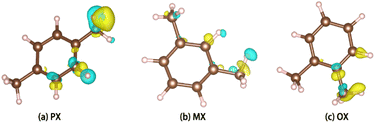 |
| | Fig. 10 Charge difference diagram. | |
3.2.3 Henry's constants. In order to evaluate the gas-adsorbent interaction and predict the capture and separation performances of xylene isomers under dilute conditions for Cu-HKUST-1. We calculated Henry's constants (eqn (9)) based on single component sorption isotherms by using RASPA as shown in Table 3, the Henley coefficients of the xylene isomers in Cu-HKUST-1 are the same within a deviation of less than 1%. The Henry coefficient was often used to describe the affinity between the adsorbate molecules and the porous frameworks. Henry's constant is a useful measure of the adsorbent affinity for adsorbates, because it represents the partition of the adsorbate between its bulk phase and adsorbed phase at very low pressures.57| |
 | (9) |
where T, ρ, N, kB, and Ui are the adsorbent temperature, density, number of grid points, Boltzmann constant, and the potential energy of a single grid.
Table 3 The calculation results and experimental data of Henry coefficient of Cu-HKUST-1 (10−4 mol kg−1 Pa−1)
| |
T (K) |
Method |
PX |
MX |
OX |
Ref. |
| Henry's constants were calculated from pure component adsorption isotherms at 298 K. |
| Cu-HKUST-1 |
298a |
Simul. |
4.4 |
4.1 |
3.9 |
This work |
| 423 |
Simul. |
1.9 |
1.6 |
1.9 |
43 |
| CPO-27-Ni |
423 |
Simul. |
1.9 |
4.4 |
4.7 |
43 |
| MIL-47 |
543 |
Simul. |
2.3 |
1.9 |
2.7 |
51 |
| Exptl. |
2.2 |
2.1 |
2.9 |
56 |
Using Henry coefficients to predict the separation performance.58 The dilution selectivity represents the separation capacity of the material, usually dividing the calculated individual Henry coefficients by the zero loading, see eqn (10).
As shown in Table 3, the order of Henry's coefficients is PX > MX > OX, which agrees well with the relative adsorption of xylene isomers at low temperature.46 By identifying the Henry coefficients from the pure component, the thermodynamic selectivity of MX/PX, OX/MX, and OX/PX were predicted to be 0.93, 0.95, and 0.87 at dilute conditions at 298 K, respectively. The results of the calculation reaffirmed the previous observation that separation performance in Cu-HKUST-1. SPX/MX > 1 indicates that PX is preferentially adsorbed, and SOX/MX < 1 suggests that MX is preferentially adsorbed. However, the OX/PX selectivity of Cu-HKUST-1 is relatively low because the electrostatic interactions favoring OX are offset by weak para-selection. With the increase of temperature, Henry's coefficient of OX is the largest. These results further demonstrated that small pores with the narrow pore size distribution of Cu-HKUST-1 could effectively increase the framework-OX interactions and make it expectedly potential for OX capture and separation under dilute conditions.
3.3 Diffusion coefficients
In high-throughput molecular adsorption dynamics simulations, diffusion coefficients are commonly used to calculate the gas diffusivity of MOF materials.59 The self-diffusion coefficient of xylenes are determined by using Einstein's relation (MSD method). Diffusivity is in turn related to the MSD of the adsorbed gas molecules. The MSD is measured over time to determine whether the fluid is acting due to diffusion alone. We can use the coordinates of each atom, the velocity, or the center of mass of each molecule. The reason we use the center of mass of the molecule in our study instead of the individual atomic coordinates is that when atomic coordinates are used, the vibrational displacements of individual atoms are tracked over a short period while the center of mass displacement performs better.
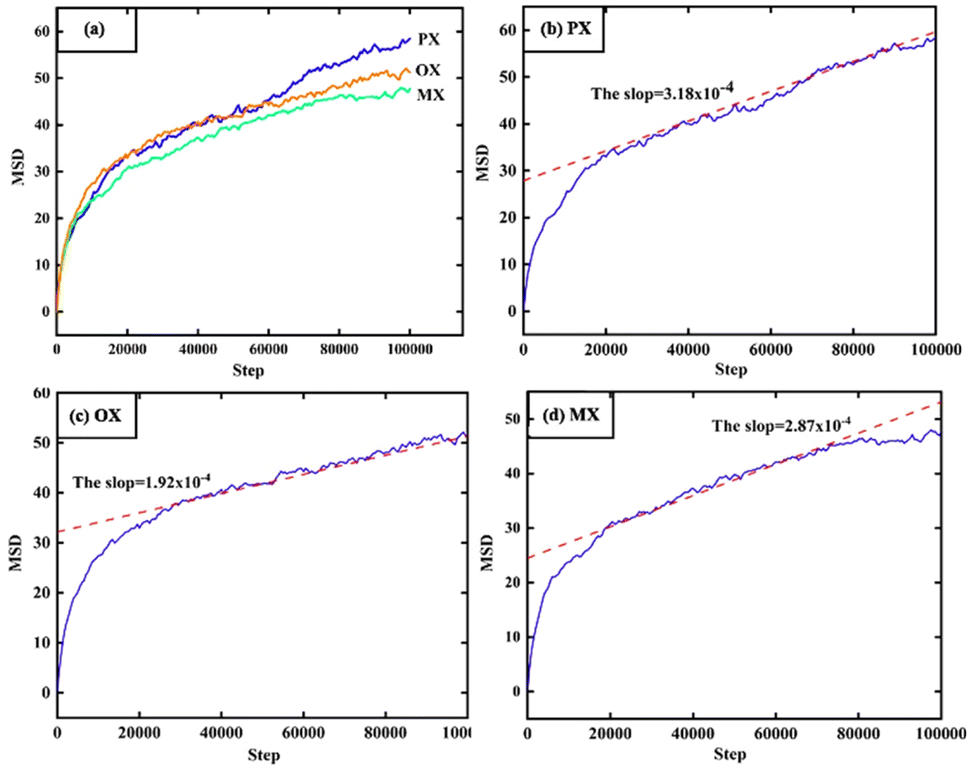
In Fig. 11, the MSD is plotted as a function of time for 1000 configurations of xylene isomer gas after the equilibrium cycle obtained from the simulation trajectory. Since the MSD accuracy decreases rapidly with time after the MSD becomes linear, we fit the diffusion coefficients from multiple data points and the fit should be limited to the linear diffusion region of the MSD-ΔT curve. The diffusion coefficients of each component are shown in Table 4.
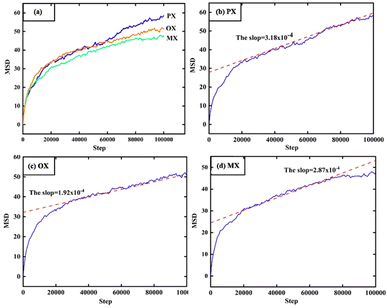 |
| | Fig. 11 MSD, results of molecular dynamics (MD) at the 398 K and 1000 Pa. | |
Table 4 The simulated value of self-diffusion coefficient of PX, OX, and MX at 1000 Pa
| T (K) |
Diffusion coefficient (1 × 10⁻⁸ m2 s−1) |
| PX |
OX |
MX |
| 348 |
3.05 |
2.89 |
1.98 |
| 373 |
3.20 |
3.10 |
2.10 |
| 398 |
3.18 |
2.87 |
1.92 |
This constant portion of the graph gives the diffusion coefficient. The ballistic region is also seen in Fig. 11 which is the log–log plot of MSD with time and is represented by the parabolic region of the graph very close to origin. In this case, the molecules at the beginning move swiftly in the holes present in the system thereby showing a higher value of diffusion coefficient. After a certain time, the molecules show uniform motion as a result of which we see the linear portion of the plot.
4 Conclusions
In the study, we have found that Cu-HKUST-1 has an unsaturated metal center that contains Cu2+. Therefore, the adsorption site near Cu2+ in the cell exhibits more obvious aggregation, mainly due to the interaction between the dipole moment of the xylene molecule and the electrostatic field of the adsorbent. Based on the adsorption uptakes and adsorption heat, the adsorption trend of the mixed gas of xylene isomers between Cu-HKUST-1 was determined: OX ≈ PX > MX. The adsorption amount and adsorption heat of each component of mixed xylene isomer showed a decreasing trend with the increase of temperature. The adsorption capacity and adsorption heat at 398 K are inferior to that at 348 K and 373 K. This may be caused by the collapse of the skeleton linker with increasing temperature. By analyzing the adsorption heat, we found that the difference between PX and OX was very small, while the adsorption heat of MX was significantly smaller than that of PX and OX. In contrast to the MX molecule, the small volume of the OX molecule can more readily fill the cavity of the Cu-HKUST-1 molecule. When pores are filled, molecular packing or arrangement effects do not enormously change the adsorption behavior. Since the interaction between xylene and unsaturated metal centers is much weaker than the interaction between cations outside the skeleton, there is a lower density of adsorbed phase in Cu-HKUST-1. Finally, we assume that Cu-HKUST-1 has a perfect crystal structure. However, in practice, electrostatic interactions between atoms in the crystal may also have an impact on the actual adsorption process, which may lead to an over or underestimation of the material's adsorption capacity.
Author contributions
The manuscript was written with the contributions of all authors. All authors have approved the final version of the manuscript.
Conflicts of interest
There are no conflicts to declare.
Acknowledgements
We gratefully acknowledge the Jiangsu Postgraduate Research and Practice Innovation Program Project (SJCX22_1433), the Major Basic Research Project of the Natural Science Foundation of the Jiangsu Higher Education Institutions (Grant 21KJA530001).
References
- J. A. Gee and D. S. Sholl, J. Phys. Chem. C, 2015, 120, 370–376 CrossRef.
- Z. W. Qiao, Y. L. Yan, Y. X. Tang, H. Liang and J. W. Jiang, J. Phys. Chem. C, 2021, 125, 7839–7848 CrossRef CAS.
- J. Lannoeye, B. D. Van, V. Belgin, B. Helge and D. D. Vos, Microporous Mesoporous Mater., 2016, 226, 292–298 CrossRef CAS.
- X. H. Bu and J. L. Zuo, Sci. China: Chem., 2016, 59, 927–928 CrossRef CAS.
- K. K. Gangu, S. Maddila, S. B. Mukkamala and S. B. Jonnalagadda, J. Energy Chem., 2019, 30, 140–152 Search PubMed.
- J. Hwang, Korean J. Chem. Eng., 2021, 38, 1104–1116 CrossRef CAS.
- E. Coronado, Nat. Rev. Mater., 2020, 5, 87–104 CrossRef.
- W. Yin, C. A. Tao, F. Wang, J. Huang and J. Wang, Sci. China: Chem., 2018, 61, 391–400 CrossRef CAS.
- C. Y. Sun, C. Qin, X. L. Wang and Z. M. Su, Expert Opin. Drug Delivery, 2013, 10, 89–101 CrossRef CAS.
- D. X. Liu, D. T. Zou, H. L. Zhu and J. Y. Zhang, Small, 2018, 14, 1801454 CrossRef.
- J. Barreto, M. Xavier, P. Rui, D. Martins and G. Bonfait, J. Chem. Eng. Data, 2019, 64, 5407–5414 CrossRef CAS.
- K. Momma and F. Izumi, J. Appl. Crystallogr., 2011, 44, 1272–1276 CrossRef CAS.
- S. S. Y. Chui, S. M. F. Lo, J. P. H. Charmant, A. G. Orpen and I. D. A. Williams, Science, 1999, 283, 1148 CrossRef CAS.
- A. Jp, A. Xb, A. Yl, A. By, A. Py, Y. A. Fei and M. Jie, Environ. Res., 2021, 205, 112425 Search PubMed.
- D. Peralta, K. Barthelet, J. Pérez-Pellitero, C. Chizallet, G. Chaplais, A. Simon-Masseron and G. D. Pirngruber, J. Phys. Chem. C, 2012, 116, 21844–21855 CrossRef CAS.
- H. Daglar and S. Keskin, Coord. Chem. Rev., 2020, 422, 213470 CrossRef CAS.
- P. S. Bárcia, D. Guimares, P. A. P. Mendes, J. A. C. Silva, V. Guillerm, H. Chevreau, C. Serre and A. E. Rodrigues, Microporous Mesoporous Mater., 2011, 139, 67–73 CrossRef.
- T. G. Grissom, C. H. Sharp, P. M. Usov, D. Troya, A. J. Morris and J. R. Morris, J. Phys. Chem. C, 2018, 122, 16060–16069 CrossRef CAS.
- X. Qiao, Y. Liu, Y. Yang, H. Wang, J. Ma, D. Wang, N. Gao, L. I. Lunxi, W. Liu and H. Wang, J. Solid State Chem., 2021, 296, 121956 CrossRef CAS.
- E. J. Maginn, R. A. Messerly, D. J. Carlson, D. R. Roe and R. Elliott, J. Comput. Sci-Neth., 2018, 1, 6324 Search PubMed.
- V. Sadiye and K. Seda, J. Mater. Chem. A, 2019, 7, 2301–2314 RSC.
- J. J. Wardzala, J. P. Ruffley, I. Goodenough, A. M. Schmidt and J. K. Johnson, J. Phys. Chem. C, 2020, 124, 28469–28478 CrossRef CAS.
- B. Sütay and M. Yurtsever, J. Mol. Model., 2017, 23, 1–10 CrossRef PubMed.
- W. D. Cornell, P. Cieplak, C. I. Bayly, I. R. Gould, K. M. Merz, D. M. Ferguson, D. C. Spellmeyer, T. Fox, J. W. Caldwell and P. A. Kollman, J. Am. Chem. Soc., 1995, 117, 5179–5197 CrossRef CAS.
- C. E. Wilmer, K. C. Kim and R. Q. Snurr, J. Phys. Chem. Lett., 2012, 3, 2506–2511 CrossRef CAS.
- B. Seger, Z. Naturforsch A., 2005, 60, 805–813 CrossRef.
- A. K. Rappe, C. J. Casewit, K. S. Colwell, W. A. I. Goddard and W. M. J. Skiff, J. Am. Chem. Soc., 1992, 114, 10024–10035 CrossRef CAS.
- D. David, C. Sofia, E. D. Ellis and Q. S. Randall, Mol. Simul., 2016, 42, 81–101 CrossRef.
- S. Plimpton, J. Compute. Phys., 1995, 117, 1–19 CrossRef CAS.
- S. Keskin and D. S. Sholl, Langmuir, 2009, 25, 11786–11795 CrossRef CAS PubMed.
- D. Dubbeldam, D. C. Ford, D. E. Ellis and R. Q. Snurr, Mol. Simul., 2009, 35, 1084–1097 CrossRef CAS.
- X. Yu, S. Choi, D. Tang, A. J. Medford and D. S. Sholl, J. Phys. Chem. C, 2021, 125, 18046–18057 CrossRef CAS.
- E. J. Maginn, R. A. Messerly, D. J. Carlson, D. R. Roe and R. Elliott, J. Comput. Sci-Neth., 2018, 1, 6324 Search PubMed.
- W. Hui, J. M. Simmons, G. Srinivas, Z. Wei and T. Yildirim, J. Phys. Chem. Lett., 2010, 1, 1946–1951 CrossRef.
- A. Einstein, Ann. Phys., 1911, 19, 289 Search PubMed.
- E. W. Christopher, C. K. Ki and Q. S. Randall, J. Phys. Chem. Lett., 2012, 17, 2506–2511 Search PubMed.
- T. F. Willems, C. H. Rycroft, M. Kazi, J. C. Meza and M. Haranczyk, Micropor. Mesopor. Mat., 2012, 149, 134–141 CrossRef CAS.
- L. D. Gelb and K. E. Gubbins, Langmuir, 1999, 15, 305–308 CrossRef CAS.
- K. S. Walton and R. Q. Snurr, J. Am. Chem. Soc., 2007, 129, 8552–8556 CrossRef CAS PubMed.
- J. G. Mcdaniel, S. Li, E. Tylianakis, R. Q. Snurr and J. R. Schmidt, J. Phys. Chem. C, 2015, 119, 3143–3152 CrossRef CAS.
- Z. P. Athanassios, Mol. Phys., 1987, 62, 701–719 CrossRef.
- D. I. Kolokolov, H. Jobic, A. G. Stepanov, J. Ollivier, S. Rives, G. Maurin, T. Devic, C. Serre and G. Férey, J. Phys. Chem. C, 2012, 116, 15093–15098 CrossRef CAS.
- D. Peralta, K. Barthelet, J. Pérez-Pellitero, D. Peralta, K. Barthelet, J. Pérez-Pellitero, C. Chizallet, G. Chaplais, A. Simon-Masseron and G. D. Pirngruber, J. Phys. Chem. C, 2012, 116, 21844–21855 CrossRef CAS.
- N. Divya, G. B. Deepti, B. Rahul and K. K. Ulhas, J. Mater. Chem. A, 2013, 1, 8828–8835 RSC.
- Z. Y. Gu, D. Q. Jiang, H. F. Wang, X. Y. Cui and X. P. Yan, J. Phys. Chem. C, 2010, 114, 311–316 CrossRef CAS.
- L. Alaerts, C. E. Kirschhock, M. Maes, V. Finsy, A. Depla, J. A. Martens, G. V. Baron, P. A. Jacobs, J. F. Denayer and D. E. D. Vos, Angew. Chem., Int. Ed., 2007, 46, 4293 CrossRef CAS PubMed.
- M. A. Granato, V. D. Martins, A. F. P. Ferreira and A. E. Rodrigues, Microporous Mesoporous Mater., 2014, 190, 165–170 CrossRef CAS.
- L. Chen, D. D. Zhu, G. J. Ji, S. Yuan, J. F. Qian, M. Y. He, Q. Chen and Z. H. Zhang, J. Chem. Technol. Biot., 2018, 93, 2898–2905 CrossRef CAS.
- M. I. Gonzalez, M. T. Kapelewski, E. D. Bloch, P. J. Milner, D. A. Reed, M. R. Hudson, J. A. Mason, G. Barin, C. M. Brown and J. R. Long, J. Am. Chem. Soc., 2018, 140, 3412–3422 CrossRef CAS PubMed.
- J. A. Gee, K. Zhang, S. Bhattacharyya, J. Bentley, M. Rungta, J. S. Abichandani, D. S. Sholl and S. Nair, J. Phys. Chem. C, 2016, 120, 12075 CrossRef CAS.
- J. M. Castillo, T. J. H. Vlugt and S. Calero, J. Phys. Chem. C, 2009, 113, 20869–20874 CrossRef CAS.
- V. Finsy, H. Verelst, L. Alaerts, D. E. D. Vos, P. A. Jacobs, G. V. Baron and E. M. J. Denayer, J. Am. Chem. Soc., 2008, 130, 7110 CrossRef CAS PubMed.
- L. Alaerts, M. Maes, L. Giebeler, P. A. Jacobs, J. A. Martens, J. F. Denayer, C. E. Kirschhock and D. E. D. Vos, J. Am. Chem. Soc., 2008, 130, 14170 CrossRef CAS PubMed.
- M. Maes, F. Vermoortele, L. Alaerts, S. Couck, C. E. A. Kirschhock, J. F. M. Denayer and D. E. DeVos, J. Am. Chem. Soc., 2010, 132, 15277–15285 CrossRef CAS PubMed.
- B. M. Krooss, F. V. Bergen, Y. Gensterblum, N. Siemons, H. J. M. Pagnier and P. David, Int. J. Coal Geol., 2002, 51, 69–92 CrossRef CAS.
- V. Finsy, H. Verelst, L. Alaerts, D. E. D. Vos, P. A. Jacobs, G. V. Baron and J. E. M. Denayer, J. Am. Chem. Soc., 2008, 130, 7110 CrossRef CAS PubMed.
- Z. T. Yan, Y. J. Gong, B. H. Chen, X. N. Wu, Q. liu, L. l. Cui, S. S. Xiong and S. M. Peng, J. Phys. Chem. C, 2019, 239, 116514 Search PubMed.
- C. R. Clarkson and R. M. Bustin, Int. J. Coal Geol., 2000, 42, 241–271 CrossRef CAS.
- J. P. Nan, X. L. Dong, W. J. Wang, W. Q. Jin and N. P. Xu, Langmuir, 2011, 27, 4309–4312 CrossRef CAS PubMed.
Footnote |
| † Electronic supplementary information (ESI) available: Detailed inputs for LAMMPS (ZIP), force field details, grand canonical Monte Carlo simulation details, density functional theory simulation details characterization details, and other support charts and tables. See DOI: https://doi.org/10.1039/d2ra06873g |
|
| This journal is © The Royal Society of Chemistry 2022 |
Click here to see how this site uses Cookies. View our privacy policy here. 
 Open Access Article
 This Open Access Article is licensed under a Creative Commons Attribution-Non Commercial 3.0 Unported Licence
 *ab,
Ting Xianga,
Xiao-Qing Zhoua,
Le Chenb,
Zhi-Hui Zhang
*ab,
Ting Xianga,
Xiao-Qing Zhoua,
Le Chenb,
Zhi-Hui Zhang