DOI:
10.1039/D2RA06580K
(Paper)
RSC Adv., 2022,
12, 33928-33935
Theoretical calculation of spectroscopy properties of selenium bromide cation†
Received
18th October 2022
, Accepted 19th November 2022
First published on 28th November 2022
1. Introduction
With the refinement of the theory of atomic spectroscopy, researchers have achieved the preparation of supercooled atoms, thus achieving the manipulation and imprisonment of atoms.1–3 The preparation of supercooled molecules has also attracted the interest of many researchers. Ultracold molecules can be used in many research areas, such as quantum computing,4 measurements,5,6 dynamics7 and ultracold chemistry.8 More importantly, the potential applications of ultracold molecules are quite attractive, for example, strong interactions of quantum gases, the storage and processing of quantum information, precise control of molecular dynamics, molecular clocks, etc. Due to the complex internal structure of molecules, the spectroscopic properties of their ground and low excited states must be investigated to achieve the preparation of supercooled molecules. Not all molecules can be laser cooled and prepared, and a suitable system must have a highly diagonally distributed Franck–Condon factors that keeps the molecular leap in a near-closed loop. The very short energy level lifetime of the electronically excited state ensures that laser cooling can be performed efficiently.9–11 In a circulating system suitable for laser cooling, the molecule can be laser cooled using a specific wavelength of laser light. Therefore, it is particularly critical to find leptons with a high diagonalized Frank–Condon factors as well as a short radiation lifetime.
In 2010, Shuman12 at Yale University reported an experiment using three laser beams to prepare SrF molecules with temperatures close to supercooling, which first confirmed the feasibility of using lasers to cool molecules directly in experimental. The success of experimental laser cooling of neutral molecules has led many researchers to turn their attention to anions and cations, and people have begun to investigate whether cations are also capable of laser cooling, so that the spectroscopic and transition properties of cations can be studied. The spectroscopic properties of molecules with the same electronic structure as SeBr+ have also been extensively studied. NCl,13 PCl,14 AsCl,15,16 SbCl,17 AsI,18,19 SbBr,20 SbI21 all have the same electronic state structure as SeBr+, which means they may have similar spectroscopic properties. For SCl+ of the same main group, Lu et al.22 calculated the spectroscopic data of the ground and low excited states of this ion, detailed potential energy curves in the Ω state and the potential laser-cooled transition in the Ω state. Wang et al.23,24 calculated the spectroscopic data of SeCl+ and TeCl+ in the Λ–S state as well as in the Ω state, compared in detail the spectroscopic properties in the presence of the same main group of ions, and concluded from detailed calculations that direct laser cooling of SeCl+ and TeCl+ is not feasible. Meanwhile, molecules with the same electronic state structure and the same potential energy curve trend as SeBr+ have also been extensively studied, and Belinassi25 investigated the transition properties between the ground state to the lower excited state of the SeI molecule. In addition, the spectrum properties of AsBr,18,26 a molecule with the same electronic number and electronic state structure as SeBr+, have also been reported. However, the spectroscopic properties and transition properties of SeBr+ are rarely reported, so this paper will investigate the spectroscopic properties and transition properties of SeBr+ and discuss the feasibility of using laser cooling of SeBr+. Discuss the phenomenon of avoided crossing in the Ω states, which means that the potential energy curves of two states with the same symmetry cannot intersect in a diatomic molecule. Since the relative atomic masses of both selenium and bromine are large, the spin–orbit coupling effect is not negligible. The phenomena of avoided crossing in the Ω state will also be more complicated. The obtained calculation results will be compared with ions of the same main group to analyze the similarities and differences of the spectroscopic properties. This would be the first report on SeBr+ molecular spectroscopy data, bridging the experimental and theoretical void.
In this paper, we present the research work in the following sections: the calculation details are shown in Section 2, the results and discussions are shown in Section 3, and the conclusions are shown in Section 4.
2. Computational details
The calculation of the electronic structure of the Λ–S and Ω states of the SeBr+ ion was done using the Molpro2015.1 program package27 developed by Werner et al. Due to the restriction of the Molpro program, the symmetry is reduced to the C2ν subgroup in the calculation of this paper. Single point energy calculations were performed for SeBr+ between the nuclear bond lengths R = 1.5–7 Å. In order to make the data of the obtained potential energy curves smoother, we took a step of 0.02 Å around the equilibrium nuclear bond length.
In the calculations, the initial guessed molecular orbitals and wave functions of the ground state of the SeBr+ ion were first obtained using the Hartree–Fock (HF) method.28,29 On this basis, we used the state-averaged complete active space self-consistent field (SA-CASSCF)30,31 for optimization to obtain the state-averaged multistate wave functions. The internally contracted multi-reference configuration interaction method (icMRCI)32,33 was then used to calculate the correlation energy, and the Davidson correction (+Q) was included for optimization. To improve the accuracy of the potential energy curves for the Λ–S and Ω states, the aug-cc-pVQZ-PP basis set34 was used for both Se+ and Br. The choice of these basis sets implies that a relativistic effective core potential is used in this paper when considering scalar-relativistic effects. In the CASSCF calculation, for SeBr+, we chose 8 molecular orbitals (4, 2, 2, 0) as the active orbitals, denoted as CAS(12,8). These 8 molecular orbitals include the 4s4p orbital of Se+ and the 4s4p orbital of Br. In the calculation of MRCI+Q, we consider the CV correlation effect, where the 3d orbitals of Se+ are used as the correlation level. When considering the spin–orbit coupling effect, the spin–orbit matrix elements and eigenstates are calculated using the spin–orbit pseudopotential.
With our obtained Λ–S and Ω state potential energy curves and calculated transition dipole moments, the one-dimensional radial Schrödinger equation is solved using the LEVEL 8.0 program35 to obtain the equilibrium nuclear bond lengths (Re), harmonic frequency (ωe), first anharmonic correction (ωeχe), rotation constants (Be) and vertical transition energies (Te) of the bound states.
3. Results and discussions
3.1. PECs and spectroscopic constants of Λ–S states of SeBr+
In this paper, the singlet, triplet, and quintet state potential energy curves of SeBr+ ions in the Λ–S state were calculated from two different dissociation limits. The electronic states corresponding to the two dissociation limits and the energy difference between them and the experimental value are listed in Table 1. The difference between the second dissociation limit and the experimental value is 123 cm−1, and this result can well reflect the accuracy of the calculation results in this paper. The calculated potential energy curves are shown in Fig. 1, where the phenomenon of avoided crossing in both the singlet and triplet states, 31Π and 11Φ, 43Π and 13Φ, respectively, occurring at about 2.5 Å of the nuclear bond length. Since the energies of 13Δ and 13Σ+ are very close, their potential energy curves are not easy to identify. 13Δ and 13Σ+ come from the same symmetry and from the same dissociation limit, which means that the spectroscopic properties of these two electronic states are very similar. From the potential energy curves obtained, it can be seen that most of the electronic states are bound and a smaller fraction of them are repulsive.
Table 1 Dissociation limit of Λ–S states of SeBr+ (unit: cm−1)
| Atomic states |
Molecular states |
This work |
Exp.38,39 |
| Se+(4Su) + Br(2Pu) |
X3Σ−, 13Π, 15Σ−, 15Π |
0 |
0 |
| Se+(4Du) + Br(2Pu) |
11Σ+, 11Σ−, 21Σ−, 11Π, 21Π, 31Π, 11Δ, 21Δ, 11Φ, 13Σ+, 23Σ−, 33Σ−, 23Π, 33Π, 43Π, 13Δ, 23Δ, 13Φ |
13![[thin space (1/6-em)]](https://www.rsc.org/images/entities/char_2009.gif) 599 599 |
13476 |
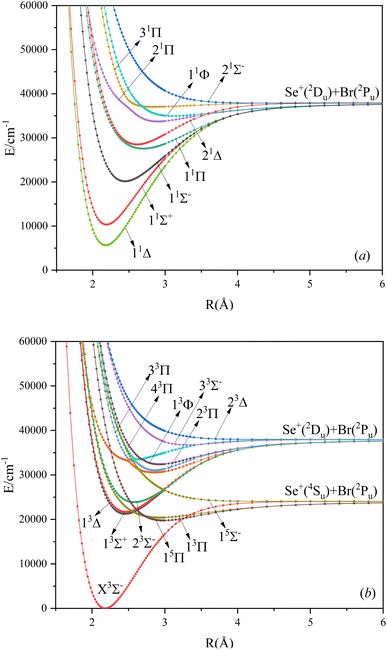 |
| | Fig. 1 The PECs of the Λ–S state for singlet (a), triplet and quintet (b) states of SeBr+. | |
Based on the obtained potential energy curves, we fitted the spectroscopic data of the bound states and show some of them in Table 2. (The spectrum data of all electronic states are shown in Table SI1.†) We will focus on the analysis of the first three electronic states in comparison with the electronic states corresponding to the ions of the same main group. Table 3 shows the spectrum constants of the low excited electronic states of ions in the same main group as SeBr+. The equilibrium bond lengths of SCl+,22 SeCl+,23 TeCl+24 show an increasing trend, while the rest of the spectrum constants show a decreasing trend. The equilibrium bond lengths of the low excited electronic states of SeBr+ are larger than those of SeCl+ and smaller than those of TeCl+. This phenomenon is consistent with the fact that the relative molecular mass of SeBr+ is between SeCl+ and TeCl+. Besides, the rest of the spectrum constants of SeBr+ are smaller than those of SCl+, SeCl+ and TeCl+. Comparing the vertical transition energies of 11Δ and 11Σ+, we found that the overall vertical transition energies of SeCl+ are smaller compared with SCl+, SeCl+, TeCl+. For some neutral molecules with similar electronic state structures as SeBr+, the vertical transition energies from the ground state (X3Σ−) to the first (11Δ) and second (11Σ+) excited states of SbBr36 and AsBr26 are smaller than those of SeBr+, a property similar to that of ions of the same main group. Besides, the spectrum properties of 13Δ and 13Σ+ are very similar, and the difference between the values of various spectrum data is very small.
Table 2 Spectroscopy constants of the Λ–S states of SeBr+
| Λ–S states |
Te/cm−1 |
Re/Å |
ωe/cm−1 |
Be/cm−1 |
ωeχe/cm−1 |
| X3Σ− |
0 |
2.1802 |
378.5 |
0.0905 |
1.0977 |
| 11Δ |
5733 |
2.1776 |
381.7 |
0.0907 |
1.0549 |
| 11Σ+ |
10343 |
2.1890 |
366.1 |
0.0897 |
1.2493 |
| 15Π |
19759 |
2.9854 |
130.5 |
0.0482 |
1.1235 |
| 11Σ− |
20145 |
2.4452 |
257.8 |
0.0719 |
0.8183 |
| 13Π |
20402 |
2.9313 |
104.4 |
0.0500 |
0.8814 |
| 13Δ |
21263 |
2.4542 |
254.7 |
0.0714 |
0.8267 |
Table 3 Comparison of spectrum constants of low excited electronic states of the same main group ions of SeBr+
| Λ–S states |
Monovalent molecules |
Te/cm−1 |
Re/Å |
ωe/cm−1 |
Be/cm−1 |
ωeχe/cm−1 |
| X3Σ− |
SCl+22 |
0 |
1.8779 |
686.1 |
0.2839 |
3.12 |
| SeCl+23 |
0 |
2.0351 |
520.8 |
0.1686 |
1.9586 |
| TeCl+24 |
0 |
2.2287 |
448.9 |
0.1237 |
1.5727 |
| SeBr+ |
0 |
2.1802 |
378.5 |
0.0905 |
1.0977 |
| 11Δ |
SCl+22 |
6334 |
1.8763 |
691.0 |
0.2844 |
2.89 |
| SeCl+23 |
6415 |
2.0310 |
527.7 |
0.1693 |
1.8346 |
| TeCl+24 |
6183 |
2.2244 |
455.0 |
0.1241 |
1.4745 |
| SeBr+ |
5733 |
2.1776 |
381.7 |
0.0907 |
1.0549 |
| 11Σ+ |
SCl+22 |
11171 |
1.8818 |
675.1 |
0.2828 |
3.22 |
| SeCl+23 |
11755 |
2.0374 |
513.3 |
0.1682 |
2.1417 |
| TeCl+24 |
11787 |
2.2289 |
446.6 |
0.1236 |
1.6931 |
| SeBr+ |
10343 |
2.1890 |
366.1 |
0.0897 |
1.2493 |
The main electronic configurations at the equilibrium bond lengths are listed in Table 4. (The electronic configuration of all electronic states at the equilibrium nuclear spacing is shown in Table SI2.†) The electronic configuration of the ground state (X3Σ−) in the equilibrium nuclear bond length attachment is mainly 11σ212σ04π45π46π22δ2, accounting for 83.35%. Similar to the ground state electronic configuration is 11Δ, with a percentage of 79.55%. The electronic configuration of 13Δ and 13Σ+ in the equilibrium nuclear bond length attachment is 11σ212σ04π45π36π32δ2 with the percentages of 87.54% and 87.49%, respectively, a difference of only 0.27%. The reason for this phenomenon is due to the fact that the two states are very close in energy and have similar properties at the equilibrium nuclear bond lengths. The electronic configuration of 33Π and 43Π is also very similar, but the difference in the percentage is 3.59%.
Table 4 Main CSFs around the Re of SeBr+
| Λ–S states |
Main CSFs at Re (%) |
Λ–S states |
Main CSFs at Re (%) |
| X3Σ− |
11σ212σ04π45π46π22δ2 (83.35) |
21Δ |
11σ212σ04π45π36π32δ2 (70.75) |
| 11σ112σ14π45π46π22δ2 (8.96) |
| 11Δ |
11σ212σ04π45π46π22δ2 (79.55) |
23Π |
11σ112σ04π45π46π32δ2 (86.0) |
| 11Σ+ |
11σ212σ04π45π46π22δ2 (74.12) |
33Π |
11σ212σ14π45π36π22δ2 (81.29) |
| 11σ212σ04π45π36π32δ2 (9.0) |
| 13Π |
11σ212σ14π45π46π12δ2 (66.73) |
43Π |
11σ212σ14π45π36π22δ2 (84.70) |
| 11σ212σ14π45π36π22δ2 (15.59) |
3.2. DMs and TDMs of Λ–S states of SeBr+
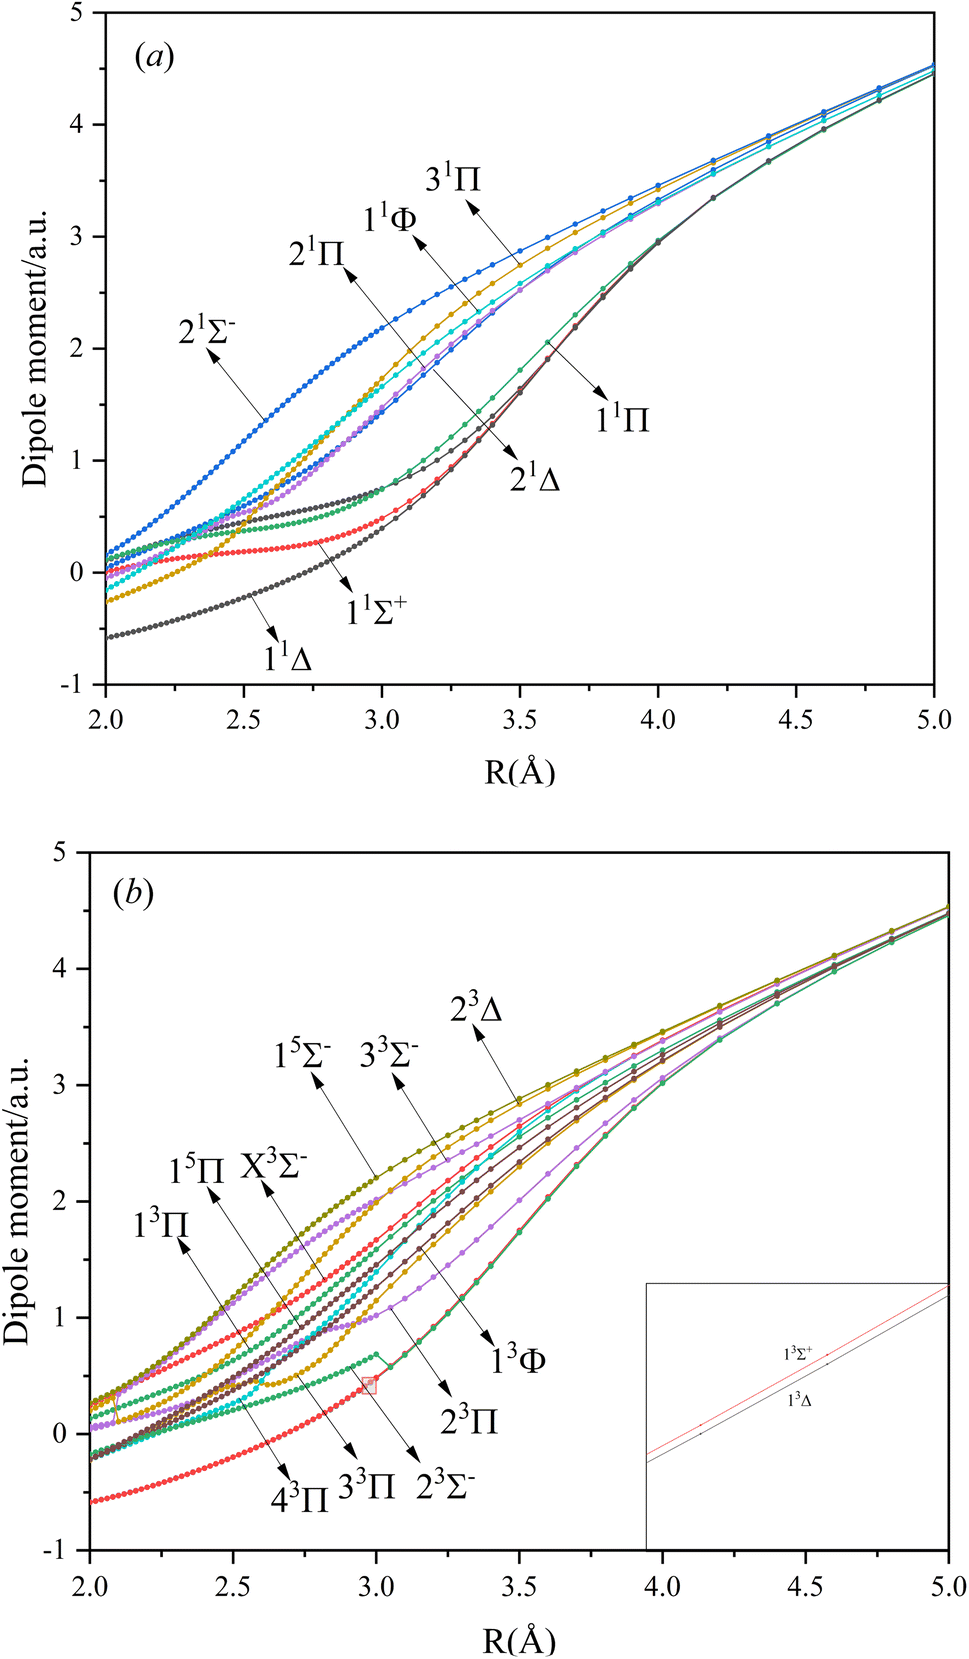
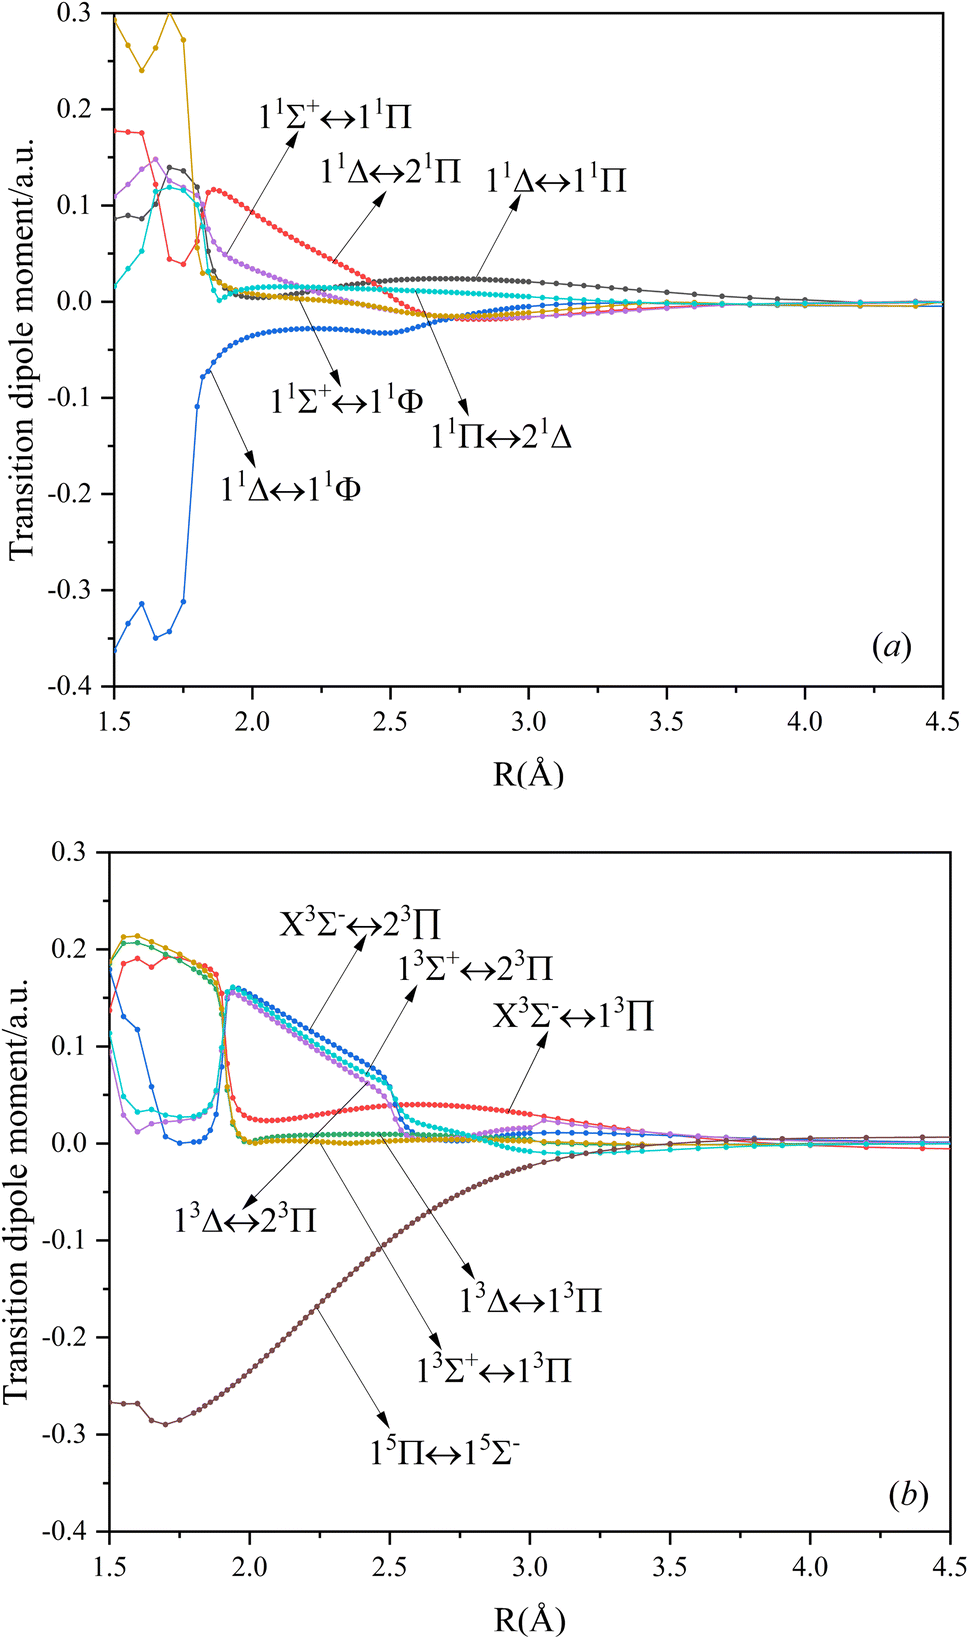
In this paper, the dipole moment and transition dipole moment of SeBr+ are calculated and shown in Fig. 2 and 3, respectively. It can be seen that the calculated dipole moment curve is continuous and smooth, which also proves the accuracy of our potential energy curve calculation results. Since 31Π and 11Φ come from the same symmetry and from the same dissociation limit, there is the phenomenon of avoided crossing between the two states near 2.58 Å, so we exchanged the potential energy curves of the two states at that point as well as the dipole moment to ensure the smooth continuity of the curves. In addition to this, a similar phenomenon of avoided crossing exists for 43Π and 13Φ. Therefore, we also exchanged the potential energy curves and dipole moment curves for both. Because the energies of 13Σ+ and 13Δ are very close, the dipole moment curves of the two are also very close and difficult to identify and distinguish. For the transition dipole moment, the difference between the transition strength between the singlet and triplet states is not very large. There are many crossings between the transition dipole moments of the triplet states, which are caused by the possible existence of avoidance of crossings between 13Π and 23Π. The transition between 15Π and 15Σ− is very strong, reaching a maximum of even 0.3 a.u.
 |
| | Fig. 2 The Dipole moments for singlet (a) and triplet (b) states of SeBr+. | |
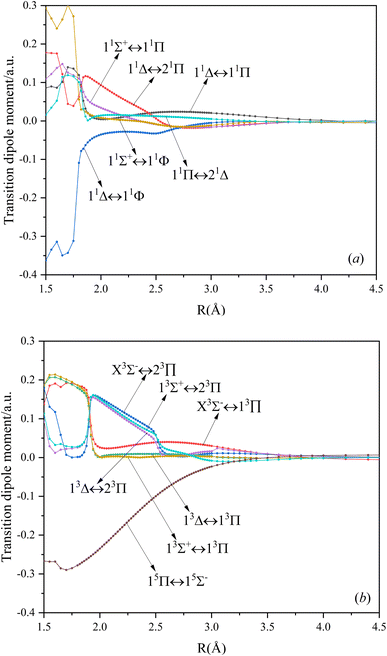 |
| | Fig. 3 The TDMs for singlet (a), triplet, and quintet (b) states of SeBr+. | |
3.3. PECs and spectroscopy constants of Ω states of SeBr+
Considering the spin–orbit coupling effect, the 2D atomic state of Se+ will split into 2D3/2 and 2D5/2, and the 2P atomic state of Br will split into 2P1/2 and 2P3/2. These atomic states correspond to six different dissociation channels, namely: Se+(4S3/2) + Br(2P3/2), Se+(4S3/2) + Br(2P1/2), Se+(2D3/2) + Br(2P3/2), Se+(2D5/2) + Br(2P3/2), Se+(2D3/2) + Br(2P1/2), Se+(2D5/2) + Br(2P1/2). The energy values corresponding to these dissociation channels as well as the experimental values are shown in Table 5. With the increase of the relative atomic mass of the elements, the effect of the spin–orbit coupling effect will have an obvious influence on the spectrum properties, and it can be found that the calculation results in this paper are relatively reliable according to the comparison of the calculated and theoretical values. The potential energy curves are difficult to identify because of the small difference in energy between the second and third dissociation channels. The same property occurs between the fourth and fifth dissociation channels.
Table 5 Dissociation limit of Ω states of SeBr+ (unit: cm−1)a
| Atomic state |
Ω states |
ΔE |
| This work |
Exp.38,39 |
| At the nuclear distance R = 7 Å. |
| Se+(4S3/2) + Br(2P3/2) |
3, 2, 2, 1, 1, 1, 0+, 0+, 0−, 0− |
0.0 |
0.0 |
| Se+(4S3/2) + Br(2P1/2) |
2, 1, 1, 0+, 0− |
3392.3 |
3685.2 |
| Se+(4D3/2) + Br(2P3/2) |
3, 2, 2, 1, 1, 1, 0+, 0+, 0−, 0− |
13824.3 |
13168.2 |
| Se+(4D5/2) + Br(2P3/2) |
4, 3, 3, 2, 2, 2, 1, 1, 1, 1, 0+, 0+, 0−, 0− |
13784.4 |
13908.0 |
| Se+(4D3/2) + Br(2P1/2) |
2, 1, 1, 0+, 0− |
16853.4 |
17224.6 |
| Se+(4D5/2) + Br(2P1/2) |
3, 2, 2, 1, 1, 0+, 0− |
17469.6 |
17297.3 |
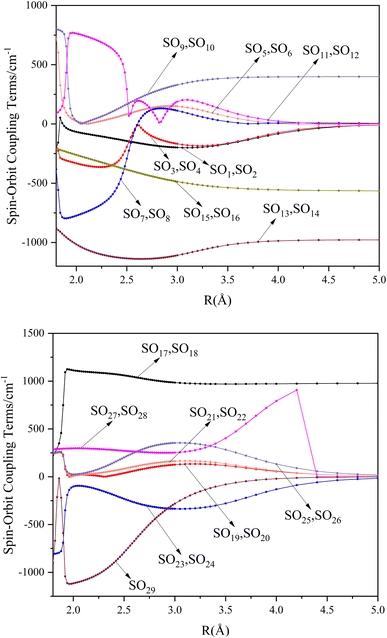
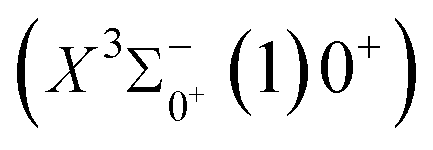
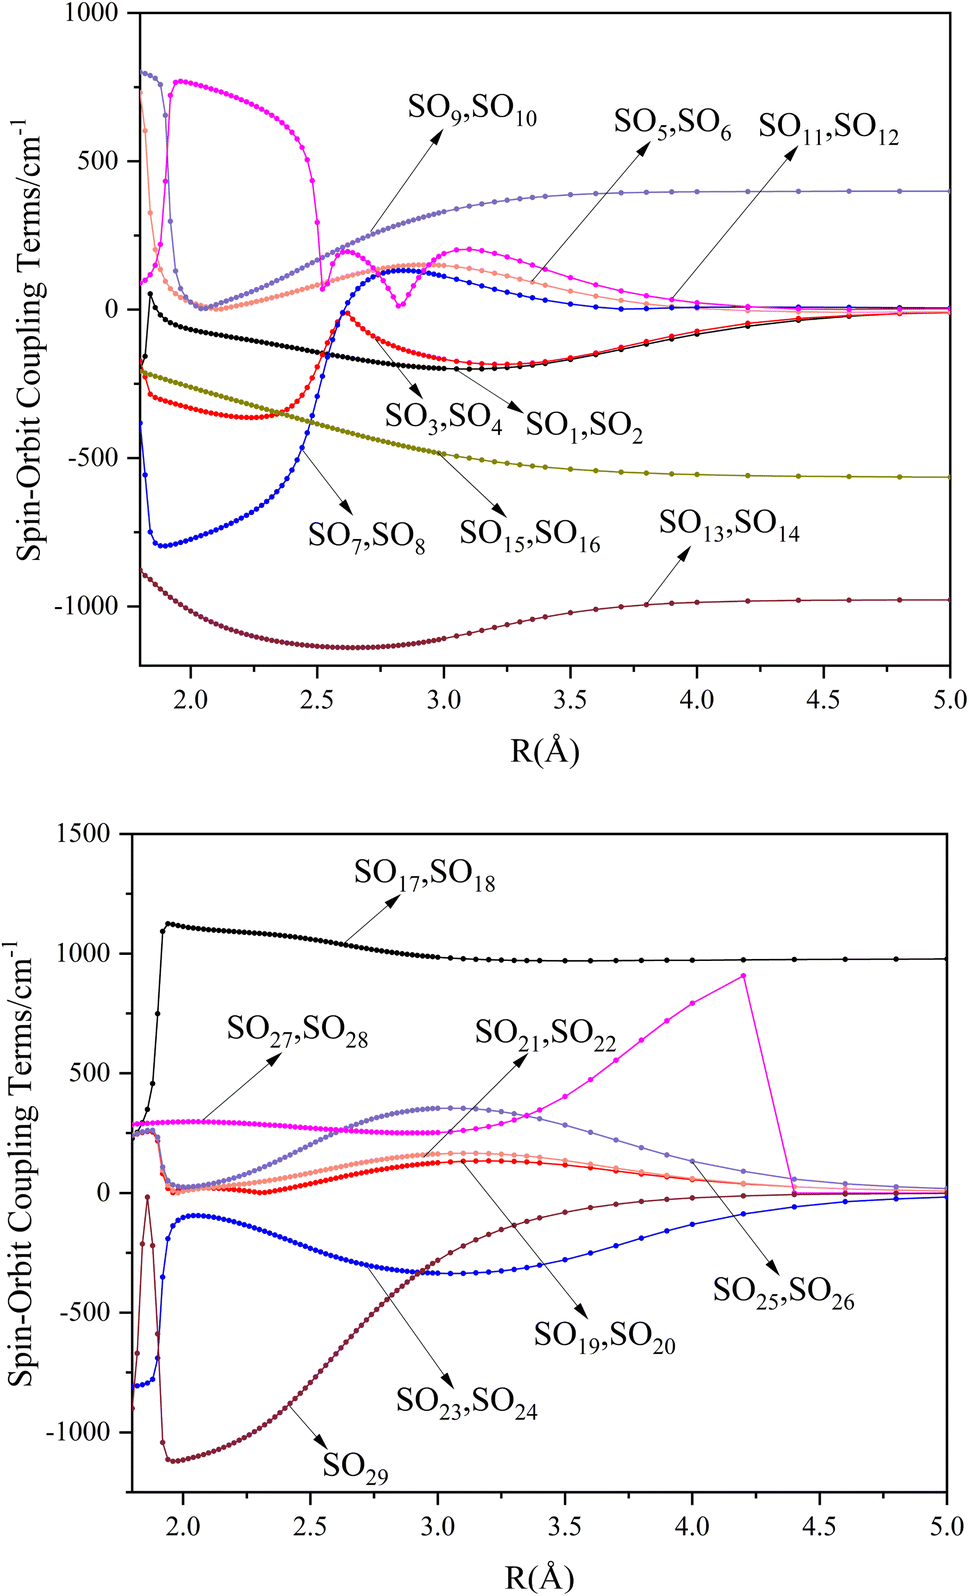
The potential energy curves of the electronic states corresponding to these dissociation channels are shown in Fig. 4. As can be seen from the figure, there is a complex phenomenon of avoided crossing in the Ω state. For the Ω = 0+ state, the phenomenon of avoided crossing occurs mainly in the region between 20000 cm−1 and 35000 cm−1 of energy. The phenomenon of avoided crossing between (3)0+ and (4)0+ is most evident at the nuclear bond length of 2.6 Å. The phenomenon of avoided crossing for the electronic states with Ω = 0− occur mainly between (2)0− and (3)0−, and (7)0− and (8)0−. For the electronic state with Ω = 1, there is a very complex phenomenon of avoided crossing, which occurs mainly around 25000 cm−1 to 30000 cm−1. This phenomenon occurs mainly between nuclear bond lengths of 2.5–3 Å and is more pronounced between some electronic states, for example, between (5)1–(9)1. The phenomenon of avoided crossing between (3)2 and (4)2, (5)2 and (6)2 is very obvious and occurs near the nuclear bond length of 3 Å. For the rest of the electronic states with Ω = 2, it is not easy to observe the phenomenon of avoided crossing, so it will not be discussed in detail. For the state Ω = 3, 4, there is no obvious phenomenon of avoided crossing, so we will not discuss it in detail. Based on the obtained potential energy curves, we obtained the spectroscopic data of some of the lower excited states by solving the one-dimensional radial Schrödinger equation and show them in Table 6. The vertical transition energy from the first excited state(X3Σ−1(1)1) to the ground state  is 418 cm−1, compared with 13 cm−1, 191 cm−1, and 965 cm−1 for SF+,37 SeCl+,23 and TeCl+24 of the same main group, respectively. It can be noticed that this value becomes larger and larger as the relative atomic mass increases. The vertical transition energy of 11Δ2(1)2 also changes somewhat, with a value of 5733 cm−1 in the Λ–S state and 6074 cm−1 in the Ω state. The change in this value indicates that the spin–orbit coupling effect has some influence on SeBr+. The spectroscopic data of the ground state (X3Σ−) did not change significantly after considering the spin–orbit coupling effect. For 11Δ, the vertical transition energy increases and the rest of the spectrum data do not change significantly. The changes before and after the 11Σ+ splitting are mainly reflected in the increase of vertical transition energy and first anharmonic correction, while the equilibrium nuclear bond length and the rest of the spectral data do not change much. In this paper, the SO matrix elements between the SeBr+ electronic states are calculated and the strength of the spin–orbit coupling interaction is determined by their magnitudes, and the possible 29 SO matrix elements between the calculated electronic states are listed in Table SI3.† SO1 and SO2 denote the SO matrix elements between the two components of 11Π and 13Σ+ so they are equal in size. Similarly, SO3 = SO4, SO5 = SO6, SO7 = SO8, SO9 = SO10, SO11 = SO12, SO13 = SO14, SO15 = SO16, SO17 = SO18, SO19 = SO20, SO21 = SO22, SO23 = SO24, SO25 = SO26, SO27 = SO28. The variation of the obtained SO matrix elements with the nuclear bond length is shown in Fig. 5. As a whole, the values of SO1, SO3, SO19, SO21 and SO25 are relatively small, while the rest of the values other than these are relatively large, with the maximum even reaching 1200 cm−1, which is sufficient to show that the rest of the states in the spin–orbit coupling effect are more affected. To ensure the accuracy of the calculation results, the possibility of laser cooling of SeBr+ under the effect of spin–orbit coupling will be discussed in this paper.
 |
| | Fig. 4 The PECs of the Ω states of SeBr+. | |
Table 6 Spectroscopy constants of the Ω states of SeBr+
| Ω states |
Te/cm−1 |
Re/Å |
ωe/cm−1 |
Be/cm−1 |
ωeχe/cm−1 |
 |
0 |
2.1807 |
377.8 |
0.0904 |
1.1034 |
| X3Σ−1(1)1 |
418 |
2.1814 |
376.9 |
0.0904 |
1.1207 |
| 11Δ2(1)2 |
6074 |
2.1786 |
380.5 |
0.0906 |
1.0738 |
 |
11208 |
2.1910 |
363.1 |
0.0896 |
1.4078 |
 |
19076 |
2.4604 |
109.7 |
0.08171 |
3.1312 |
| 23Δ2(2)2 |
19475 |
2.9561 |
125.9 |
0.0492 |
0.7082 |
| 13Σ+1(2)1 |
19829 |
2.8025 |
366.1 |
0.0548 |
17.4129 |
 |
21290 |
2.9441 |
123.5 |
0.0501 |
3.3887 |
 |
| | Fig. 5 SO matrix elements of Λ–S states. | |
3.4. Franck–Condon factors and radiative lifetime of SeBr+
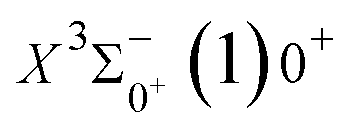
Based on the obtained potential energy curves and the calculated transition data, we used the LEVEL 8.0 program to calculate the Franck–Condon factors between some electronic states of SeBr+, the radiative lifetimes, and the Einstein coefficients. The conditions that enable laser cooling of the molecule are a high diagonalized Franck–Condon factor and a short radiation lifetime, so it is particularly critical to first determine which electronic states can satisfy these conditions between them. For X3Σ−1(1)1, the difference between the equilibrium bond length and the ground state  0.0007 Å, which means that the Franck–Condon factor between the two electronic states is large, but the vertical transition energy is only 418 cm−1, which means that the strength of the transition between the two electronic states is weak and therefore is not a suitable choice. The difference of the equilibrium bond length between 11Δ2(1)2 and the ground state
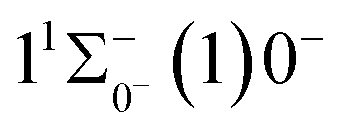
  is 0.0021 Å and the vertical transition energy is 6074 cm−1. However, there is a forbidden barrier transition between the two states, so it does not constitute a circulating cooling system. For
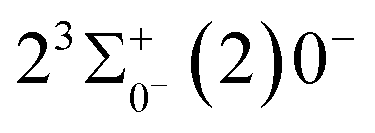
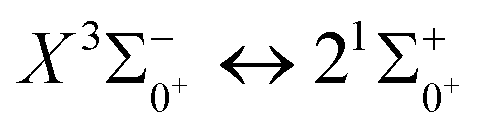
  , the difference in equilibrium bond length from the ground state is 0.0103 Å and the vertical transition energy is 11208 cm−1, which means that this is a potential transition capable of laser cooling. Therefore, in this paper, the Franck–Condon factor between
  , the radiation lifetime, and the Einstein coefficient are calculated. The calculated results are shown in Table 7, where we find that there is a large Franck–Condon factor between these two states, but the radiation lifetime is too long to constitute a recirculating cooling system. Therefore, we tentatively conclude that SeBr+ is not a suitable system for laser cooling.
Table 7 Franck–Condon factors, emission rates (unit: s−1) and radiative lifetimes τ (unit: μs) of the  transition
| Transition |
ν |
ν′ = 0 |
ν′′ = 1 |
ν′′ = 2 |
ν′′ = 3 |
∑A |
τ = 1/(∑A) |
 |
0 |
0.9760 |
0.0235 |
0.0004 |
5.3 × 10⁻⁶ |
177 |
5649 |
| 1 |
0.0237 |
0.9265 |
0.0484 |
0.0012 |
168 |
5952 |
| 2 |
0.0002 |
0.0491 |
0.8737 |
0.0741 |
164 |
6097 |
| 3 |
9.6 × 10⁻⁷ |
0.0008 |
0.0757 |
0.8177 |
160 |
6250 |
4. Conclusion
In this paper, the potential energy curves of 22 Λ–S states and 51 Ω states of SeBr+ were calculated using the ic-MRCI+Q method. Scalar relativistic effects, CV correlation effects and spin–orbit coupling effects are taken into account in the calculations to ensure the accuracy of the results. The obtained potential energy curves were used to fit the spectroscopic data of some of the low excitation bound states in the Λ–S and Ω states using the LEVEL 8.0 program, and some similar properties were obtained by comparative analysis with the same main group of ions. The phenomenon of avoided crossing in the Ω state, which occurs mainly in the energy region from 20000 cm−1 to 40000 cm−1 and between the lower excited electronic states, is discussed in detail. In order to explore the transitional cycle system that can realize laser cooling, this paper calculates the transitional data between  in the Ω state and obtains the Franck–Condon factor, radiation lifetime and Einstein coefficient between the two states. According to the results of the current calculations, SeBr+ is not a suitable system for laser cooling. The calculated results will be useful for further study of laser cooling SeBr+ ions.
Conflicts of interest
There are no conflicts to declare.
Acknowledgements
This work is supported by the Pre-Research Project of Yibin University (No. 2019YY06), Opening Foundation of Sichuan Province Engineering Research Center for Powder Metallurgy, Chengdu University (No. SC-FMYJ2021-01) and Natural Science Foundation of Sichuan Province (No. 2022NSFSC1817).
References
- N. H. Bings, A. Bogaerts and J. A. C. Broekaert, Anal. Chem., 2006, 78, 3917–3946 CrossRef CAS.
- X. Hou and B. T. Jones, Microchem. J., 2000, 66, 115–145 CrossRef CAS.
- W. Kob and H. C. Andersen, Phys. Rev. Lett., 1994, 73, 1376–1379 CrossRef CAS.
- A. Micheli, G. Brennen and P. Zoller, Nat. Phys., 2006, 2, 341–347 Search PubMed.
- V. Flambaum and M. Kozlov, Phys. Rev. Lett., 2007, 99, 150801 CrossRef CAS PubMed.
- J. J. Hudson, D. M. Kara, I. Smallman, B. E. Sauer, M. R. Tarbutt and E. A. Hinds, Nature, 2011, 473, 493–496 CrossRef.
- A. collaboration, J. Baron, W. C. Campbell, D. DeMille, J. Doyle, G. Gabrielse, Y. Gurevich, P. Hess, N. R. Hutzler and E. Kirilov, Science, 2014, 343, 269–272 CrossRef PubMed.
- R. V. Krems, Phys. Chem. Chem. Phys., 2008, 10, 4079–4092 RSC.
- P. Yzombard, M. Hamamda, S. Gerber, M. Doser and D. Comparat, Phys. Rev. Lett., 2015, 114, 213001 CrossRef PubMed.
- J. H. V. Nguyen, C. R. Viteri, E. G. Hohenstein, C. D. Sherrill, K. R. Brown and B. Odom, New J. Phys., 2011, 13, 063023 CrossRef.
- M. D. Di Rosa, Eur. Phys. J. D, 2004, 31, 395–402 CrossRef.
- E. S. Shuman, J. F. Barry and D. DeMille, Nature, 2010, 467, 820–823 CrossRef PubMed.
- Z. Song, D. Shi, J. Sun and Z. Zhu, Eur. Phys. J. D, 2017, 71, 55 CrossRef.
- X. Zhang, P. Yan, R. Li, Z. Gai, G. Liang, H. Xu and B. Yan, J. Quant. Spectrosc. Radiat. Transfer, 2016, 180, 154–166 CrossRef.
- Y. Yang, X. Zhang, W. He and Y. Liu, J. Quant. Spectrosc. Radiat. Transfer, 2019, 228, 17–26 CrossRef.
- K. A. Mourad, S. N. Abdulal and M. Korek, J. Mol. Model., 2016, 22, 45 CrossRef PubMed.
- X. Zhou, R. Guo, X. Zhang and Y. Liu, J. Quant. Spectrosc. Radiat. Transfer, 2020, 252, 107080 CrossRef.
- K. A. Mourad, S. N. Abdulal and M. Korek, Comput. Theor. Chem., 2017, 1103, 63–70 CrossRef.
- H. Xiao, S. Dong, J. Zhu and T. Gao, Comput. Theor. Chem., 2021, 1197, 113136 CrossRef.
- X. Zhou, Y. Yang, X. Zhang and Y. Liu, J. Quant. Spectrosc. Radiat. Transfer, 2020, 256, 107315 CrossRef.
- X. Zhou, X. Zhang and Y. Liu, J. Quant. Spectrosc. Radiat. Transfer, 2021, 260, 107473 CrossRef.
- N. Lu, W.-Q. Wu, C.-Z. Zhang, M.-J. Wan, Y.-Y. Jin, W.-B. Zhang, S.-J. Chen and S. Li, Spectrochim. Acta, Part A, 2020, 237, 118301 CrossRef PubMed.
- G.-S. Wang, C.-Y. Zhang, M.-J. Wan and C.-j. Zhou, J. Phys. Chem. A, 2022, 126, 4577–4584 CrossRef PubMed.
- G.-S. Wang, C.-Y. Zhang, M.-J. Wan and J.-Y. Gong, Spectrochim. Acta, Part A, 2022, 279, 121439 CrossRef.
- A. R. Belinassi, T. V. Alves and F. R. Ornellas, Chem. Phys. Lett., 2017, 671, 78–83 CrossRef.
- Y. Wang, X. Yuan, Y. Liu, H. Xu and B. Yan, J. Quant. Spectrosc. Radiat. Transfer, 2020, 251, 107049 CrossRef.
- H.-J. Werner, P. J. Knowles, G. Knizia, F. R. Manby and M. Schütz, Wiley Interdiscip. Rev.: Comput. Mol. Sci., 2012, 2, 242–253 Search PubMed.
- C. C. J. Roothaan, Rev. Mod. Phys., 1951, 23, 69–89 CrossRef.
- C. C. J. Roothaan, Rev. Mod. Phys., 1960, 32, 179–185 CrossRef.
- T. H. Dunning Jr, J. Chem. Phys., 1989, 90, 1007–1023 CrossRef.
- H. J. Werner and W. Meyer, J. Chem. Phys., 1980, 73, 2342–2356 CrossRef CAS.
- H. J. Werner and P. J. Knowles, J. Chem. Phys., 1988, 89, 5803–5814 CrossRef CAS.
- S. R. Langhoff and E. R. Davidson, Int. J. Quantum Chem., 1974, 8, 61–72 CrossRef.
- K. A. Peterson, D. Figgen, E. Goll, H. Stoll and M. Dolg, J. Chem. Phys., 2003, 119, 11113–11123 CrossRef.
- R. J. Le Roy, J. Quant. Spectrosc. Radiat. Transfer, 2017, 186, 167–178 CrossRef.
- X. Zhou, Y. Yang, X. Zhang and Y. Liu, J. Quant. Spectrosc. Radiat. Transfer, 2020, 256, 107315 CrossRef.
- Q.-L. Wang, H.-Y. Yu, W.-Q. Wu, C.-Z. Zhang, Y.-Y. Jin, S.-J. Chen and S. Li, J. Quant. Spectrosc. Radiat. Transfer, 2022, 283, 108133 CrossRef CAS.
- D. C. Martin, Phys. Rev., 1935, 48, 938–944 CrossRef CAS.
- J. L. Tech, J. Res. Natl. Bur. Stand., Sect. A, 1963, 67, 505 CrossRef.
|
| This journal is © The Royal Society of Chemistry 2022 |
Click here to see how this site uses Cookies. View our privacy policy here. 
 Open Access Article
 This Open Access Article is licensed under a Creative Commons Attribution-Non Commercial 3.0 Unported Licence
 *ab,
Guo-sen Wangc,
Xing-yong Huang
*ab,
Guo-sen Wangc,
Xing-yong Huang are calculated. In this paper, we argue that direct laser cooling of SeBr+ is not feasible. The content of our study provides a theoretical basis for subsequent calculations to explore the properties of SeBr+ spectrum.
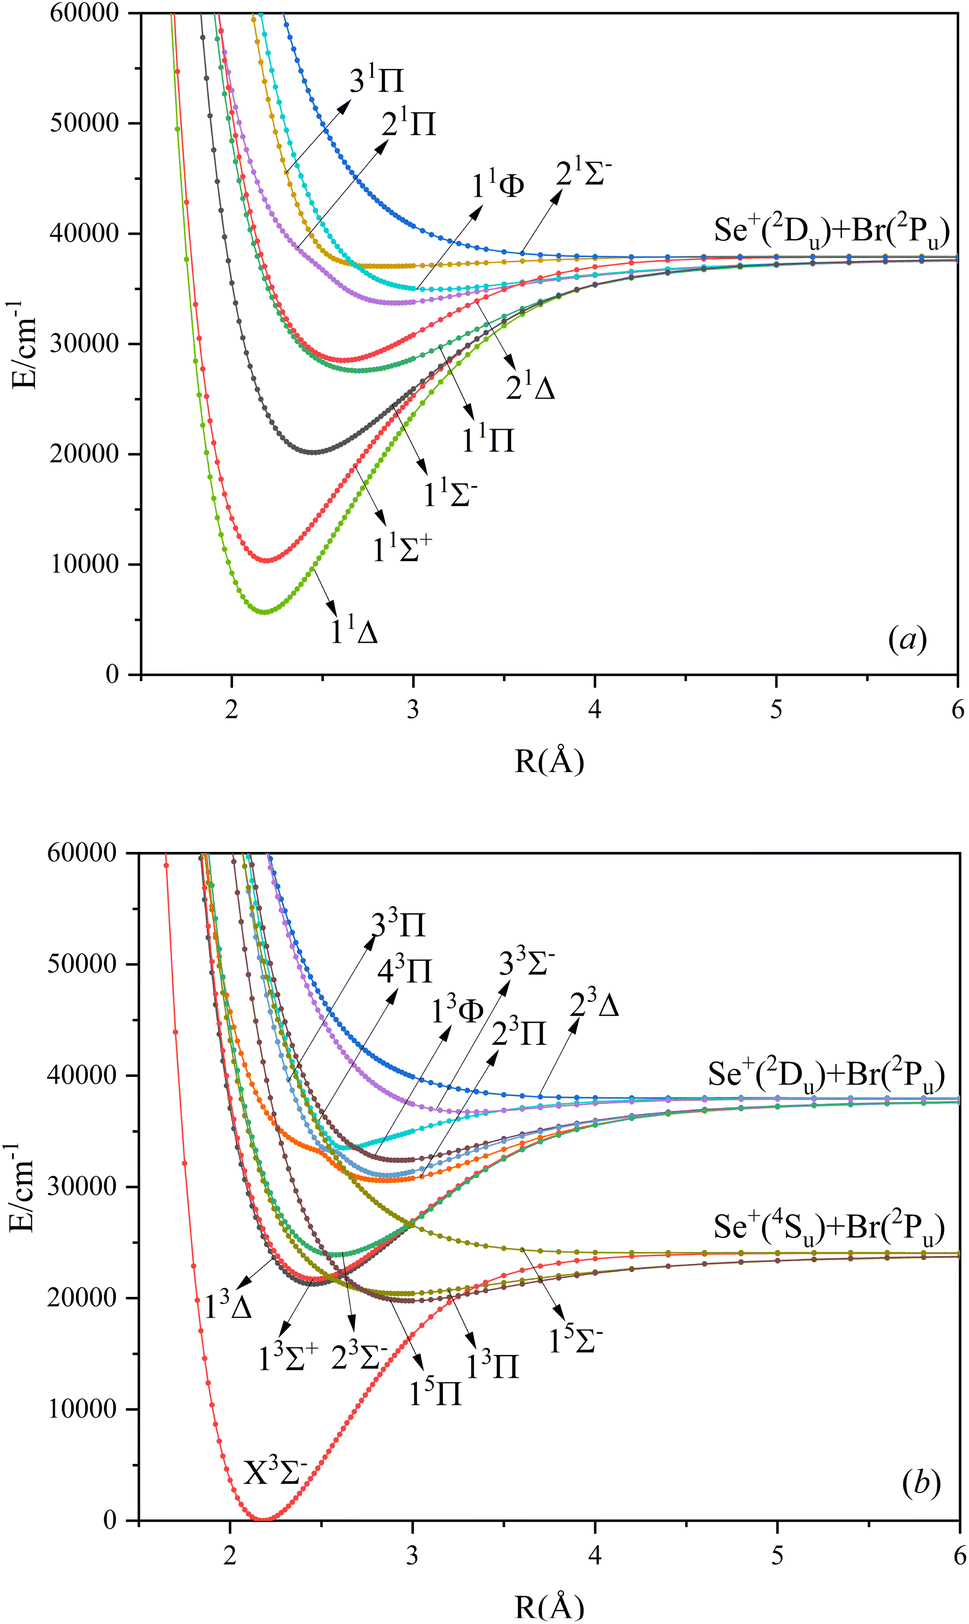
 is 418 cm−1, compared with 13 cm−1, 191 cm−1, and 965 cm−1 for SF+,37 SeCl+,23 and TeCl+24 of the same main group, respectively. It can be noticed that this value becomes larger and larger as the relative atomic mass increases. The vertical transition energy of 11Δ2(1)2 also changes somewhat, with a value of 5733 cm−1 in the Λ–S state and 6074 cm−1 in the Ω state. The change in this value indicates that the spin–orbit coupling effect has some influence on SeBr+. The spectroscopic data of the ground state (X3Σ−) did not change significantly after considering the spin–orbit coupling effect. For 11Δ, the vertical transition energy increases and the rest of the spectrum data do not change significantly. The changes before and after the 11Σ+ splitting are mainly reflected in the increase of vertical transition energy and first anharmonic correction, while the equilibrium nuclear bond length and the rest of the spectral data do not change much. In this paper, the SO matrix elements between the SeBr+ electronic states are calculated and the strength of the spin–orbit coupling interaction is determined by their magnitudes, and the possible 29 SO matrix elements between the calculated electronic states are listed in Table SI3.† SO1 and SO2 denote the SO matrix elements between the two components of 11Π and 13Σ+ so they are equal in size. Similarly, SO3 = SO4, SO5 = SO6, SO7 = SO8, SO9 = SO10, SO11 = SO12, SO13 = SO14, SO15 = SO16, SO17 = SO18, SO19 = SO20, SO21 = SO22, SO23 = SO24, SO25 = SO26, SO27 = SO28. The variation of the obtained SO matrix elements with the nuclear bond length is shown in Fig. 5. As a whole, the values of SO1, SO3, SO19, SO21 and SO25 are relatively small, while the rest of the values other than these are relatively large, with the maximum even reaching 1200 cm−1, which is sufficient to show that the rest of the states in the spin–orbit coupling effect are more affected. To ensure the accuracy of the calculation results, the possibility of laser cooling of SeBr+ under the effect of spin–orbit coupling will be discussed in this paper.
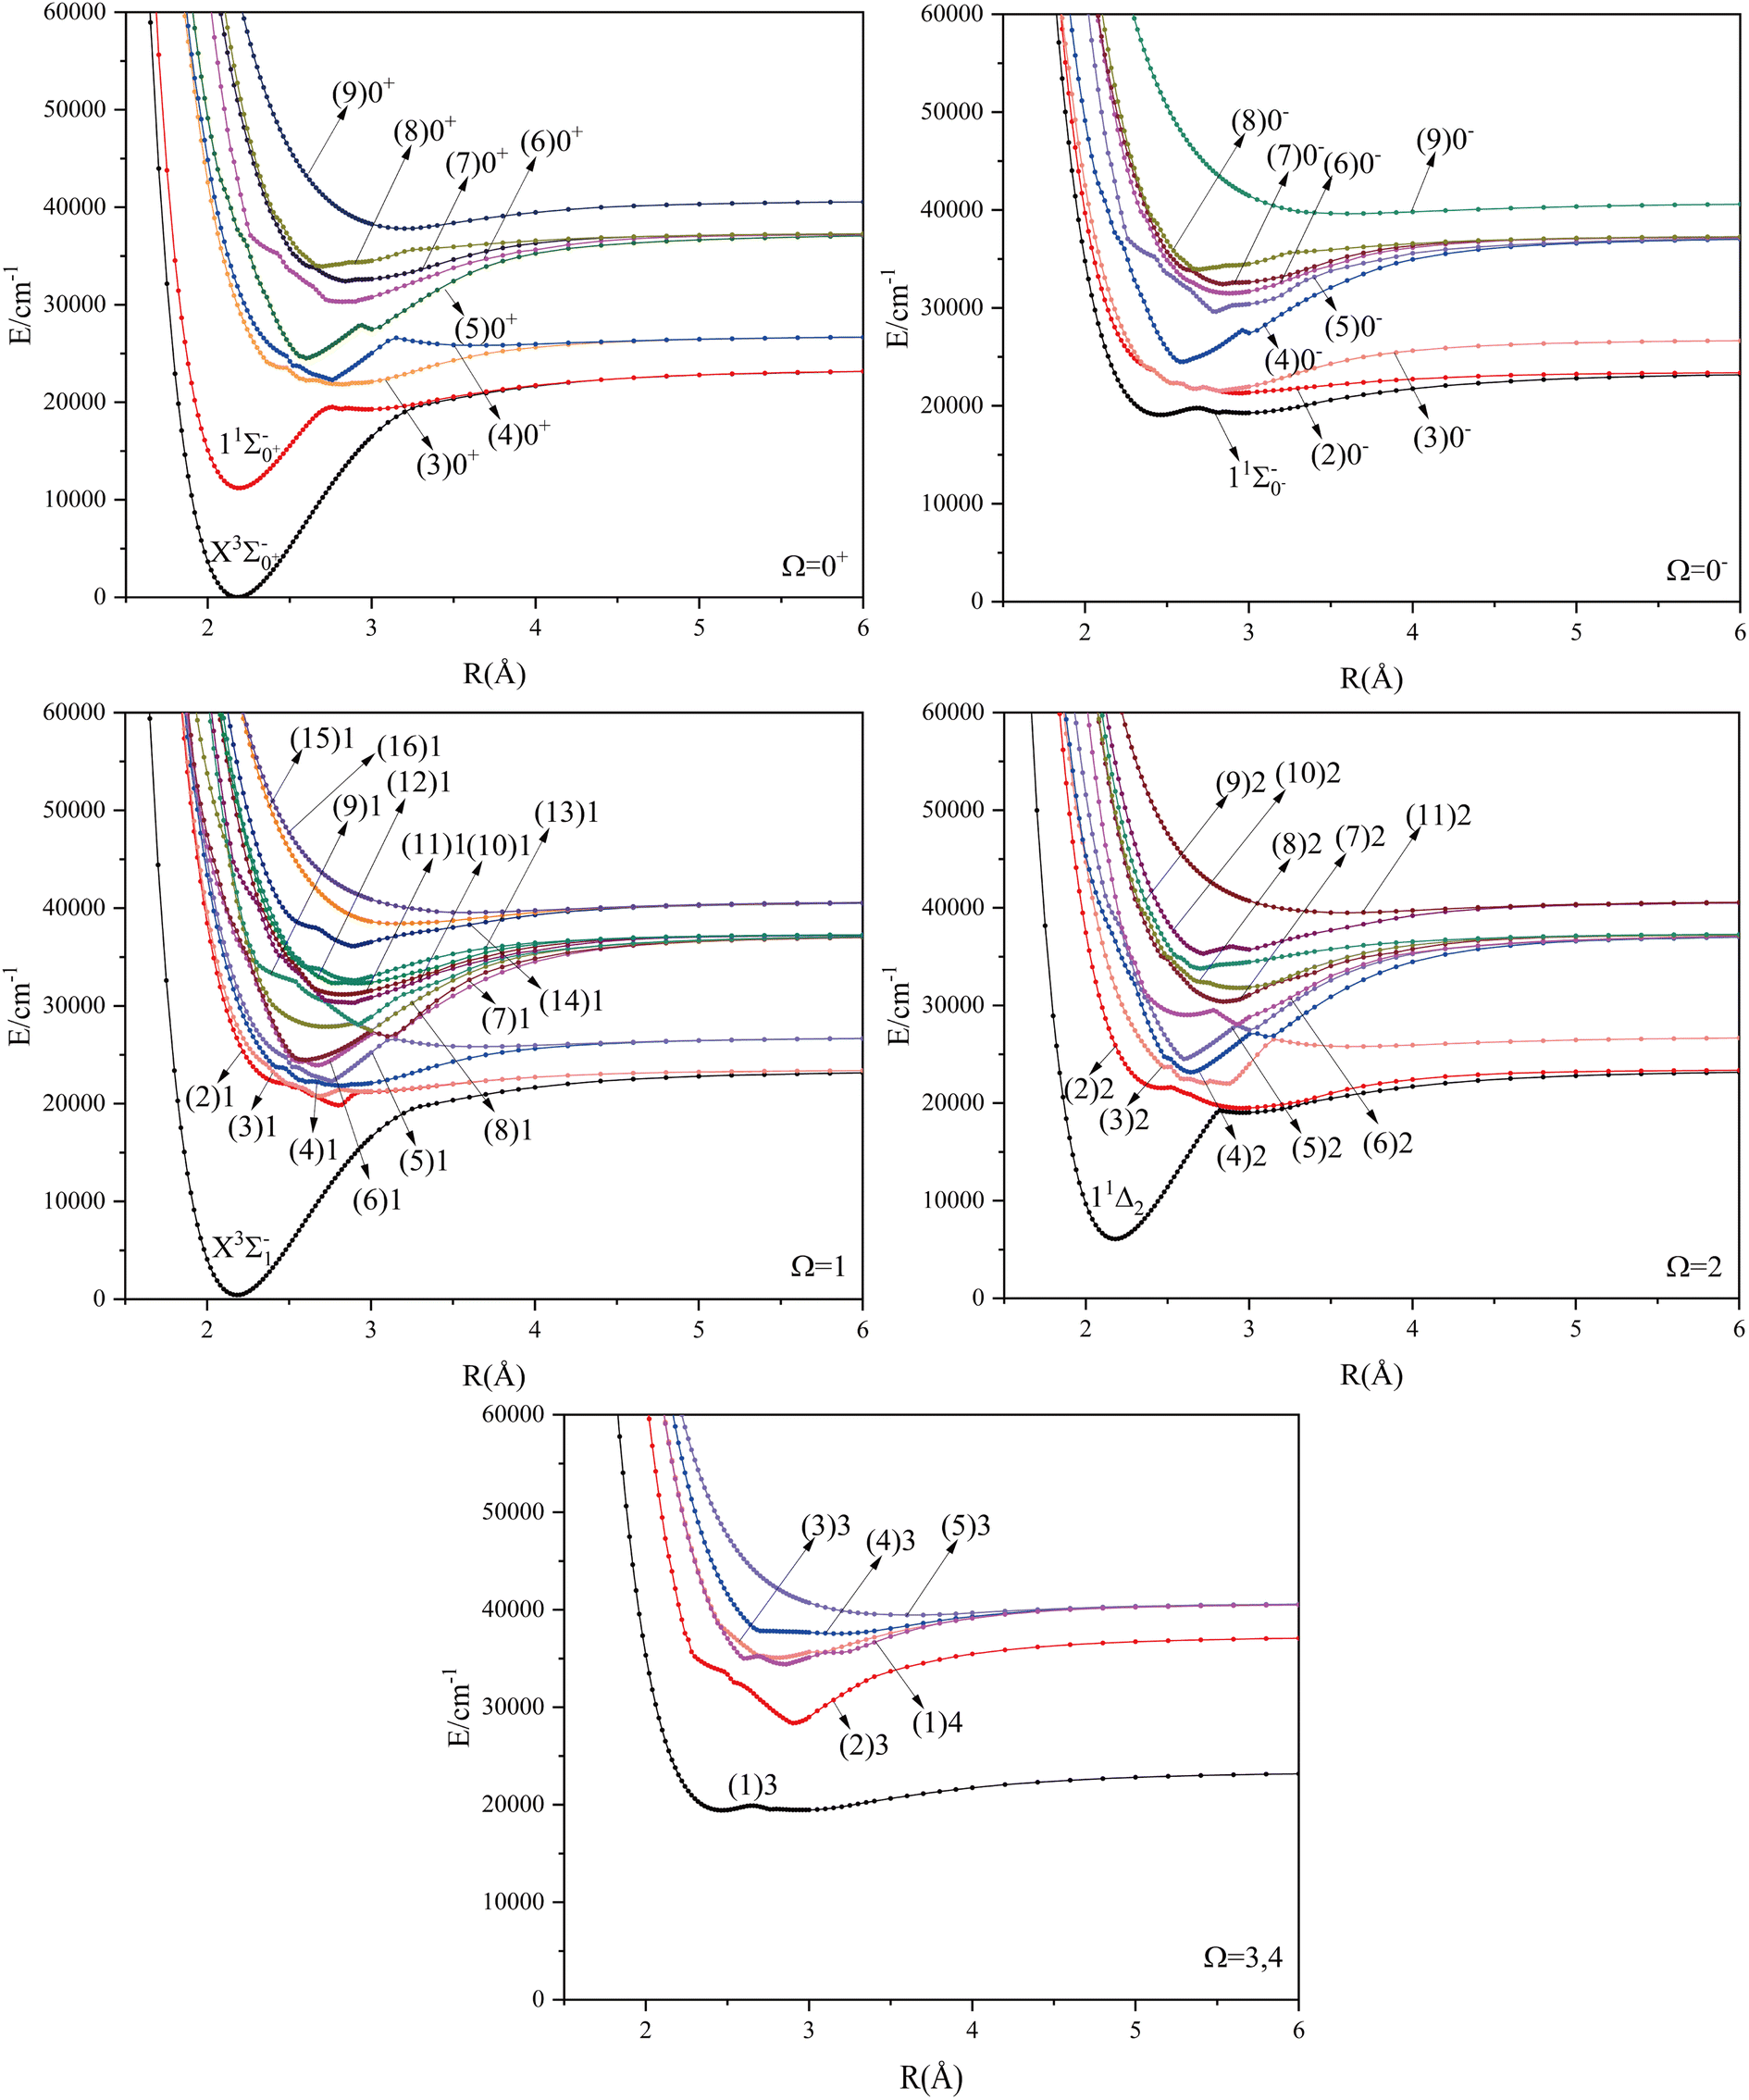

 0.0007 Å, which means that the Franck–Condon factor between the two electronic states is large, but the vertical transition energy is only 418 cm−1, which means that the strength of the transition between the two electronic states is weak and therefore is not a suitable choice. The difference of the equilibrium bond length between 11Δ2(1)2 and the ground state
 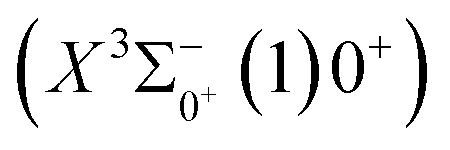 is 0.0021 Å and the vertical transition energy is 6074 cm−1. However, there is a forbidden barrier transition between the two states, so it does not constitute a circulating cooling system. For
 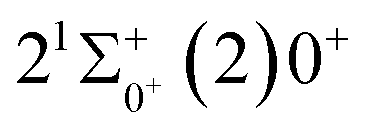 , the difference in equilibrium bond length from the ground state is 0.0103 Å and the vertical transition energy is 11
 , the radiation lifetime, and the Einstein coefficient are calculated. The calculated results are shown in Table 7, where we find that there is a large Franck–Condon factor between these two states, but the radiation lifetime is too long to constitute a recirculating cooling system. Therefore, we tentatively conclude that SeBr+ is not a suitable system for laser cooling.
 transition

 in the Ω state and obtains the Franck–Condon factor, radiation lifetime and Einstein coefficient between the two states. According to the results of the current calculations, SeBr+ is not a suitable system for laser cooling. The calculated results will be useful for further study of laser cooling SeBr+ ions.