 Open Access Article
A water-soluble fluorescent probe for monitoring mitochondrial GSH fluctuations during oxidative stress†
Huayu Wang‡
 a,
Luan Zhang‡b,
Xia Jinb,
Peijiao Tianb,
Xiaojun Dingb and
Jing Chang*b
aSchool of Basic Medical Sciences, Xinxiang Medical University, Xinxiang 453003, China
bJiangsu Mai Jian Biotechnology Development Company, Wuxi 214135, China. E-mail: chang_jing09@aliyun.com
First published on 28th November 2022
Abstract
In this research, we constructed a styrylpyridine derivative-based fluorescent probe MITO-PQDNs to monitor mitochondrial glutathione (GSH). The probe MITO-PQDNs could react rapidly (20 min) with GSH in PBS buffer and exhibited a strong fluorescence signal (586 nm) as well as a significant Stokes shift (200 nm). Moreover, MITO-PQDNs could quantitatively detect GSH with high sensitivity (LOD = 253 nM). Meanwhile, MITO-PQDNs possessed favorable biocompatibility and could detect both endogenous and exogenous GSH in MCF-7 cells. Above all, MITO-PQDNs enabled the detection of fluctuations in mitochondrial GSH concentrations during oxidative stress.
1. Introduction
As a critical organelle involved in aerobic respiration, mitochondria can consume oxygen and carbohydrates, thus releasing adenosine triphosphate (ATP), which provides the most energy for cellular activity.1 Meanwhile, mitochondria play an essential role in signaling, cell differentiation, cell apoptosis, maintenance of calcium homeostasis, etc.2–4 Mitochondria are the major site of production of reactive oxygen species (ROS), and excess ROS induces cells to be in a state of oxidative stress, ultimately leading to a range of diseases such as neurodegenerative diseases and cancer.5,6 Mitochondrial glutathione (GSH, the most abundant biothiol in cells) can scavenge excess mitochondrial ROS generated during aerobic metabolism and thus control the damage caused by oxidative stress.7,8 In addition, mitochondrial GSH also plays a major role in biological processes, for example regulating cell death.9,10 Hence, it is of practical importance to achieve the visual monitoring of mitochondrial GSH.Owing to the advantages of non-invasiveness, high sensitivity, favorable biocompatibility, and high spatiotemporal resolution, organic small molecule fluorescent probes have become a powerful tool for monitoring GSH in vitro and vivo.11–13 Many researchers have focused on developing the GSH-specific fluorescent probes capable of targeting mitochondria, and some achievements have been made.14–17 In 2018, Liu et al. developed a hemicyanine-based ratiometric fluorescent probe 1 that specifically recognized mitochondrial GSH through nucleophilic aromatic substitution reaction (SNAr) and aldimine condensation reaction.18 In 2021, Zhu et al. constructed a mitochondrial-targeted fluorescent probe QZ based on rhodamine B derivative, and the presence of aromatic thioester bond of QZ ensured its high selectivity for GSH.19 In 2022, Zhou et al. designed a near-infrared (NIR) fluorescent probe JGP based on the intramolecular charge transfer (ICT) mechanism to monitor mitochondrial GSH.20 The probe JGP was composed of a cyanine fluorophore, an indole ammonium cation targeting group and a 2,4-dinitrobenzenesulfonyl recognition site, and triumphantly achieved the bioimaging of GSH in Caenorhabditis elegans and rat brain slices. However, these fluorescent probes, which possessed poor water-solubility, could usually only detect analytes in solutions containing organic cosolvents. Consequently, fluorescent probes must be further developed to detect mitochondrial GSH in a pure water system specifically.
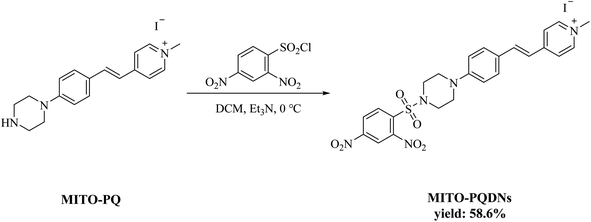
In this work, we constructed a styrylpyridinium-based fluorescent probe MITO-PQDNs with superb water solubility (Scheme 1). By introducing a rigid piperazine ring into the para-position of the benzene ring, the strong intramolecular electron push–pull effect of the fluorophore MITO-PQ was achieved, resulting in a strong ICT effect and long emission wavelength.21 The 2,4-dinitrophenylsulfonyl (DNs) group with strong electron-absorbing ability could significantly quench the fluorescence of the fluorophore MITO-PQ and react with the sulfhydryl group of GSH, so the DNs group was selected as the recognition moiety for MITO-PQDNs.20,22 Furthermore, the pyridine salt moiety with a positive charge could bind tightly to the inner mitochondrial membrane with a negative potential of −180 mV, which allowed the probe MITO-PQDNs to be selectively enriched in mitochondria.23–28 However, most of the available pyridinium probes had small Stokes shifts, resulting in strong self-absorption which would be detrimental to fluorescence imaging applications. In comparison, MITO-PQDNs could react rapidly with GSH in PBS buffer, thus showing intense yellow fluorescence (586 nm) as well as significant Stokes shift (200 nm). MITO-PQDNs exhibited excellent mitochondrial targeting ability and successfully monitored the dynamic changes in mitochondrial GSH levels during oxidative stress. Hence, MITO-PQDNs was expected to be a powerful chemical tool for monitoring mitochondrial GSH.
2. Materials and methods
2.1. Synthesis and characterization of the probe MITO-PQDNs
The fluorophore MITO-PQ was used as the initial material and was prepared according to the reported literature.21 The synthesis method of the probe MITO-PQDNs was depicted in Scheme 2.MITO-PQ (336.5 mg, 1.2 mmol) and triethylamine (700.0 μL, 5 mmol) were added sequentially into 25 mL of anhydrous dichloromethane (DCM) at 0 °C. After the solid was fully dissolved, 2,4-dinitrobenzenesulfonyl chloride (399.9 mg, 1.5 mmol) dissolved in 10 mL of DCM was slowly added to the mixture under stirring. The reaction was stopped when the mixture was stirred at 0 °C for 9 h. After removal of the solvent under reduced pressure, the probe MITO-PQDNs was purified by silica gel column chromatography (yield: 58.6%). 1H NMR (400 MHz, DMSO-d6) δ 9.01 (s, 1H), 8.75 (d, J = 6.8 Hz, 2H), 8.59(dd, J = 8.8, 2.4 Hz, 1H), 8.32 (d, J = 8.8 Hz, 1H), 8.05–8.11 (m, 2H), 7.89 (d, J = 16.4 Hz, 1H), 7.61 (d, J = 8.8 Hz, 2H), 7.27 (d, J = 8.8 Hz, 1H), 7.04 (d, J = 8.8 Hz, 2H), 4.21 (s, 3H), 3.40–3.46 (m, 4H), 3.35–3.39 (m, 4H). 13C NMR (101 MHz, DMSO-d6) δ 153.52, 151.91, 150.72, 148.30, 147.89, 145.18, 145.11, 141.44, 134.58, 132.80, 131.24, 130.28, 127.46, 126.13, 126.01, 123.10, 120.53, 119.71, 118.80, 115.56, 47.26, 47.05, 45.77. HRMS (ESI): calcd for C24H24N5O6S+ (M+) 510.1442, found 510.1443.
2.2. Fluorescence colocalization experiments
MCF-7 cells were co-cultured with Mito-Tracker Green (200 nM) and MITO-PQDNs (10 μM) for 60 min, and then subjected to fluorescence imaging. Finally, the co-localization analysis of the imaging results was performed using ImageJ.3. Results and discussion
3.1. Spectroscopic properties of MITO-PQDNs towards GSH
First, we comprehensively tested the UV-Vis absorption spectra and fluorescence spectra of the probe MITO-PQDNs (10 μM) before and after the reaction with GSH (1 mM) in phosphate-buffered saline (PBS, pH 7.4, 10 mM). It can be seen from Fig. 1 that the maximum absorption peak of MITO-PQDNs was located at 400 nm, and the emission spectra of MITO-PQDNs exhibited a weak fluorescence signal at 586 nm. After adding GSH, the maximum absorption peak was blue-shifted from 400 nm to 386 nm, indicating that MITO-PQDNs reacted with GSH to form a new substance. During this process, a marked increase in fluorescence intensity (586 nm) and a significant Stokes shift (200 nm) were exhibited. The above spectral data showed that MITO-PQDNs could react with GSH, thus achieving a fluorescence “off–on” switch. Meanwhile, the fluorescence intensity at 586 nm reached the maximum when MITO-PQDNs reacted with GSH for 20 min (Fig. 2a). When the reaction time was further extended to 60 min, there was no significant change in the fluorescence intensity at 586 nm, while MITO-PQDNs itself did not emit a strong fluorescence signal from the beginning to the end. The above results demonstrated that MITO-PQDNs owned excellent photostability and a fast response rate for GSH in PBS buffer solution.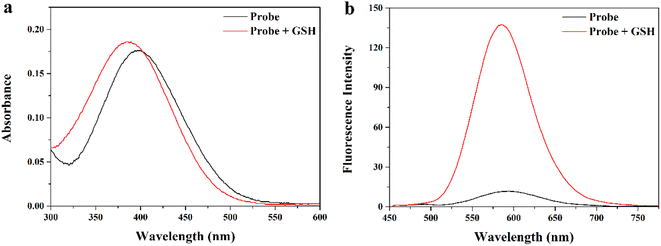 | ||
| Fig. 1 (a) Absorption and (b) fluorescence responses of MITO-PQDNs (10 μM) to GSH (1 mM) in PBS (10 mM, pH 7.4). | ||
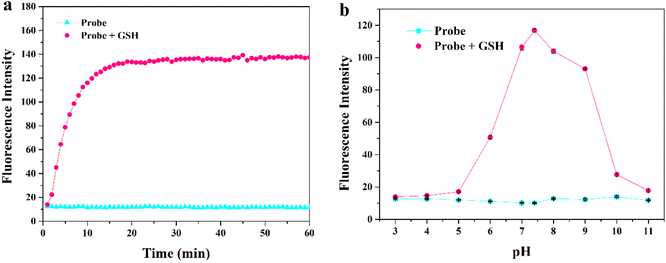 | ||
| Fig. 2 (a) Time-dependent emission intensity of MITO-PQDNs (10 μM) towards GSH (1 mM) at 586 nm. (b) Fluorescence response of MITO-PQDNs (10 μM) at different pH values (3–11). | ||
Subsequently, we studied the fluorescence response of MITO-PQDNs to GSH at different pH values. The fluorescence intensity of MITO-PQDNs itself did not change with pH, indicating that MITO-PQDNs was stable in the pH range of 3–11 (Fig. 2b). After the addition of GSH, a strong fluorescent signal was seen in the pH range of 6–9. These results suggested that MITO-PQDNs could detect GSH at physiological and have the potential for bioimaging applications.
3.2. Selectivity and sensitivity
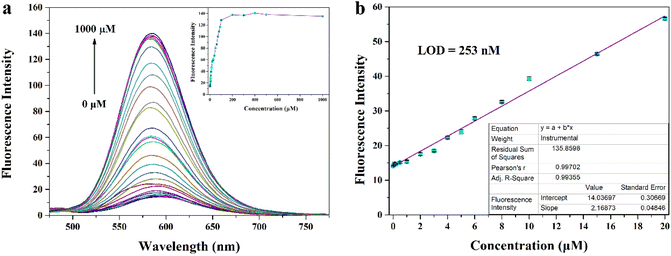
Considering the possible presence of various interferences in the complex biological microenvironment, we think that the selectivity and anti-interference ability of MITO-PQDNs towards GSH need to be investigated. We recorded changes in the emission spectra when MITO-PQDNs was incubated with 28 kinds of analytes for 20 min. The presence of GSH could trigger a marked increase in fluorescence intensity (586 nm), while the addition of other amino acids (Ala, Glu, Gln, Arg, Val, Asp, Gly, Leu, Ile, His, Tyr, Met, Lys, Phe, Pro, Ser, Thr, Asn, Trp) and ionic compounds (CaCl2, MgSO4, NaF, NaCl, NaBr, KI, NaHS) had almost no effect on the fluorescence spectra (Fig. S4†). However, a slight fluorescence enhancement was displayed after Cys/Hcy were added, which may be due to the nucleophilic properties of Cys and Hcy promoting the breakage of the sulfonamide bond of MITO-PQDNs. It was worth mentioning that the concentration of GSH in living cells was approximately 1–10 mM, which was well above that of Cys (30–200 μM) and Hcy (5–15 μM).29–31 Hence, Cys/Hcy had a negligible effect on detecting GSH in biological systems. After confirming the selectivity of MITO-PQDNs for GSH, the competition experiment was performed (Fig. S4†). The addition of GSH still caused a significant increase in fluorescence intensity at 586 nm when other analytes were present, indicating that MITO-PQDNs had a strong anti-interference capacity for the detection of GSH.To investigate the ability of MITO-PQDNs to quantify GSH, we added different concentrations of GSH to the PBS buffer containing MITO-PQDNs (10 μM), and the changes in the fluorescence spectra were recorded. The emission intensity at 586 nm gradually enhanced as the GSH concentration increased and basically achieved the maximum value when the GSH concentration was 200 μM (Fig. 3a). From Fig. 3b, the emission intensity (586 nm) was linearly proportional to the GSH concentration in the range of 0–20 μM (R = 0.99355), which demonstrated that MITO-PQDNs had the potential ability to detect GSH quantitatively. Compared with other reported probes for GSH detection,32–36 MITO-PQDNs had higher sensitivity for GSH with a detection limit as low as 253 nM.
3.3. Response mechanism of MITO-PQDNs towards GSH
According to the published literature, the possible reaction mechanism between MITO-PQDNs and GSH was presented in Scheme 1.20,22,37–39 The strong electron-absorbing DNs group significantly quenched the fluorescence of MITO-PQDNs. However, the strongly nucleophilic GSH could undergo a nucleophilic aromatic substitution reaction (SNAr) with MITO-PQDNs leading to the cleavage of the sulfonate esters, thus releasing the fluorophore MITO-PQ. To better understand the response mechanism, we analyzed the mixture of MITO-PQDNs and GSH by HRMS, which verified the formation of MITO-PQ (Fig. S5†).3.4. Cell imaging
Encouraged by the superior properties of MITO-PQDNs in PBS buffer, the cellular experiments were carried out in MCF-7 cells to assess its potential biological applications. The cytotoxicity assay was first carried out because biocompatibility was a vital criterion to examine whether the probe could be applied to cellular imaging. The results showed that the cell viability remained approximately 100% upon coincubation with 25 μM probe MITO-PQDNs for 12 h (Fig. S6†), which indicated that MITO-PQDNs had low cytotoxicity for MCF-7 cells. Subsequently, the capability of MITO-PQDNs to detect intracellular GSH was studied in MCF-7 cells. As depicted in Fig. 4, an intense orange fluorescent signal was seen in the MCF-7 cells after 60 min incubation with 10 μM MITO-PQDNs. The intracellular fluorescence signal was markedly degraded after pretreatment with 500 μM N-ethylmaleimide (NEM, a thiol blocking reagent) for 30 min. However, the bright orange fluorescence was again observed when NEM-pretreated MCF-7 cells were treated with 1 mM GSH for 30 min. The above experimental phenomena demonstrated that the probe MITO-PQDNs possessed excellent cell membrane permeability and could detect both endogenous and exogenous GSH in living cells.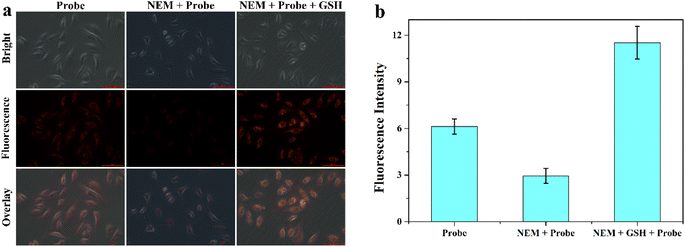 | ||
| Fig. 4 (a) Fluorescence imaging of GSH in MCF-7 cells using MITO-PQDNs (10 μM). (b) The relative fluorescence intensity of MCF-7 cells in different groups. Scale bar: 100 μm. | ||
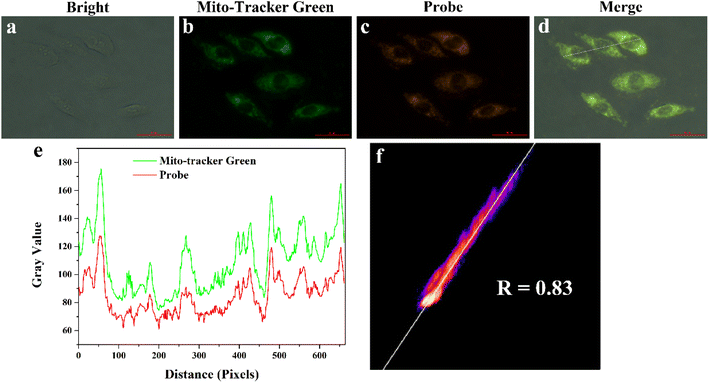
To assess the ability of MITO-PQDNs to target mitochondria, we performed that MCF-7 cells were co-stained with 200 nM Mito-Tracker Green (a commercial mitochondrial green dye) and 10 μM MITO-PQDNs for 60 min. As displayed in Fig. 5, the orange fluorescence emitted from the reaction product of MITO-PQDNs and GSH reactant was highly overlapped with the green fluorescence emitted from Mito-Tracker Green, where the Pearson's correlation coefficient was 0.83. The results of the co-localization experiments fully confirmed that the probe could be specifically enriched in mitochondria and enable the visualization of mitochondrial GSH.
After determining the mitochondrial targeting ability of MITO-PQDNs, the feasibility of MITO-PQDNs in achieving the visual detection of the dynamic changes in mitochondrial GSH concentrations during oxidative stress was investigated. As indicated in Fig. 6, the emission intensity of the MCF-7 cells pretreated with 100 μM phorbol myristate acetate (PMA) was significantly stronger than that of control cells. Nevertheless, the intracellular fluorescence intensity gradually diminished upon increasing the concentration of PMA to 200 and 400 μM. This might be to prevent oxidative damage caused by PMA-induced production of ROS, leading to high expression of GSH. Moreover, the intracellular GSH level would decrease when the excessive production of ROS exceeded the antioxidant capacity of GSH. These results provided strong evidence that the probe MITO-PQDNs could be applied to the visual monitoring of mitochondrial GSH during oxidative stress.
4. Conclusions
All in all, we developed a styrylpyridine derivative-based fluorescent probe MITO-PQDNs for monitoring GSH in mitochondria. The probe MITO-PQDNs with the DNs recognition group could detect GSH through SNAr in PBS solution and emit a strong fluorescence signal (586 nm) after reaction with GSH. Moreover, MITO-PQDNs also had the advantages of significant Stokes shift, superb water solubility, high sensitivity, and low cytotoxicity. Besides, the imaging results strongly demonstrated that MITO-PQDNs was able to selectively enrich in mitochondria and visualize mitochondrial GSH fluctuations during oxidative stress. Therefore, the probe MITO-PQDNs was a promising chemical sensor for detecting mitochondrial GSH, and its development contributed to studying the antioxidant mechanism of mitochondrial GSH.Conflicts of interest
There are no conflicts to declare.References
- S.-Y. Lim, K.-H. Hong, D. I. Kim, H. Kwon and H.-J. Kim, J. Am. Chem. Soc., 2014, 136, 7018–7025 CrossRef CAS PubMed.
- D. R. Green, Cell, 1998, 94, 695–698 CrossRef CAS PubMed.
- M. Y. Berezin and S. Achilefu, Chem. Rev., 2010, 110, 2641–2684 CrossRef CAS PubMed.
- T. Finkel, M. Serrano and M. A. Blasco, Nature, 2007, 448, 767–774 CrossRef CAS PubMed.
- V. Sorrentino, K. J. Menzies and J. Auwerx, Annu. Rev. Pharmacol. Toxicol., 2018, 58, 353–389 CrossRef.
- Y.-y. Wang, S.-m. Chen and H. Li, Acta Pharmacol. Sin., 2010, 31, 160–164 CrossRef PubMed.
- L. Wu, A. C. Sedgwick, X. Sun, S. D. Bull, X.-P. He and T. D. James, Acc. Chem. Res., 2019, 52, 2582–2597 CrossRef PubMed.
- R. A. J. Smith, R. C. Hartley and M. P. Murphy, Antioxid. Redox Signaling, 2011, 15, 3021–3038 CrossRef PubMed.
- J. C. Fernandez-Checa and N. Kaplowitz, Toxicol. Appl. Pharmacol., 2005, 204, 263–273 CrossRef CAS PubMed.
- K. Xu and P. J. Thornalley, Biochem. Pharmacol., 2001, 61, 165–177 CrossRef CAS PubMed.
- Y. Yue, F. Huo, F. Cheng, X. Zhu, T. Mafireyi, R. M. Strongin and C. Yin, Chem. Soc. Rev., 2019, 48, 4155–4177 RSC.
- M. Vendrell, D. Zhai, J. C. Er and Y.-T. Chang, Chem. Rev., 2012, 112, 4391–4420 CrossRef CAS PubMed.
- Y. Yang, Q. Zhao, W. Feng and F. Li, Chem. Rev., 2013, 113, 192–270 CrossRef CAS.
- X.-L. Liu, L.-Y. Niu, Y.-Z. Chen, M.-L. Zheng, Y. Yang and Q.-Z. Yang, Org. Biomol. Chem., 2017, 15, 1072–1075 RSC.
- W. Shu, J. Yu, H. Wang, A. Yu, L. Xiao, Z. Li, H. Zhang, Y. Zhang and Y. Wu, Anal. Chim. Acta, 2022, 1220, 340081 CrossRef PubMed.
- Z. Xu, X. Huang, X. Han, D. Wu, B. Zhang, Y. Tan, M. Cao, S. H. Liu, J. Yin and J. Yoon, Chem, 2018, 4, 1609–1628 Search PubMed.
- Y.-L. Zheng, Z.-H. Chai, W. Tang, S. Yan, F. Dai and B. Zhou, Sens. Actuators, B, 2021, 330, 129343 CrossRef.
- S. Qi, W. Liu, P. Zhang, J. Wu, H. Zhang, H. Ren, J. Ge and P. Wang, Sens. Actuators, B, 2018, 270, 459–465 CrossRef.
- T. Jin, M. Cui, D. Wu, W. Zhu, Y. Xu and X. Qian, Chin. Chem. Lett., 2021, 32, 3899–3902 CrossRef.
- M. Jia, L. Wei, Y. Lu, R. Zhang, Q. Chen, W. Xia, Y. Liu, F. Li and Y. Zhou, RSC Adv., 2022, 12, 2668–2674 RSC.
- B. Ma, D.-H. Tian, S. Yan, X.-C. Li, F. Dai and B. Zhou, Sens. Actuators, B, 2021, 327, 128937 CrossRef.
- J. Chen, Z. Wang, M. She, M. Liu, Z. Zhao, X. Chen, P. Liu, S. Zhang and J. Li, ACS Appl. Mater. Interfaces, 2019, 11, 32605–32612 CrossRef.
- X. Zhong, Q. Yang, Y. Chen, Y. Jiang, B. Wang and J. Shen, J. Mater. Chem. B, 2019, 7, 7332–7337 RSC.
- C. Wang, Y. Wang, G. Wang, C. Huang and N. Jia, Anal. Chim. Acta, 2020, 1097, 230–237 CrossRef.
- X.-B. Wang, H.-J. Li, C. Liu, W.-Y. Lu, X. Lu and Y.-C. Wu, Dyes Pigm., 2022, 199, 110058 CrossRef.
- X. Lu, Z. Chen, X. Dong and W. Zhao, ACS Sens., 2018, 3, 59–64 CrossRef PubMed.
- J. Xu, C. Wang, Q. Ma, H. Zhang, M. Tian, J. Sun, B. Wang and Y. Chen, ACS Omega, 2021, 6, 14399–14409 CrossRef CAS PubMed.
- L. Fan, Q. Zan, X. Wang, X. Yu, S. Wang, Y. Zhang, Q. Yang, W. Lu, S. Shuang and C. Dong, Chem. Eng. J., 2022, 449, 137762 CrossRef.
- H. Zhang and Z. Fang, RSC Adv., 2018, 8, 11419–11423 RSC.
- H. Ren, F. Huo and C. Yin, New J. Chem., 2021, 45, 9096–9101 RSC.
- Y. Z. Yang, Z. Y. Xu, L. Han, Y. Z. Fan, M. Qing, N. B. Li and H. Q. Luo, Dyes Pigm., 2021, 184, 108722 CrossRef.
- P. Su, Z. Zhu, Y. Tian, L. Liang, W. Wu, J. Cao, B. Cheng, W. Liu and Y. Tang, Talanta, 2020, 218, 121127 CrossRef CAS PubMed.
- Y. Mao, Y. Xu, Z. Li, Y. Wang, H. Du, L. Liu, R. Ding and G. Liu, Sensors, 2019, 19, 5348 CrossRef.
- H. Zhou, J. Tang, L. Lv, N. Sun, J. Zhang, B. Chen, J. Mao, W. Zhang, J. Zhang and J. Zhou, Analyst, 2018, 143, 2390–2396 RSC.
- Y. Wan, Y. Li, Z. Liao, Z. Tang, Y. Li, Y. Zhao and B. Xiong, Spectrochim. Acta, Part A, 2019, 223, 117265 CrossRef CAS PubMed.
- Y.-L. Fu, X.-G. Chen, H. Li, W. Feng and Q.-H. Song, New J. Chem., 2020, 44, 13781–13787 RSC.
- L. Fan, W. Zhang, X. Wang, W. Dong, Y. Tong, C. Dong and S. Shuang, Analyst, 2019, 144, 439–447 RSC.
- R. Li, X. Huang, G. Lu and C. Feng, RSC Adv., 2018, 8, 24346–24354 RSC.
- J. Wang, H. Wang, Y. Hao, S. Yang, H. Tian, B. Sun and Y. Liu, Food Chem., 2018, 262, 67–71 CrossRef PubMed.
Footnotes |
| † Electronic supplementary information (ESI) available. See DOI: https://doi.org/10.1039/d2ra04732b |
| ‡ Huayu Wang and Luan Zhang contributed equally to this work. |
| This journal is © The Royal Society of Chemistry 2022 |


