 Open Access Article
Creative Commons Attribution 3.0 Unported Licence
Structural, electronic, optical and photocatalytic properties of KTaO3 with NiO cocatalyst modification
Bin Wu a,
Jinzhen Cai*a and
Xin Zhou
 *b
*b
aOrgan Transplant Center, Fujian Medical University Union Hospital, Fuzhou 350000, China. E-mail: caijinzhen@sina.com
bCollege of Environment and Chemical Engineering, Dalian University, Liaoning 116622, China. E-mail: zhouxin@dlu.edu.cn
First published on 10th November 2022
Abstract
KTaO3 loaded with NiO cocatalyst is an efficient photocatalyst that has been widely applied to various photocatalytic reactions. In this work, density functional theory calculations have been utilized to investigate the interfacial geometries, electronic structures, charge transfer, optical absorption, and water oxidation mechanism of the NiO(001)/KTaO3(001) slab model. The formation of O–Ni and Ta–O interfacial bonds is thermodynamically stable, indicating a covalent interaction between the two components of the heterostructure. The calculated density of states using the PBE+U and HSE06 methods shows that in the NiO/KTaO3 heterostructure, the valence band maximum and conduction band minimum of NiO are located above those of KTaO3, indicating the formation of type-II band alignment. Upon light irradiation, the photogenerated electrons accumulate at the KTaO3 side and photogenerated holes gather at the NiO side. The difference in electrostatic potentials around the interface as a driving force boosts the migration of electrons and holes to different domains of the interface, which is beneficial to extending the lifetime of photoinduced carriers and improving the photocatalytic activity of the KTaO3 system. The formation of an interface between NiO and KTaO3 evidently reduces the overpotential of the oxygen evolution reaction because the adsorption of intermediates in the water oxidation process becomes more moderate. Our results provide new insights into understanding the influence of loading NiO cocatalyst on the photocatalytic performance of KTaO3, which provides a theoretical guidance for designing new semiconductor-based photocatalysts.
1. Introduction
Perovskite-type oxides are a category of semiconductors having the common formula ABO3, in which an A cation with a larger ionic radius is twelve-coordinated to oxygen atoms and a B cation with a smaller ionic radius is six-coordinated to oxygen atoms.1 Since the A and B sites can be occupied by most of the metal elements in the periodic table, the rational combination of different metal ions extends the family of perovskite oxides.2Due to their simple, flexible and stable structures, perovskite oxides have been applied to a variety of fields, such as photovoltaics,3 photocatalysis,4–6 optoelectronics and ferroelectrics.7,8 In varied experimental conditions, ABO3 usually undergoes lattice distortion to varying degrees, leading to the transformation of crystal phases into low symmetry structures.9–12 As a representative perovskite oxide, KTaO3 has a nearly ideal cubic structure at room temperature,13,14 which has currently attracted considerable attention as a highly efficient photocatalyst in hydrogen evolution,15–18 pollutant degradation,19–22 and CO2 reduction.23,24
Semiconductor-based photocatalysis has recently become one of important strategies for solving global energy and environmental issues.25–27 A particulate photocatalytic system generally consists of semiconductors and cocatalysts. Semiconductors are responsible for absorbing solar light to generate the photoinduced electrons and holes. Cocatalysts loaded on the surface of semiconductors are considered to be active sites of photocatalytic reactions to benefit the separation of carrier charges. The type, size and structure of cocatalysts are important factors in controlling the reaction activity of a photocatalytic system.28–31 In terms of KTaO3 photocatalytic system, NiO was found to be the most efficient cocatalyst, which is also widely utilized in other photocatalytic materials.32–38 Kato and Kudo investigated the effect of loading cocatalysts on the photocatalytic performance of ATaO3 (A = Li, Na and K).39 It was found that the photocatalytic activity of KTaO3 for overall water splitting was improved after loading a NiO cocatalyst, which was attributed to the suitable conduction band level composed of Ta 5d orbitals and the delocalization resulted from the proper distortion of TaO6 octahedra. Ishihara et al. reported that Zr-doped KTaO3 loaded by NiO exhibited larger formation rate of H2 by photo-decomposing water than that of a famous photocatalyst Pt/TiO2 under the same reaction conditions.40 Shao et al. found that loading a small amount of NiO as the cocatalyst resulted in the notable enhancement of reaction activity of KTaO3 in photocatalytic reduction of CO2 to methanol.24 The highest yield reached when 2 wt% NiO was added on KTaO3.
Although experimental observations have confirmed the positive effect of loading NiO on enhancing the photocatalytic performance of KTaO3, the function of NiO cocatalyst in the photocatalytic system is not well understood since the details of the interface are quite difficult to obtain from experimental techniques. In this respect, first-principles density functional theory (DFT) calculations can be useful, which have been extensively applied in studying structural, electronic and optical properties of bulk, surfaces and interfacial structures of KTaO3.41–47 Theoretical results have provided reasonable explanations and reliable predictions on experiments. In this work, we have constructed a NiO/KTaO3 slab model and performed DFT computations to study the structural details and stability of the interfacial structure, to investigate the electronic and optical properties, to explore the carrier migration at interface, and to reveal the mechanism of the enhancement of photocatalytic activity by loading NiO cocatalyst on KTaO3 surface.
2. Computational details
Spin-polarized calculations have been performed by means of the projector augmented wave method,48,49 as implemented in the plane-wave basis code Vienna Ab initio Simulation Package (VASP).50,51 The exchange–correlation potentials are represented by the Perdew–Burke–Ernzerhof (PBE) functional within the generalized gradient approximation (GGA).52,53 The plane-wave energy cutoff is set to 400 eV and the Brillouin zone are sampled with Monkhorst–Pack meshes of 9 × 9 × 9 for bulk NiO and KTaO3, 9 × 9 × 1 for the NiO(001), KTaO3(001), and NiO(001)/KTaO3(001) heterostructure, respectively. PBE+U method has been applied to calculate electronic structures due to the strong correlation of 3d electrons of Ni ions.54 The onsite parameter Ueff (= U − J) is set to be 5.3 eV for Ni 3d electrons, which was calculated self-consistently by Ferrari et al.,55 in the range of 4.6–6 eV interval found in the previous literatures,56–58 and applied to study NiO(001) surface in the recent works.59,60 The ground state of NiO is antiferromagnetic spin ordering and the PBE+U local magnetic moment on the Ni ion is 1.66 μB,58,59 which is consistent with the experimental value of 1.64 μB and the previous calculated results of 1.65 μB and 1.68 μB.59,61,62 The DFT-D3 method is applied to describe the internal interactions in interfacial structures.63–65 Structural relaxations are terminated until the force on each atom is less than 0.01 eV Å−1 and the electronic energy is converged to 10−5 eV. We also employ a HSE06 hybrid density functional approach with a screening parameter μ of 0.2 Å−1 and a α value of 0.25 to make a comparison study.66–683. Results and discussion
3.1. Geometry and stability
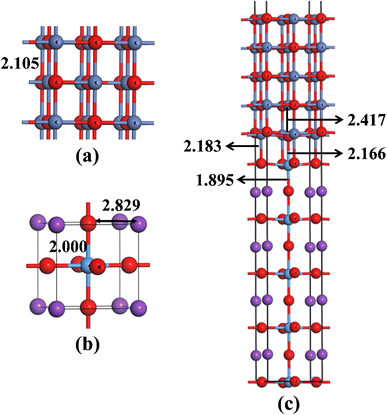
Before building NiO/KTaO3 interfacial structure, fully optimizations are carried out for bulk phases. According to previous investigations,41,69 the cubic phase of KTaO3 with a space group of Pm![[3 with combining macron]](https://www.rsc.org/images/entities/char_0033_0304.gif) m is adopted in the present work. The crystal structures of bulk NiO and KTaO3 are shown in Fig. 1(a) and (b), respectively. The relaxed lattice constants of unit cells are a = b = c = 4.209 Å for NiO and a = b = c = 4.001 Å for KTaO3, which are in good agreement with previous experimental and theoretical reports.61,70,71 NiO has a NaCl-type structure and the optimized bond length of Ni–O is 2.105 Å. Bulk KTaO3 has a cubic structure, in which the relaxed distances are 2.000 Å for Ta–O bond and 2.829 Å between the nearest K and O atom.
m is adopted in the present work. The crystal structures of bulk NiO and KTaO3 are shown in Fig. 1(a) and (b), respectively. The relaxed lattice constants of unit cells are a = b = c = 4.209 Å for NiO and a = b = c = 4.001 Å for KTaO3, which are in good agreement with previous experimental and theoretical reports.61,70,71 NiO has a NaCl-type structure and the optimized bond length of Ni–O is 2.105 Å. Bulk KTaO3 has a cubic structure, in which the relaxed distances are 2.000 Å for Ta–O bond and 2.829 Å between the nearest K and O atom.
Our model representing the NiO/KTaO3 interface is presented in Fig. 1(c), which is composed of a 1 × 1 NiO(001) slab with five alternating atomic layers and a 1 × 1 mirror-symmetric TaO2-terminated KTaO3(001) slab including nine atomic layers.44,72 The calculated lattice constants of bulk KTaO3 and NiO are applied for the lattice matching. This gives rise to a 5% lattice mismatch. The vacuum thickness is more than 15 Å, which is sufficient to avoid the interaction between periodic images. After full relaxation, considerable modifications of the surface structures for two components are observed due to the interaction between KTaO3 surface and NiO surface. As shown in Fig. 1(c), the equilibrium distances are 2.166 Å between the top-most Ta atom and the bottom-most O atom in NiO, and 2.183 Å between the O atom in TaO2-termination and the bottom-most Ni atom, respectively. The Ta atom of the top layer moves towards the NiO(001) surface, which results in the increase of the Ta–O bond length from 1.845 Å in pure KTaO3(001) surface to 1.895 Å in the interfacial structure. The O atom in the bottom layer of NiO side moves downwards and lengthens the distance between O and Ni from 2.157 Å in the pure surface to 2.417 Å in the interface.
The interface binding energy is calculated to evaluate the thermodynamic stability of NiO/KTaO3 heterostructure according to eqn (1):
| Ead = (EKTaO3(001) + ENiO(001) − Einterface)/A | (1) |
3.2. Electronic structure
In order to understand the influence of interfacial orbital hybridization on electronic structures, we have calculated band structures of bulk KTaO3, bulk NiO, KTaO3(001), NiO(001) and NiO(001)/KTaO3(001) heterostructure by means of PBE+U method. Fig. 2 summarizes the computed results drawn along high symmetry lines of the Brillouin zone. As shown in Fig. 2(a), an indirect band gap is predicted to be 2.10 eV for bulk KTaO3 with the valence band maximum (VBM) at the R point and the conduction band minimum (CBM) at the Γ point, which are consistent with previous DFT calculations.76,77 Fig. 2(b) indicates that bulk NiO has an indirect band gap of 1.95 eV and the CBM and VBM are positioned at the L point and the Γ point, respectively. Although the calculated gap widths are smaller than experimental values, the dispersion features of bands are reasonable compared with previous theoretical findings by higher level calculations.78 As displayed in Fig. 2(c) and (d), the predicted band gaps are 1.70 eV for pure KTaO3(001) surface and 0.88 eV for pure NiO(001) surface, which are smaller than those of the corresponding bulks due to the existence of surface dangling bonds. The characterizations of indirect band gaps maintain in isolated surfaces with the VBM situated at the M point and the CBM located at the Γ point for both materials. The result in Fig. 2(e) demonstrates that NiO(001)/KTaO3(001) interface possesses an indirect band gap with the VBM located at the M point and the CBM positioned at the Γ point as well. The interfacial band gap of 0.67 eV is narrower than those of isolated surfaces. For isolated KTaO3(001) and NiO(001)/KTaO3(001) heterostructure, the Fermi levels cross the CBM, showing a n-type-like conductivity, which is mainly due to the surface charge redistribution.46 Under light illumination, the electrons in a semiconductor photocatalytic system are excited from the VBM to the CBM and the holes are generated in the VBM. An indirect band gap is favorable for restraining the recombination of photogenerated electron–hole pairs.79 Therefore, the calculated band structures reveal that the formation of NiO(001)/KTaO3(001) interface benefits the separation of photoinduced electrons and holes.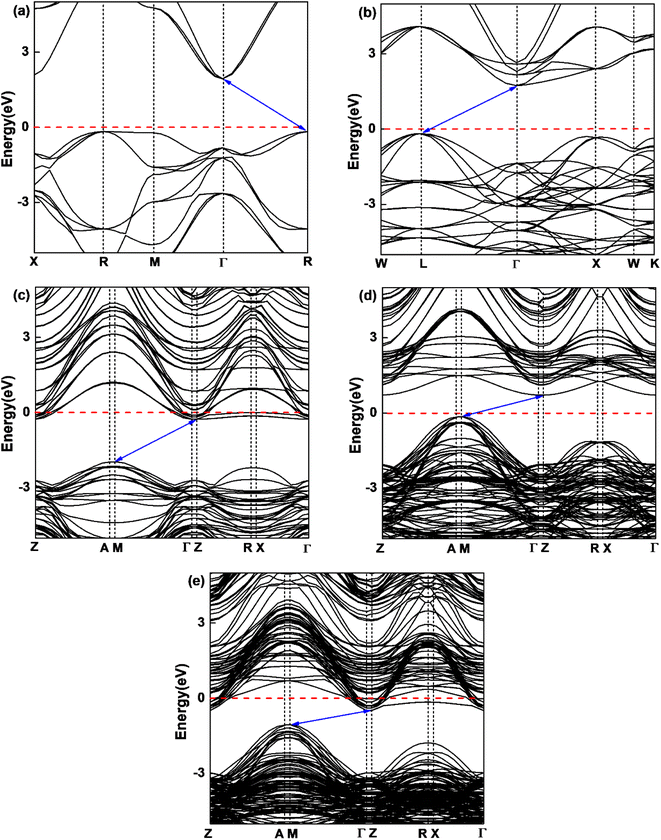 | ||
| Fig. 2 Calculated band structures of (a) bulk KTaO3 and (b) bulk NiO, (c) KTaO3(001), (d) NiO(001), and (e) NiO(001)/KTaO3(001). The Fermi level is set to be zero as a horizontal dashed red line. | ||
In the semiconductor-based photocatalysis, the separation efficiency and mobility of the photogenerated electrons and holes are very crucial for the reaction activity. Since the drift velocity of electrons or holes is inversely proportional to the effective mass, a lower effective mass would imply a higher mobility of charge carriers. In order to investigate the transfer properties of photogenerated carriers, the effective masses of electrons  and holes
  of NiO(001)/KTaO3(001) and components are calculated by parabolic fitting to the CBM and VBM in Fig. 2(c)–(e) according to the following equation:80,81
 | (2) |
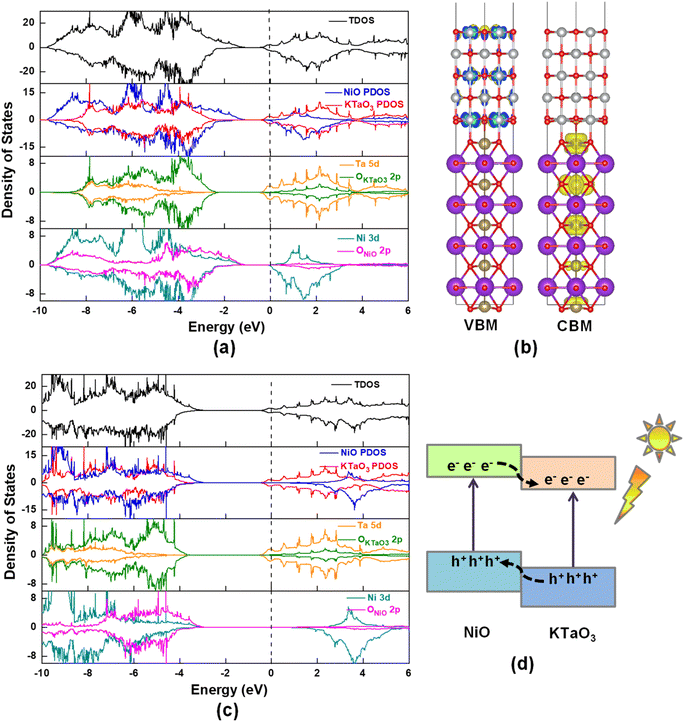
Fig. 3 displays total density of states (TDOS) and project density of states (PDOS) for NiO(001)/KTaO3(001) model. The Fermi level is represented by a vertical dashed line at zero. Fig. 3(a) suggests that there are no interfacial states in the forbidden gap calculated by PBE+U method. High quality interfaces will not trap the photogenerated carriers. The PDOS analyses show that the VBM is mainly from the contributions of NiO states and the CBM primarily consists of KTaO3 states, which are also described by the charge density distributions in Fig. 3(b). Further investigations on each component suggest that the VBM and CBM of KTaO3 slab in the interface are mostly comprised of O 2p states and Ta 5d states, respectively, which are similar with those in bulk.41 As to NiO side in the interface, the VBM is primarily characterized by the mixture of Ni 3d and O 2p states, while the CBM dominantly comes from Ni 3d states.
To evaluate the reasonability and reliability of PBE+U results, the hybrid functional HSE06 is applied to carry out the TDOS and PDOS analyses of NiO(001)/KTaO3(001). A comparison of results obtained by HSE06 and PBE+U methods demonstrates that, there is no apparent difference in the features of all the diagrams, except the width of band gaps. As shown in Fig. 3(c), the calculated band gap is 2.30 eV, remarkably larger than that obtained by PBE+U. The PDOS analyses indicate that the VBM has the main characteristics of NiO states and the CBM has the dominant characteristics of KTaO3 states, which are similar with the predictions by PBE+U. Since HSE06 calculations are much more time-consuming than PBE+U calculations, PBE+U method is utilized to the following calculations. It is shown in Fig. 3(d) that the energy levels of NiO states are higher than those of KTaO3 states in both the VBM and the CBM, indicating a typical type-II band alignment in NiO(001)/KTaO3(001).82 Under proper light irradiation, electrons will be excited to the CBM of semiconductor and accumulate on the KTaO3 side, while the photogenerated holes will transfer to NiO part. Our calculations support previous experimental findings that NiO serves as an oxidation cocatalyst is favorable for the separation and transfer of charge carriers.35
3.3. Charge density difference
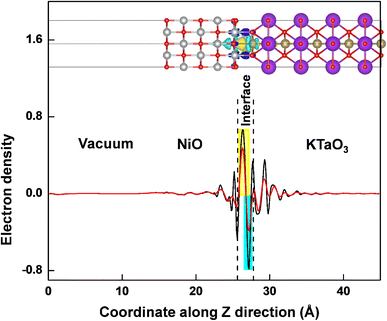
The interaction between KTaO3(001) surface and NiO(001) surface would lead to charge redistribution occurring at the interface. The interlayer interaction can be intuitively visualized from the three-dimensional charge density difference, Δρ = ρNiO/KTaO3 − ρKTaO3 − ρNiO, where ρNiO/KTaO3, ρKTaO3, and ρNiO represent the respective charge densities of NiO(001)/KTaO3(001) interface, isolated KTaO3(001) surface and isolated NiO(001) surface. As shown in the upper part of Fig. 4, the yellow and cyan regions indicate electron accumulation and depletion, respectively. For the interface, charge rearrangements mainly occur between the top atoms of the KTaO3 surface and the bottom atoms of the NiO, and few contributions are observed from the atoms far away from the interface because of the weak interaction between inner atoms of individual surfaces. The electrons transfer from the Ta atoms to the O atoms in NiO surface, reflecting covalent bonding across the interface. Furthermore, the planar averaged charge density difference along the Z direction of the interfacial structure is computed and drawn in the lower part of Fig. 4. The positive and negative values indicate electron accumulation and depletion, respectively. It is shown that electrons accumulate in the NiO side and deplete from the KTaO3 side in the interfacial region, elucidating that there is a significant charge rearrangement occurring in the vicinity of the interface. A dipole pointing from KTaO3 to NiO should be generated, and the induced electric field is in favor of the separation of photogenerated carriers. Under the influence of this internal electric field, the photoinduced electrons migrate from NiO to KTaO3 and the photoinduced holes migrate from KTaO3 to NiO. Consequently, the photogenerated electrons and holes are spatially separated into two sides of NiO(001)/KTaO3(001) photocatalytic system and the charge recombination is restrained, which benefits the enhancement of photocatalytic activity.3.4. Work function
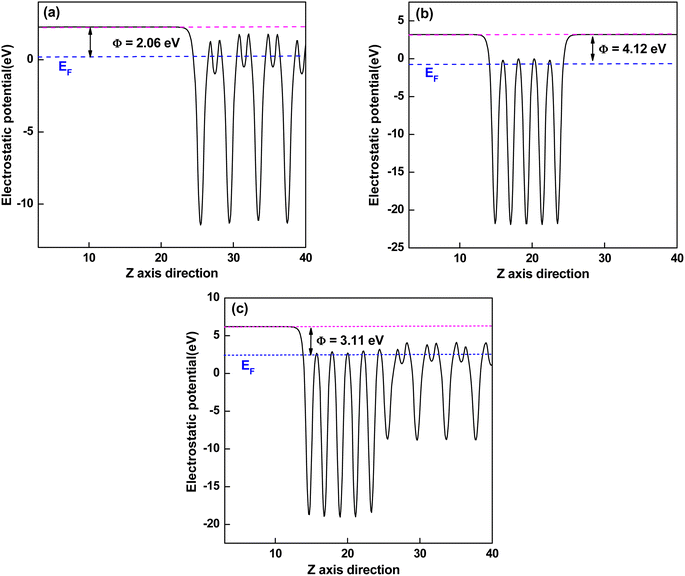
The work function of a material is the minimum energy required to remove an electron from the bulk through the surface to the vacuum, which is an important parameter as an intrinsic reference for band alignment. Here, the work function (Φ) is defined as the difference between the potential energy of one electron between Fermi level and vacuum level according to eqn (3):| Φ = Vvac − EF | (3) |
3.5. Optical property
The optical absorption property of a photocatalytic material is a key parameter in describing the photocatalytic activity, which is highly related to its crystal and electronic structures.83 The photon energy dependent absorption coefficient α(ω) of the studied photocatalytic system is calculated according to eqn (4):84,85
 | (4) |
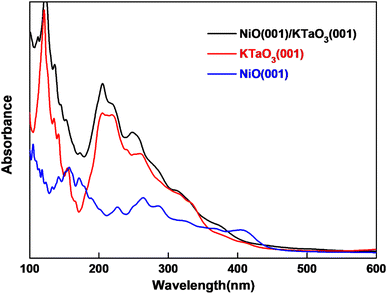 | ||
| Fig. 6 Computed optical absorption curves of NiO(001)/KTaO3(001), KTaO3(001) and NiO(001) slab models. | ||
3.6. The mechanism of oxygen evolution reaction
The predicted results above demonstrate that NiO could act as an oxidation cocatalyst during the photocatalytic process. The oxygen evolution reaction (OER) by splitting water involves four-electron transfer, which is more complicated than the hydrogen evolution reaction and thus considered to be the rate-determining step in the whole reaction.86 In this work, we only investigate the thermodynamic process of OER using the approach proposed by Nørskov et al.87,88 In the electrochemical computation, OER generally includes four elementary steps at pH = 0, in which the electron transfer is coupled with proton removal as follows:| H2O + * → HO* + H+ + e− | (A) |
| HO* → O* + H+ + e− | (B) |
| H2O + O* → HOO* + H+ + e− | (C) |
| HOO* → * + O2 + H+ + e− | (D) |
| ΔG = ΔE + ΔZPE − TΔS − eU | (5) |
 | (6) |
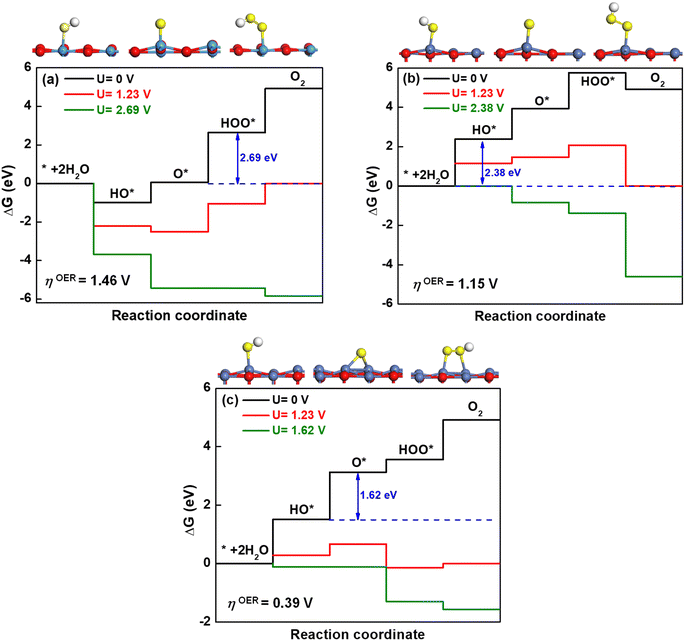
The optimized geometries for the most stable oxidation species, including hydroxyl (HO*), oxygen (O*) and hydroperoxo (HOO*) are displayed in Fig. 7(a)–(c) for KTaO3(001), NiO(001) and NiO(001)/KTaO3(001), respectively. Based on these structures, the free-energy diagrams of OER at pH = 0, T = 298 K and different applied potentials are drawn in Fig. 7. At U = 0 V and the standard equilibrium potential for OER (U = 1.23 V), most of the steps are uphill. Therefore, it is necessary to add an overpotential on all the surfaces to make every step downhill. As to KTaO3(001), the calculated ΔGHO* value for the first step is −0.99 eV, indicative of strong interaction between hydroxyl and the Ta atom in the surface. This strong binding character may easily poison the catalyst.89 Consequently, the third step to generate a HOO* intermediate becomes the potential-determining step. The corresponding overpotential is 1.46 V. For NiO(001), the computed value of ΔGHO* for the first step is 2.38 eV. The binding strength of HO* is too weak, making the water difficult to dissociate into a HO* group in this step. As a result, the first step becomes the potential-determining step, requiring an overpotential of 1.15 V. For NiO(001)/KTaO3(001), the calculated ΔGA, ΔGB, ΔGC and ΔGD are 1.51, 1.62, 0.43 and 1.36 eV, respectively. Consequently, the second step determines the potential, in which OH* is deprotonated to O* with the O atom in water leaning to a near Ta atom in the surface and forming an extra Ta–O bond. The corresponding overpotential is equal to 0.39 V. As can be seen, the formation of the interfacial structure between NiO and KTaO3 results in the remarkable decrease of overpotential for OER and benefits the occurrence of photocatalytic water oxidation (Fig. 7).
4. Conclusion
We have performed DFT first-principles simulations to investigate the interfacial structures, electronic properties, optical absorption, charge transfer and band alignment of NiO/KTaO3 heterostructure. The binding energy and interfacial equilibrium distances indicate that there is a covalent interaction between KTaO3(001) and NiO(001). The analyses of band structure, charge density difference, and work function demonstrate that NiO/KTaO3 composite has an indirect band gap and an induced internal electric field at the interface, which are driving forces for the carrier migration to different regions of interface. It is found that both PBE+U and HSE06 produce a type-II band alignment for NiO(001)/KTaO3(001) slab model, with the accumulation of photogenerated electrons on KTaO3 side and the gathering of photoinduced holes on NiO side. These characteristics benefit the separation of photogenerated electrons and holes and increase the lifetime of carrier charges. The interfacial formation has a small impact on the optical absorption of photocatalytic system, which is in good agreement with experimental results. The addition of NiO layer on KTaO3 surface makes the adsorption of water oxidation species more moderate, which importantly decreases the overpotential of OER. This work reveals an important role of NiO as the oxidation cocatalyst to separate the charge carriers in KTaO3 photocatalytic system and provides an insight into the mechanism of the remarkable enhancement of photocatalytic activity in KTaO3 by loading NiO particles.Conflicts of interest
There are no conflicts to declare.Acknowledgements
Dr Wu gratefully acknowledges the financial support from the Science Foundation of the Fujian Province, China (Grant No. 2021J01779), Dr Cai thanks the financial support from Joint Funds for the Innovation of Science and Technology, Fujian Province (Grant No. 2020Y9089) and the Science Foundation of the Fujian Province, China (Grant No. 2021J02041), and Dr Zhou appreciates the funding support by the Opening Project of State Key Laboratory of High Performance Ceramics and Superfine Microstructure, Chinese Academy of Sciences (Grant No. SKL202007SIC).References
- H. Tanaka and M. Misono, Curr. Opin. Solid State Mater. Sci., 2001, 5, 381–387 CrossRef CAS.
- M. A. Peña and J. L. G. Fierro, Chem. Rev., 2001, 101, 1981–2018 CrossRef PubMed.
- I. Grinberg, D. V. West, M. Torres, G. Gou, D. M. Stein, L. Wu, G. Chen, E. M. Gallo, A. R. Akbashev, P. K. Davies, J. E. Spanier and A. M. Rappe, Nature, 2013, 503, 509–512 CrossRef CAS PubMed.
- E. Grabowska, Appl. Catal., B, 2016, 186, 97–126 CrossRef CAS.
- G. Zhang, G. Liu, L. Wang and J. T. S. Irvine, Chem. Soc. Rev., 2016, 45, 5951–5984 RSC.
- M. Kubicek, A. H. Bork and J. L. M. Rupp, J. Mater. Chem. A, 2017, 5, 11983–12000 RSC.
- S. Mathews, R. Ramesh, T. Venkatesan and J. Benedetto, Science, 1997, 276, 238–240 CrossRef CAS PubMed.
- J. S. Manser, J. A. Christians and P. V. Kamat, Chem. Rev., 2016, 116, 12956–13008 CrossRef CAS PubMed.
- W.-H. Lin, C. Cheng, C.-C. Hu and H. Teng, Appl. Phys. Lett., 2006, 89, 211904 CrossRef.
- C.-C. Hu, Y.-L. Lee and H. Teng, J. Mater. Chem., 2011, 21, 3824–3830 RSC.
- P. Li, S. Ouyang, G. Xi, T. Kako and J. Ye, J. Phys. Chem. C, 2012, 116, 7621–7628 CrossRef CAS.
- S. W. Arulnesan, P. Kayser, B. J. Kennedy, J. A. Kimpton and K. S. Knight, Solid State Sci., 2016, 52, 149–153 CrossRef CAS.
- D. J. Singh, Phys. Rev. B: Condens. Matter Mater. Phys., 1996, 53, 176–180 CrossRef CAS PubMed.
- S. H. Wemple, Phys. Rev. [Sect.] A, 1965, 137, A1575–A1582 CrossRef.
- X. Chen, S. Shen, L. Guo and S. S. Mao, Chem. Rev., 2010, 110, 6503–6570 CrossRef CAS PubMed.
- Z. Chen, P. Xing, P. Chen, Q. Chen, Y. Wang, J. Yu and Y. He, Catal. Commun., 2018, 109, 6–9 CrossRef CAS.
- Z. Wang, Y. Inoue, T. Hisatomi, R. Ishikawa, Q. Wang, T. Takata, S. Chen, N. Shibata, Y. Ikuhara and K. Domen, Nat. Catal., 2018, 1, 756–763 CrossRef CAS.
- D. Xu, S. Yang, Y. Jin, M. Chen, W. Fan, B. Luo and W. Shi, Langmuir, 2015, 31, 9694–9699 CrossRef CAS PubMed.
- B. Bajorowicz, A. Cybula, M. J. Winiarski, T. Klimczuk and A. Zaleska, Molecules, 2014, 19, 15339–15360 CrossRef PubMed.
- A. Krukowska, G. Trykowski, M. J. Winiarski, T. Klimczuk, W. Lisowski, A. Mikolajczyk, H. P. Pinto and A. Zaleska-Medynska, Appl. Surf. Sci., 2018, 441, 993–1011 CrossRef CAS.
- A. Krukowska, G. Trykowski, W. Lisowski, T. Klimczuk, M. J. Winiarski and A. Zaleska-Medynska, J. Catal., 2018, 364, 371–381 CrossRef CAS.
- B. Bajorowicz, J. Reszczyńska, W. Lisowski, T. Klimczuk, M. Winiarski, M. Słoma and A. Zaleska-Medynska, RSC Adv., 2015, 5, 91315–91325 RSC.
- K. Teramura, S.-i. Okuoka, H. Tsuneoka, T. Shishido and T. Tanaka, Appl. Catal., B, 2010, 96, 565–568 CrossRef CAS.
- X. Shao, X. Yin and J. Wang, J. Colloid Interface Sci., 2018, 512, 466–473 CrossRef CAS PubMed.
- A. Kudo and Y. Miseki, Chem. Soc. Rev., 2009, 38, 253–278 RSC.
- T. Hisatomi, J. Kubota and K. Domen, Chem. Soc. Rev., 2014, 43, 7520–7535 RSC.
- Q. Wang and K. Domen, Chem. Rev., 2020, 120, 919–985 CrossRef CAS PubMed.
- J. Yang, D. Wang, H. Han and C. Li, Acc. Chem. Res., 2013, 46, 1900–1909 CrossRef CAS PubMed.
- S. Bai, W. Yin, L. Wang, Z. Li and Y. Xiong, RSC Adv., 2016, 6, 57446–57463 RSC.
- K. Maeda and K. Domen, Bull. Chem. Soc. Jpn., 2016, 89, 627–648 CrossRef CAS.
- D. Wang, Z.-P. Liu and W.-M. Yang, ACS Catal., 2018, 8, 7270–7278 CrossRef CAS.
- Y. Takashi, S. Yoshihisa and I. Hayao, Chem. Lett., 2004, 33, 726–727 CrossRef.
- X. Wang, Q. Xu, M. Li, S. Shen, X. Wang, Y. Wang, Z. Feng, J. Shi, H. Han and C. Li, Angew. Chem., Int. Ed., 2012, 51, 13089–13092 CrossRef CAS PubMed.
- T. K. Townsend, N. D. Browning and F. E. Osterloh, Energy Environ. Sci., 2012, 5, 9543–9550 RSC.
- Q. Zhang, Z. Li, S. Wang, R. Li, X. Zhang, Z. Liang, H. Han, S. Liao and C. Li, ACS Catal., 2016, 6, 2182–2191 CrossRef CAS.
- L. Zhang, Q. Liu, T. Aoki and P. A. Crozier, J. Phys. Chem. C, 2015, 119, 7207–7214 CrossRef CAS.
- C.-C. Hu and H. Teng, J. Catal., 2010, 272, 1–8 CrossRef CAS.
- M. Wang, Y. Ma, Y. Fo, Y. Lyu and X. Zhou, Int. J. Hydrogen Energy, 2020, 45, 19357–19369 CrossRef CAS.
- H. Kato and A. Kudo, J. Phys. Chem. B, 2001, 105, 4285–4292 CrossRef CAS.
- T. Ishihara, H. Nishiguchi, K. Fukamachi and Y. Takita, J. Phys. Chem. B, 1999, 103, 1–3 CrossRef CAS.
- Y.-Q. Xu, S.-Y. Wu, L.-J. Zhang, L.-N. Wu and C.-C. Ding, Phys. Status Solidi B, 2017, 254, 1600620 CrossRef.
- S. Nazir, N. Singh and U. Schwingenschlögl, Phys. Rev. B, 2011, 83, 113107 CrossRef.
- M. Setvin, M. Reticcioli, F. Poelzleitner, J. Hulva, M. Schmid, L. A. Boatner, C. Franchini and U. Diebold, Science, 2018, 359, 572–575 CrossRef CAS PubMed.
- X. Zhao and A. Selloni, Phys. Rev. Mater., 2019, 3, 015801 CrossRef CAS.
- H. Wang, F. Wu and H. Jiang, J. Phys. Chem. C, 2011, 115, 16180–16186 CrossRef CAS.
- Y. Wang, J. Cheng, M. Behtash, W. Tang, J. Luo and K. Yang, Phys. Chem. Chem. Phys., 2018, 20, 18515–18527 RSC.
- Y. Yang, C.-S. Lin and W.-D. Cheng, AIP Adv., 2015, 5, 057147 CrossRef.
- P. E. Blöchl, Phys. Rev. B: Condens. Matter Mater. Phys., 1994, 50, 17953–17979 CrossRef PubMed.
- G. Kresse and D. Joubert, Phys. Rev. B: Condens. Matter Mater. Phys., 1999, 59, 1758–1775 CrossRef CAS.
- G. Kresse and J. Furthmüller, Phys. Rev. B: Condens. Matter Mater. Phys., 1996, 54, 11169–11186 CrossRef CAS PubMed.
- G. Kresse and J. Furthmüller, Comput. Mater. Sci., 1996, 6, 15–50 CrossRef CAS.
- J. P. Perdew, K. Burke and M. Ernzerhof, Phys. Rev. Lett., 1996, 77, 3865–3868 CrossRef CAS PubMed.
- W. Kohn and L. J. Sham, Phys. Rev. [Sect.] A, 1965, 140, A1133–A1138 CrossRef.
- S. L. Dudarev, G. A. Botton, S. Y. Savrasov, C. J. Humphreys and A. P. Sutton, Phys. Rev. B: Condens. Matter Mater. Phys., 1998, 57, 1505–1509 CrossRef CAS.
- A. M. Ferrari, C. Pisani, F. Cinquini, L. Giordano and G. Pacchioni, J. Chem. Phys., 2007, 127, 174711 CrossRef PubMed.
- W. E. Pickett, S. C. Erwin and E. C. Ethridge, Phys. Rev. B: Condens. Matter Mater. Phys., 1998, 58, 1201–1209 CrossRef CAS.
- O. Bengone, M. Alouani, P. Blöchl and J. Hugel, Phys. Rev. B: Condens. Matter Mater. Phys., 2000, 62, 16392–16401 CrossRef CAS.
- M. Cococcioni and S. de Gironcoli, Phys. Rev. B: Condens. Matter Mater. Phys., 2005, 71, 035105 CrossRef.
- M. Nolan, R. Long, N. J. English and D. A. Mooney, J. Chem. Phys., 2011, 134, 224703 CrossRef PubMed.
- J. He, W.-H. Fang and R. Long, J. Mater. Chem. A, 2020, 8, 607–615 RSC.
- G. A. Sawatzky and J. W. Allen, Phys. Rev. Lett., 1984, 53, 2339–2342 CrossRef CAS.
- R. Long, N. J. English and D. A. Mooney, Phys. Lett. A, 2010, 374, 1184–1187 CrossRef CAS.
- S. Grimme, J. Comput. Chem., 2006, 27, 1787–1799 CrossRef CAS PubMed.
- S. Grimme, J. Antony, S. Ehrlich and H. Krieg, J. Chem. Phys., 2010, 132, 154104 CrossRef PubMed.
- S. Grimme, S. Ehrlich and L. Goerigk, J. Comput. Chem., 2011, 32, 1456–1465 CrossRef CAS PubMed.
- J. Heyd, G. E. Scuseria and M. Ernzerhof, J. Chem. Phys., 2003, 118, 8207–8215 CrossRef CAS.
- J. Heyd and G. E. Scuseria, J. Chem. Phys., 2004, 120, 7274–7280 CrossRef CAS PubMed.
- J. Heyd, G. E. Scuseria and M. Ernzerhof, J. Chem. Phys., 2006, 124, 219906 CrossRef.
- B. Modak and S. K. Ghosh, J. Phys. Chem. C, 2016, 120, 6920–6929 CrossRef CAS.
- P. Vousden, Acta Crystallogr., 1951, 4, 373–376 CrossRef CAS.
- N. Yu, W.-B. Zhang, N. Wang, Y.-F. Wang and B.-Y. Tang, J. Phys. Chem. C, 2008, 112, 452–457 CrossRef CAS.
- H. Seo and A. A. Demkov, J. Appl. Phys., 2014, 116, 245305 CrossRef.
- Z. Shi, W. Shao, T. Hu, C. Zhao, X. Xing, Y. Zhou and Q. Yang, J. Alloys Compd., 2019, 805, 1052–1059 CrossRef CAS.
- L. Chen, Y. Li, B. Xiao, Q. Zheng, Y. Gao, S. Zhao and Z. Wang, Mater. Des., 2019, 183, 108119 CrossRef CAS.
- T. Björkman, A. Gulans, A. V. Krasheninnikov and R. M. Nieminen, Phys. Rev. Lett., 2012, 108, 235502 CrossRef PubMed.
- H. W. Eng, P. W. Barnes, B. M. Auer and P. M. Woodward, J. Solid State Chem., 2003, 175, 94–109 CrossRef CAS.
- M. Choi, F. Oba and I. Tanaka, Phys. Rev. B: Condens. Matter Mater. Phys., 2011, 83, 214107 CrossRef.
- F. Opoku, K. K. Govender, C. G. C. E. van Sittert and P. P. Govender, ChemistrySelect, 2017, 2, 6304–6316 CrossRef CAS.
- F. Opoku, K. K. Govender, C. G. C. E. van Sittert and P. P. Govender, New J. Chem., 2017, 41, 11701–11713 RSC.
- L. Thulin and J. Guerra, Phys. Rev. B: Condens. Matter Mater. Phys., 2008, 77, 195112 CrossRef.
- K. Ding, B. Chen, Y. Li, Y. Zhang and Z. Chen, J. Mater. Chem. A, 2014, 2, 8294–8303 RSC.
- M.-G. Ju, X. Wang, W. Liang, Y. Zhao and C. Li, J. Mater. Chem. A, 2014, 2, 17005–17014 RSC.
- J. Zhang, F. Ren, M. Deng and Y. Wang, Phys. Chem. Chem. Phys., 2015, 17, 10218–10226 RSC.
- S. Saha, T. P. Sinha and A. Mookerjee, Phys. Rev. B: Condens. Matter Mater. Phys., 2000, 62, 8828–8834 CrossRef CAS.
- M. Gajdoš, K. Hummer, G. Kresse, J. Furthmüller and F. Bechstedt, Phys. Rev. B: Condens. Matter Mater. Phys., 2006, 73, 045112 CrossRef.
- Y.-F. Li, Z.-P. Liu, L. Liu and W. Gao, J. Am. Chem. Soc., 2010, 132, 13008–13015 CrossRef CAS PubMed.
- J. Rossmeisl, Z. W. Qu, H. Zhu, G. J. Kroes and J. K. Nørskov, J. Electroanal. Chem., 2007, 607, 83–89 CrossRef CAS.
- Á. Valdés, Z. W. Qu, G. J. Kroes, J. Rossmeisl and J. K. Nørskov, J. Phys. Chem. C, 2008, 112, 9872–9879 CrossRef.
- X. Gao, Y. Zhou, Y. Tan, S. Liu, Z. Cheng and Z. Shen, Appl. Surf. Sci., 2019, 492, 8–15 CrossRef CAS.
| This journal is © The Royal Society of Chemistry 2022 |

