 Open Access Article
Activated carbon from almond shells using an eco-compatible method: screening, optimization, characterization, and adsorption performance testing
H. Boulika *a,
M. El Hajamab,
M. Hajji Nabiha,
N. Idrissi Kandria and
A. Zeroualeb
aSignals, Systems and Components Laboratory (SSCL), Faculty of Sciences and Techniques, Sidi Mohammed Ben Abdellah University, Road Imouzzer BP 2202, Atlas, Fez, Morocco. E-mail: Hamza.boulika@usmba.ac.ma
bProcesses, Materials and Environment Laboratory (PMEL), Faculty of Sciences and Techniques, Sidi Mohammed Ben Abdellah University, Road Imouzzer, BP 2202, Atlas, Fez, Morocco
First published on 30th November 2022
Abstract
Activated carbon as a low-cost adsorbent prepared from almond shells using H3PO4 as a chemical activator and room vacuum pyrolysis as a physical activator, which is considered to be an eco-compatible preparation process. Experimental design methodology was used to study and optimize the effects of eight preparation parameters on I2 adsorption expressed by the iodine index (mg g−1). It was found that optimum activated carbon was obtained by chemical activation with H3PO4 at first, followed by physical treatment at 420 °C under a vacuum pressure of −0.8 bar. The obtained activated carbon was characterized by a thermogravimetric analyzer, scanning electron microscopy coupled to EDX, X-ray diffraction, and Fourier transform infrared absorption spectroscopy. The zero-charge pH and the characteristics of surface chemistry by Boehm titration were determined to predict the acid–base properties of the prepared material. An adsorption efficiency study of crystal violet dye on the optimally produced activated carbon was carried out. The obtained results of physicochemical characterization showed interesting properties of our activated carbon in comparison with those produced by other methods. Among these properties, an important porous surface, high thermal stability, and a disorganized graphitic crystalline structure were revealed. In addition to the carbon and oxygen elements, EDX analysis revealed the presence of phosphorus element, and the FTIR analysis indicated the existence of phosphonate groups and an acidic character, which resulted from chemical activation by H3PO4. An iodine index of 824.85 mg g−1 was achieved for optimal preparation. Crystal violet adsorption studies show a pseudo-first-order kinetic process and fit well with the Freundlich isotherm model, and thus, the predicted adsorption capacity was 364.27 mg g−1.
1 Introduction
Since antiquity, activated carbon (AC) has been prepared from any solid material loaded with carbon.1 It is a material known for its porous structure, thermostability, and especially for its adsorbent characteristic.2 It is increasingly used in the separation and purification processes of fluid effluents; it is also applied as a support for catalysts, supercapacitors, electrodes, and gas storage processes.3–5The control of its texture, porosity, and chemical characteristics requires the control and optimization of parameters that influence its production process by physical and/or chemical activation.6,7 Typically, the physical activation consists of the pyrolysis of the precursor material and the activation of the resulting char in steam or carbon dioxide. Chemical activation is a single-step process and is held in the presence of a chemical activator, such as KOH, NaOH, K2CO3, H3PO4, and H2SO4.8–11 Physical activation under atmospheric vacuum is slightly reported by literature and presents several advantages such as a shorter residence time of volatile matter, a more oxidant-sensitive biochar surface, and high carbon yield.12,13 Therefore, it is expected that activated carbon has important properties.13,14 This is attributed to the effect of the vacuum condition that reduces oxygen in the system, limits the secondary reaction of the dangerous organic vapor, and avoids environmental pollution by recovering these gases. Recently, the use of lignocellulosic wastes as a precursor for the production of activated carbon has increasingly attracted scientists,15,16 such as almond shells that account for about 50% of almond production and is characterized by a high content of lignocellulosic materials and a spongy structure because of their high volatile content, high fixed carbon content, low ash content, zero sulfur content, and low nitrogen content, making it a competitive alternative precursor for the preparation of activated carbon, as well as its availability and low cost compared to conventionally used raw materials, which are expensive and non-renewable.17
Experimental design methodology (EDM) has become a method of choice for assessing factors. A preliminary study using the asymmetric screening design (ASD) of the parameters influencing the preparation of activated carbon was achieved. This type of plan is required to obtain preliminary information on the influence of these variables on the quality of activated carbon.18 They can generally indicate the trend of the obtained response at various levels of the factors and give indications of the choice of the experimental field to be studied in the final optimization stage.19 The important selected factors have been optimized by the response surface methodology based on the central composite design to determine the optimal operating conditions of the system.
In this context, this study contributes to the protection of the environment by developing activated carbons based on almond shells via an eco-compatible method involving chemical preparation and physical preparation via pyrolysis under vacuum. The optimization of the various factors influencing the preparation of the activated carbon by experimental design methodology was achieved. The characterization of the final product made it possible to prove its thermal stability, morphology, and determine its crystallinity, functional groups, surface functions, and pH with zero charges. The adsorption of a cationic dye, namely, crystal violet, onto the optimal activated carbon, was conducted.
2 Results and discussion
2.1 Statistical validation of the model
The statistical validation of the proposed model in the preliminary study concerning the most influencing factors on the preparation of activated carbon by factorial screening design was based on three main criteria–analysis of variance (ANOVA), coefficients of determination (R2 & R2 adjusted), and residue analysis.25,33The results showed that the main effect of the regression is significant since the probability of significance of the p-value risk is 0.0524, which is less than 0.1 for 90% confidence level (Table 1). In addition, the model does not show a lack of fit. The calculated values of the R2 coefficients of determination and the adjusted R2 are 98% and 95%, respectively, and are sufficient to validate the model since these letters give good agreement between the experimental and predicted values.
| Source variation | Sum squares | Freedom degree | Medium square | Ratio | p-value |
|---|---|---|---|---|---|
| Regression | 5.2803 × 10⁴ | 10 | 5.2803 × 10³ | 35.1783 | 0.524 |
| Residual | 7.5051 × 10² | 5 | 1.5010 × 10² | ||
| Sum | 5.3553 × 10⁴ | 10 |
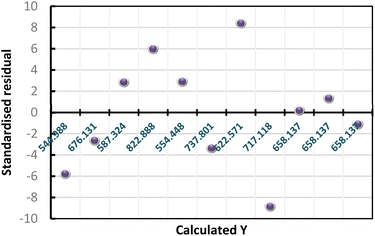
The results of standardized residual distribution (Fig. 1A) are consistent with those obtained by the analysis of the variance cited in Table 1; they show that the residues are distributed randomly as a function of the response Y. Based on these results, we conclude that the appropriate model is well validated.
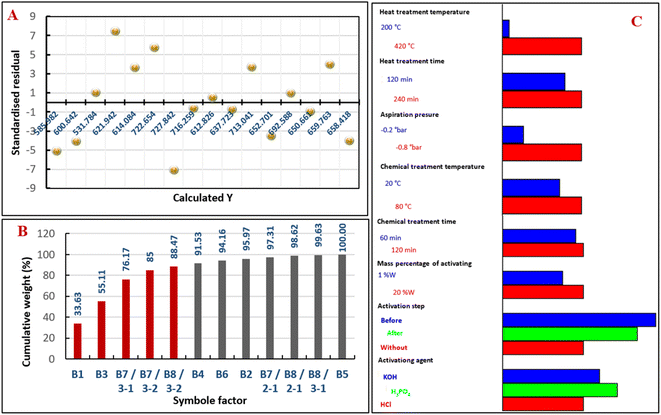 | ||
| Fig. 1 Standardized residual distribution graph (A), Pareto chart of the cumulative weight contribution (B), graphical study of the level factors influencing the direction (C). | ||
2.2 Study of the effects of the main factors
The results of the experimental design are presented in the form of a histogram (Fig. 1B). The analysis of the Pareto diagram, representing the weight of the cumulative contribution of each factor to the construction of the proposed model, reveals that 88% (red color of the histogram bar) of this contribution results from the heat physical treatment temperature (B1), vacuum pressure (B3), chemical activation before the physical treatment (B7), and chemical activation using phosphoric acid (B8). This means that the other factors have no significant effect on iodine index response; therefore, they do not influence the preparation of activated carbon. The direction of the response variation as a function of the level factor and their contribution weights made it possible to construct the histogram of factors and their direction of influence, as shown in Fig. 1C. It is noted that all quantitative factors have a positive effect with different contribution weights, while qualitative factors have important effects on chemical activation by phosphoric acid before physical treatment; this is in agreement with the results previously published.34–36The temperature of the heat treatment has a significant effect on the preparation of activated carbon since the increase in this latter leads to the development of pores; therefore, the structure becomes more porous due to the degradation of volatile organic compounds,37 which makes it possible to achieve a high iodine index. The suction of the gases formed during the heat treatment promotes the kinetics of formation of the developed activated carbon and makes it possible to avoid the fixation of these gases on the walls of the pores; consequently, the porosity is in direct relation with this factor. The chemical activation of activated carbon before physical treatment facilitates carbonization and develops more structural properties by creating significant porosities in carbon.38 This is due to the removal of much of the volatile organic matter. The reaction of H3PO4 with the biopolymers (lignins, hemicelluloses, and cellulose) results in the formation of biopolymer fragments crosslinked by phosphate and polyphosphate bridges,39 which accelerates their thermal degradation and leads to high porosity.
2.3 Composite design optimization
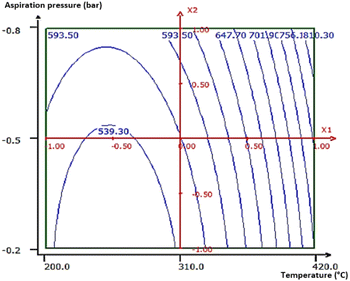
The optimization of the temperature of the heat treatment (B1) and the suction pressure (B3) (most influential quantitative factors) on the response was carried out using a central composite design with three central test points, keeping the same level as the previous study factors (Table 2).| Factor | Designation | Central level (0) | Step variation |
|---|---|---|---|
| Heat treatment temperature (°C) | X1 | 310 | 110 |
| Vacuum pressure (bar) | X2 | −0.5 | −0.3 |
| Y = 565.705 + 114.21x1 + 32.78x2 + 108.53x12 + 10.19x22 + 7.93x1x2 | (1) |
| Source variation | Sum squares | Freedom degree | Medium square | Ratio | p-value |
|---|---|---|---|---|---|
| Regression | 1.18982 × 10⁵ | 5 | 2.37964 × 10⁴ | 1776.045 | <0.01 |
| Residual | 2.38303 × 10³ | 5 | 4.76605 × 10² | ||
| Lack of fit | 2.35623 × 10³ | 3 | 7.85410 × 10² | 58.6191 | 1.68 |
| Pure experimental error | 2.6797 | 2 | 13.3985 | ||
| Sum | 1.21365 × 10⁵ | 10 |
2.4 Optimally-activated carbon characterization
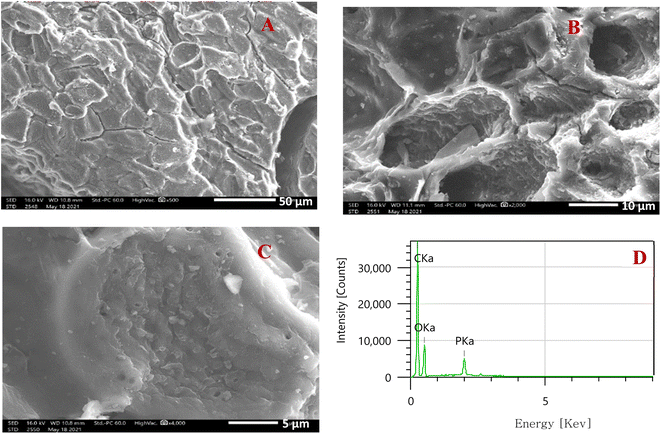 | ||
| Fig. 4 Microphotographs of activated carbon produced at various enlargements: ×500 (A), ×2000 (B), ×4000 (C), and EDX analysis (D). | ||
The results of the qualitative analysis obtained by SEM assisted by an electronic microprobe (EDX) (Fig. 4D) reveal the dominant presence of carbon with a small percentage of oxygen and traces of phosphorus. This suggests that this material consists essentially of graphite carbon; the presence of phosphorus is due to activation by phosphoric acid, which has reacted with the acidic surface functions.
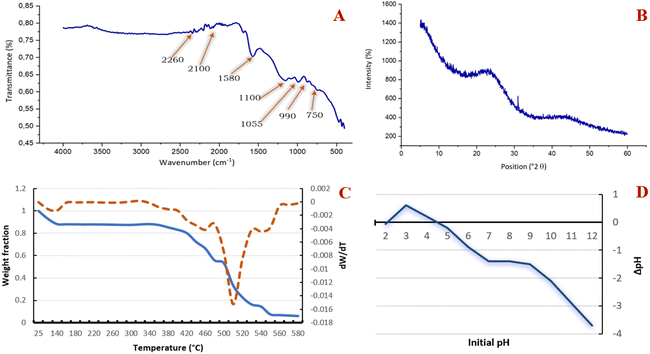
![[triple bond, length as m-dash]](https://www.rsc.org/images/entities/char_e002.gif) C alkynes,41,42 and the band at 1580 cm−1 is related to the stretching of the C
C alkynes,41,42 and the band at 1580 cm−1 is related to the stretching of the C![[double bond, length as m-dash]](https://www.rsc.org/images/entities/char_e001.gif) C bonds of the olefins (alkenes) and of the benzyl rings.43 A wide band at about 1100 cm−1 corresponding to the deformation in the plane of the C–O aliphatic bonds is attributed to the carboxylic acids.44 The phosphonate groups exhibiting the characteristic absorption band at about 1055 cm−1 is attributed to the stretching of the P–OH bond.45 The bands at about 990 cm−1 and 750 cm−1 are linked to the vibrations of the C–H bond.34,35
C bonds of the olefins (alkenes) and of the benzyl rings.43 A wide band at about 1100 cm−1 corresponding to the deformation in the plane of the C–O aliphatic bonds is attributed to the carboxylic acids.44 The phosphonate groups exhibiting the characteristic absorption band at about 1055 cm−1 is attributed to the stretching of the P–OH bond.45 The bands at about 990 cm−1 and 750 cm−1 are linked to the vibrations of the C–H bond.34,35
| Oxygen functions | Concentration (meq g−1) |
|---|---|
| Strong carboxylic acid | 0.94 |
| Lactone and weak carboxylic acid | 0.089 |
| Hydroxyl and phenol | 0.67 |
| Total acid functions | 1.699 |
| Basic functions | 0.52 |
2.5 Crystal violet (CV) adsorption on the optimal activated carbon
The effect of pH on CV adsorption over a range of 3 to 6 as a function of time was studied (Fig. 6A). The obtained results showed that the maximum adsorption was observed at pH = 5 after 20 min. The pHpzc being 4.5, the surface of the activated carbon produced under the optimum experimental conditions is therefore negatively charged, which leads to electrostatic attractions between the positively charged CV molecules and the pore surface of the negatively charged activated carbon.49,50 This improves the fixation of the dye molecules into the activated carbon surface. At pH = 3, the adsorption equilibrium was not clearly achieved and presents the lowest removal rate as H+ protons compete with positively charged dye molecules by binding to the surface of the carbon.49The obtained results indicate a maximum adsorption percentage of 91.77% after 30 min of contact for 10 ppm CV concentration (Fig. 6B). The observed decrease could be explained by the saturation of the active pores due to the high concentration of the dye toward the available adsorption sites. These results are in agreement with several previous works.51–54,58
 | ||
| Fig. 7 Curves illustrating the kinetic model of adsorption on AC; pseudo-first order (A), pseudo-second order (B), DC = 100 ppm (MG), pH = 5 for (MG), T = 25 °C. | ||
| Kinetic model | Parameter | Value | Adjusted correlation coefficient | Standard deviation | p-value |
|---|---|---|---|---|---|
| Pseudo-first order | Qe (mg g−1) | 0.9888 | 0.6579 | 0.2790 | 0.0002 |
| Kf (min−1) | −3.6333 | ||||
| Pseudo-second order | Qe (mg g−1) | 193.5341 | 0.9994 | 0.0062 | 0.0000 |
| Kf (min−1) | 0.0036 |
| Isothermal models | Parameter | Value | Adjusted correlation coefficient | Standard deviation | p-value |
|---|---|---|---|---|---|
| Langmuir | Qm (mg g−1) | 535.99 | 0.4518 | 0.0310 | 0.0043 |
| Kl (L mg−1) | 0.03 | ||||
| Freundlich | 1/n | 0.83 | 0.9660 | 0.1527 | 1.1031 × 10¹¹ |
| Kf (mg g−1) | 14.43 |
Table 7 compares the present preparation method with other methods of activated carbon from almond shells by the iodine index as a basic characteristic for the porosity of activated carbon and the adsorption efficiency toward the organic pollutants. The highest activated carbon iodine index (824.85 mg g−1) and the elimination of organic pollutants are achieved by the present method. The other methods are complex and not eco-compatible compared to this work. Thus, the prepared activated carbon has good properties as a low-cost adsorbent for water remediation.
| Almond shell origin | Preparation method | Iodine index (mg g−1) | Adsorption efficiency | Reference |
|---|---|---|---|---|
| The northern region of Morocco | Chemical activation phosphoric acid (1% W) activation agent before a physical treatment at 420 °C under vacuum (−0.8 bar) | 824.85 | 364.27 mg g−1 for crystal violet dye | This study |
| Turkey | Chemical activation phosphoric acid activation agent before applying both conventional heating (500 °C) and microwave heating (500 W) in succession | 791 | 148 mg g−1 for methyl blue dye | İzgi et al. 2018 (ref. 47) |
| Turkey | Chemical activation by a solution of ZnCl2 (30 wt%) and a carbonization at 850 °C under N2 flow (40 mL min−1) | 638 | 1.33 mg g−1 for methyl blue dye | Aygün et al. 2003 (ref. 49) |
| Iran | Microwave-assisted impregnation | 812 | — | Teimouri et al. 2019 (ref. 61) |
| Tunisia | Carbonization under carbon dioxide flow of 100 cm3 min−1 at 800 °C with chemical modification using NH3 | 414.78 | 78% | Omri et al. 2013 (ref. 48) |
3 Materials and methods
3.1 Materials
Almond shells were collected from an industrial unit in the Fez region of Morocco, separated manually from their hull, washed, dried at 60 °C for 24 h, then crushed and sieved. A fraction between 3.15 and 1.25 mm in diameter was selected to be used in the production of activated carbon. Table 8 summarizes the physicochemical characteristics of the used almond shells.| Characteristics | Value |
|---|---|
| Moisture (% wt) | 8.82 ± 0.74 |
| Volatile matter (% wt) | 73.08 ± 0.66 |
| Ash (% wt) | 2.55 ± 0.21 |
| Fixed carbon (% wt) | 15.55 ± 0.44 |
| Extractives (% wt) | 12.64 ± 0.52 |
| Lignin (% wt) | 27.51 ± 0.58 |
| Hemicellulose (% wt) | 26.73 ± 1.38 |
| Cellulose (% wt) | 30.94 ± 0.23 |
3.2 Methods
| Factor | Designation | Levels | ||
|---|---|---|---|---|
| 1 | 2 | 3 | ||
| Heat treatment temperature (°C) | B1 | 200 | 420 | |
| Heat treatment time (min) | B2 | 120 | 240 | |
| Suction pressure (bar) | B3 | −0.2 | −0.8 | |
| Chemical treatment time (min) | B4 | 60 | 180 | |
| Chemical treatment temperature (°C) | B5 | 20 | 80 | |
| Chemical activator percentage (%) | B6 | 5 | 20 | |
| Chemical activation step | B7 | Before | After | Without |
| Chemical activator type | B8 | KOH | H3PO4 | HCl |
Response surface methodology allows the defining of the optimal experimental conditions to achieve a maximum adsorption rate (high iodine index). The chosen design is a central composite with k factors, which comprises Nf tests of a complete factorial design 2k, NA star tests on the axes, and N0 central tests.25
The regression (eqn (2)) is expressed by the second order polynomial model:
 | (2) |
The iodine index, expressed in mg g−1, is the amount of iodine (in mg) adsorbed by 1 g of the activated carbon in a 0.02 N aqueous solution of I2. This index describes the accessibility of any particle of size less than or equal to that of the molecule I2. Its determination was carried out according to the CEFIC 1989 method and AWWA B604-76 standard.21
0.2 g of powdered prepared activated carbon was dispersed in 20 mL of a solution of I2 (0.02 N). The mixture was stirred for 4 to 5 min, filtered, and then examined with a 0.1 N sodium thiosulfate solution (Na2S2O3). The iodine index QI2 was calculated using the following eqn (3)
 | (3) |
The adsorption capacity qe (mg g−1) and percent removal (% R) of the dye were calculated using eqn (4) and (5)
 | (4) |
 | (5) |
3.2.4.1 Kinetic models of adsorption. The kinetics of adsorption was studied using two models, namely, pseudo-first-order28 and pseudo-second order.29 The conformity of the experimental data with the predicted values by the applied models was expressed by the fitted correlation coefficients (Rajd2) and the probability value (pvalue).
• The pseudo-first order model is expressed by eqn (6)
 | (6) |
• The pseudo-second order model is expressed by eqn (7)
 | (7) |
3.2.4.2 Modeling of adsorption isotherms. The adsorption isotherm is used to describe the equilibrium distribution of the dye between the solid and liquid phases at a given temperature when equilibrium is reached. Langmuir and Freundlich isotherms were applied to fit the equilibrium data 9. Each isotherm is expressed by relative constants that characterize the surface properties and indicate the adsorption capacity of the material.30
3.2.4.2.1 Langmuir isotherm. Langmuir isotherm model assumes that the adsorption is monolayer and occurs at the surface of the solid with identical homogeneous sites.31 It also suggests that no further adsorption takes place once the active sites are covered with dye molecules. The saturated Langmuir isotherm is represented by eqn (9)59
 | (8) |
3.2.4.2.2 Freundlich isotherm. The Freundlich isotherm is an empirical model assuming that the thermal distribution on the surface of the adsorbent is non-uniform, corresponding to heterogeneous adsorption.32 It is expressed by eqn (9)
 | (9) |
4 Conclusion
The use of the almond shells as a precursor for the production of activated carbon by chemical activation using H3PO4 before physical treatment under vacuum is an eco-compatible method, where the aspired gases are condensed in distilled water to prevent their release into the environment. Their optimization by the experimental design methodology was carried out. The screening of eight parameters to test their influence on the developed process made it possible to select four factors that have a very significant influence on the quality of the activated carbon prepared. The optimization of these factors was carried out by fixing two qualitative factors in their optimum, namely, the chemical activation with H3PO4 before the physical treatment and by varying the two quantitative factors by a central composite design. A physical treatment temperature of 420 °C and a vacuum pressure of −0.8 bar were adopted and led to a maximum iodine value of about 824.85 mg g−1. Infrared spectroscopy reveals the presence of acid and phosphonates groups due to activation by H3PO4. X-ray diffraction shows a disorganized graphical structure, thermogravimetric analysis indicates significant thermal stability between 140 °C and 360 °C, scanning electron microscopy coupled to the EDX reveals an irregular and porous outer surface as well as the presence of carbon and oxygen and traces of phosphorus. The surface groups determined by the Boehm method are acidic with a pHpzc of 4.5. These characteristics are important indications of the effectiveness of this newly developed method. The kinetic and isotherm adsorption studies of crystal violet on the optimal activated carbon fits the pseudo-first-order model and the Freundlich isotherm model; thus, the predicted adsorption capacity is 364.27 mg g−1 at a pH of 5.Data availability
The datasets used and/or analyzed during the current study are available from the corresponding author upon reasonable request.Author contributionsHamza Boulika: conceptualization, visualization, data curation, investigation, methodology, writing – original draft preparation. Maryam El Hajam: visualization, writing—review & editing. Meryem Hajji Nabih: data curation, investigation. Noureddine Idrissi Kandri: conceptualization, formal analysis, methodology, data curation. Aziz Zaroual: writing – reviewing and editing, validation.
Conflicts of interest
The authors declare that they have no conflict of interest.References
- O. Ioannidou and A. Zabaniotou, Renewable Sustainable Energy Rev., 2007, 11, 1966–2005 CrossRef CAS.
- J. Zhao, L. Yang, F. Li, R. Yu and C. Jin, Carbon, 2009, 47, 744–751 CrossRef CAS.
- I. Martin-Gullon, J. P. Marco-Lozar, D. Cazorla-Amorós and A. Linares-Solano, Carbon, 2004, 42, 1339–1343 CrossRef CAS.
- Y. Chen, Y. Zhu, Z. Wang, Y. Li, L. Wang, L. Ding, X. Gao, Y. Ma and Y. Guo, Adv. Colloid Interface Sci., 2011, 163, 39–52 CrossRef CAS.
- J. Bedia, J. M. Rosas, D. Vera, J. Rodríguez-Mirasol and T. Cordero, Catal. Today, 2010, 158, 89–96 CrossRef CAS.
- S. Yorgun, N. Vural and H. Demiral, Microporous Mesoporous Mater., 2009, 122, 189–194 CrossRef CAS.
- K. Li, Z. Zheng and Y. Li, J. Hazard. Mater., 2010, 181, 440–447 CrossRef CAS PubMed.
- M. Hajji Nabih, M. El Hajam, H. Boulika, Z. Chiki, S. Ben Tahar, N. Idrissi Kandri and A. Zerouale, Mater. Today: Proc., 2022, 1–11 Search PubMed.
- H. Boulika, M. El Hajam, M. Hajji Nabih, I. Riffi Karim, N. Idrissi Kandri and A. Zerouale, Mater. Today: Proc., 2022 DOI:10.1016/j.matpr.2022.07.358.
- M. Molina-Sabio, F. Rodríguez-Reinoso, F. Caturla and M. J. Sellés, Carbon, 1996, 34, 457–462 CrossRef CAS.
- K. le Van, T. L. T. Thu, H. N. T. Thu and H. van Hoang, Russ. J. Electrochem., 2019, 55, 900–907 CrossRef.
- T. Cordero-Lanzac, R. Palos, J. M. Arandes, P. Castaño, J. Rodríguez-Mirasol, T. Cordero and J. Bilbao, Appl. Catal., B, 2017, 203, 389–399 CrossRef CAS.
- J. Yang and K. Q. Qiu, Environ. Sci. Technol., 2009, 43, 3385–3390 CrossRef CAS.
- C. T. Nguyen, D. Tungtakanpoung, V. T. Tra and P. Kajitvichyanukul, Case Stud. Chem. Environ. Eng., 2022, 6, 100248 CrossRef CAS.
- M. H. Nabih, M. El Hajam, H. Boulika, M. M. Hassan, N. I. Kandri, A. Hedfi, A. Zerouale and F. Boufahja, Sustainability, 2021, 13905 CrossRef.
- S. Yorgun and D. Yıldız, J. Taiwan Inst. Chem. Eng., 2015, 53, 122–131 CrossRef CAS.
- Y. Chen, Y. Zhu, Z. Wang, Y. Li, L. Wang, L. Ding, X. Gao, Y. Ma and Y. Guo, Adv. Colloid Interface Sci., 2011, 163, 39–52 CrossRef CAS PubMed.
- L. Torbjorn, E. Seifert, L. Abramo, B. Thelin, A. Nystrom, J. Pettersen and R. Bergman, Handb. Environ. Chem., 1995, vol. 2, pp. 73–122 Search PubMed.
- R. W. Mee and J. L. Goupy, Methods for Experimental Design: Principles and Applications for Physicists and Chemists, Elsevier B.V., 1995, vol. 90 Search PubMed.
- J. E. Reece, S. N. Deming and S. L. Morgan, Am Stat, 1994, 48, 172 CrossRef.
- H. Rushing, A. Karl and J. Wisnowski, Handbook of Reading Research, 2016, pp. 63–90 Search PubMed.
- M. Molina-Sabio and F. Rodríguez-Reinoso, Colloids Surf., A, 2004, 241, 15–25 CrossRef CAS.
- J. Xu, L. Chen, H. Qu, Y. Jiao, J. Xie and G. Xing, Appl. Surf. Sci., 2014, 320, 674–680 CrossRef CAS.
- C. A. Toles, W. E. Marshall, M. M. Johns, L. H. Wartelle and A. Mcaloon, Bioresour. Technol., 2000, 71, 87–92 CrossRef CAS.
- H. Demiral, I. Demiral, F. Tümsek and B. Karabacakoǧlu, Surf. Interface Anal., 2008, 40, 616–619 CrossRef CAS.
- A. Tyagi, S. Banerjee, S. Singh and K. K. Kar, Int. J. Hydrogen Energy, 2019, 45, 16930–16943 CrossRef.
- E. Yagmur, M. Ozmak and Z. Aktas, Fuel, 2008, 87, 3278–3285 CrossRef CAS.
- R. A. Olivero, J. M. Nocerino and S. N. Deming, Handbook of Environmental Chemistry, 1995, vol. 2, pp. 73–122 Search PubMed.
- G. Socrates, Infrared and Raman Characteristic Group Frequencies Tables and Charts, John Wiley & Sons, New york, 1980, vol. 296 Search PubMed.
- A. S. Politou, C. Morterra and M. J. D. Low, Carbon, 1990, 28, 529–538 CrossRef CAS.
- M. el Hajam, N. Idrissi Kandri, A. Harrach, A. el khomsi and A. Zerouale, Mater. Today: Proc., 2019, 13, 803–811 CAS.
- A. S. Politou, C. Morterra and M. J. D. Low, Carbon, 1990, 28, 529–538 CrossRef CAS.
- A. M. Puziy, O. I. Poddubnaya, A. Martı, J. M. D. Tasco, A. Castro-Mun and F. Sua, Carbon, 2007, 45, 1941–1950 CrossRef CAS.
- K. Bilba and A. Ouensanga, J. Anal. Appl. Pyrolysis, 1996, 38, 61–73 CrossRef CAS.
- G. Socrates, Infrared and Raman Characteristic Group Frequencies Tables and Charts, John Wiley & Sons, New york, 1980, vol. 296 Search PubMed.
- J. Zhang, Z. Zhong, H. Guo and X. Jiang, Preparation of Bamboo-Based Activated Carbon, 2010 Asia-Pacific Power and Energy Engineering Conference, 2010, pp. 1–4 Search PubMed.
- R. M. M. dos Santos, R. G. L. Gonçalves, V. R. L. Constantino, C. V. Santilli, P. D. Borges, J. Tronto and F. G. Pinto, Appl. Clay Sci., 2017, 140, 132–139 CrossRef.
- M. el Hajam, N. Idrissi Kandri and A. Zerouale, Moroccan J. Chem., 2019, 7, 431–435 CAS.
- R. Ahmad, J. Hazard. Mater., 2009, 171, 767–773 CrossRef CAS PubMed.
- A. Mittal, J. Mittal, A. Malviya, D. Kaur and V. K. Gupta, J. Colloid Interface Sci., 2010, 343, 463–473 CrossRef CAS PubMed.
- Y. C. Sharma, Uma and S. N. Upadhyay, Can. J. Chem. Eng., 2011, 89, 377–383 CrossRef CAS.
- M. el Hajam, N. Idrissi Kandri, A. Harrach, A. el khomsi and A. Zerouale, Mater. Today: Proc., 2019, 13, 812–821 CAS.
- Y. S. Ho, J. Hazard. Mater., 2006, 136, 681–689 CrossRef CAS PubMed.
- Z. Hussain, R. Kumar and D. Meghavathu, Int. J. Eng. Technol., 2018, 7, 284–287 CrossRef CAS.
- M. Kashif Uddin, A. M. Nurul Najwa, A. H. Jawad and S. Sabar, Int. J. Phytorem., 2022 DOI:10.1080/15226514.2022.2086214.
- A. Rafiee, S. Ghanavati Nasab and A. Teimouri, Int. J. Environ. Anal. Chem., 2020, 100, 1624–1649 CrossRef CAS.
- M. S. İzgi, C. Saka, O. Baytar, G. Saraçoğlu and Ö. Şahin, Anal. Lett., 2019, 52, 772–789 CrossRef.
- A. Omri, M. Benzina and N. Ammar, J. Ind. Eng. Chem., 2013, 19, 2092–2099 CrossRef CAS.
- A. Aygün, S. Yenisoy-Karakaş and I. Duman, Microporous Mesoporous Mater., 2003, 66, 189–195 CrossRef.
- R. L. Mason, Statistical Design and Analysis of Experiments With Applications to Engineering and Science Second Edition, John Wiley & Sons Publication, John Wiley Sons, 2003 Search PubMed.
- Comm Rep, J.–Am. Water Works Assoc., 1974, 66, 672–681 CrossRef.
- C. Pechyen, D. Atong, D. Aht-ong and V. Sricharoenchaikul, J. Solid Mech. Mater. Eng, 2007, 1, 498–507 CrossRef.
- M. Trachi, N. Bourfis, S. Benamara and H. Gougam, Biotechnol., Agron., Soc. Environ., 2014, 18, 492–502 Search PubMed.
- S. Yorgun and D. Yildiz, J. Taiwan Inst. Chem. Eng., 2015, 53, 122–131 CrossRef CAS.
- J. S. Noh and J. A. Schwarz, J. Colloid Interface Sci., 1989, 130, 157–164 CrossRef CAS.
- H. P. Boehm, Carbon, 1994, 32, 759–769 CrossRef CAS.
- Y. S. Ho and G. McKay, Process Biochem., 1999, 34, 451–465 CrossRef CAS.
- M. el Hajam, N. I. Kandri, A. Harrach and A. Zerouale, Stud. Cercet. Stiint.: Chim. Ing. Chim., Biotehnol., Ind. Aliment., 2019, 20, 395–409 CAS.
- I. Langmuir, J. Am. Chem. Soc., 1918, 40, 1361–1403 CrossRef CAS.
- H. Freundlich and H. Wilpried, J. Am. Chem. Soc., 1939, 61, 2228–2230 CrossRef CAS.
- Z. Teimouri, A. Salema and S. Salem, J. Environ. Chem. Eng., 2019, 7, 103161 CrossRef CAS.
| This journal is © The Royal Society of Chemistry 2022 |

