 Open Access Article
Aqueous/non-aqueous electrolyte tradeoffs in charge transfer and electrochromics of pseudocapacitive oxide films
Tinsley Elizabeth Benhaddouch ,
Shekhar Bhansali and
Dongmei Dong
 *
*
Department of Electrical and Computer Engineering, Florida International University, Miami, Florida, USA. E-mail: ddong@fiu.edu
First published on 1st November 2022
Abstract
Environmental sustainability, safety, cost, and performance are the driving metrics for modern technological developments. Progress in these realms has been made for electrochromic (EC) devices by optimizing anode/cathode electrode materials. Yet, by these standards, the role of the electrolyte has remained unexplored. This investigation on charge transfer mechanisms at the electrolyte/electrode interface facilitates a contrast of the aqueous and non-aqueous electrolytes studied. A classic EC, high-performing, non-aqueous, lithium chlorine oxide in propylene carbonate (PC-LiClO4) is examined against a non-flammable, low reactive, cost-effective, aqueous, potassium hydroxide (KOH) electrolyte; to strengthen the understanding of electrochromics the electrolytes are referenced against the anodic EC nickel oxide (NiO) thin films. The KOH presents as a diffusion dominant response, supported by the findings of the cyclic voltammetry and electrochemistry impedance data (b = 0.56, 45°∠), respectively, compared to the more surface capacitive PC-LiClO4 (b = 0.68, 60°∠). Interestingly, despite the KOH full redox potential window being half the PC-LiClO4, the KOH system's current density reached more than 3 times higher than PC-LiClO4. Additionally, realizing the same current density (2 mA cm−2) in multi-step chronoamperometry, the required potential is ∼5 times lower for KOH than for PC-LiClO4 electrolyte, albeit the KOH has a longer response time. Inherent tradeoffs in the systems are considered for theoretical analysis of these phenomena, i.e., molar mass, ionization energy, viscosity, etc. The chemical nature of the electrolyte shows a profound effect on electrochemical kinetics at the NiO/electrolyte interface, pointing to the significance of all aspects in an electrochemical cell. The coupled effect of the electrolyte composition/electrode material pairing dictates the charge-storage mechanisms (and subsequently, EC properties). Furthermore, knowledge of contrasts in electrolyte type is of great interest to the scientific community for the modern metric-based optimizations of many other clean energy systems.
Introduction
Electrochromic (EC) devices have promising applications such as modern windows for enhanced climate control1 by reducing A/C use supporting energy-waste reduction and glare-free rear-view mirrors for better night vision and road safety.2 The coupled optical modulation and charge storage capacity could even be leveraged for energy storage devices with a visualized state of charge.3 For any of these applications, a key concern among the many design metrics is reducing the unit cost while retaining performance and environmental sustainability. To design according to these metrics, we must carefully consider every individual component of the device.The full device is a sandwich structure: substrate/conductor/anodic-thin-film/electrolyte/cathodic thin film/conductor. Transparent substrates such as glass or PET (polyethylene terephthalate) are important to allow the visibility of the optical properties of the EC films. Likewise, the transparency of the conductive layer is just as critical so ITO (indium tin oxide) or FTO (fluoride tin oxide) are suitable for this layer (although a more flexible alternative would be beneficial to the scientific community). To achieve optimal EC optics a cathodic thin film such as tungsten oxide (WO3) needs to be paired with an anodic thin film such as nickel oxide (NiO). This is because the cathodic thin films color under charge insertion, and the anodic thin films color under charge extraction. Therefore, both sides will color simultaneously, therefore the entire device will be in a uniform state (colored or bleached). Most of the current research on EC oxides is limited to cathodic WO3; however, the EC mechanisms in anodic NiO remain less explored and are unclear at present, especially the interaction between ionic species in electrolytes and electrodes, which points a direction to this study. To decouple the contributions of the anodic thin films from the full device structure we carried out this investigation in the half-cell configuration: substrate/conductive layer/anodic thin film in the electrolytes of interest. Considering the design metrics, NiO is an optimal anodic film because of its elemental abundance on earth4 and ultra-low cost5 compared to other anodic films, e.g., iridium oxide6 or cobalt oxide.7
The challenge of nickel oxide is its large optical modulation and high cycle life. To date, such studies focus on electrode materials; for example, electrodes have been optimized by material selection, nanostructuring,8 doping to tune the work functions,9 novel fabrication methods,10 or device configurations.11 It has been stated that the structural properties is related to the functional (electrochromic, electrical, durability) of the films.12 Yet, when considering all the components in either a full-cell or half-cell configuration, the electrolyte is clearly essential and must also play a role in these functional properties of the system. Since the discovery of the first EC device by Deb13,14 in 1969, various electrolytes have been tested for EC compatibility as outlined by Ding et al.15 in the comprehensive review. Although recent interest is geared toward polymerized electrolytes, modern methods exist to transform traditional liquid electrolytes into suitable quasi-solid gel polymer electrolytes. The comparison of the liquid vs. gel versions of the same electrolytes demonstrates a comparable performance in cyclic voltammetry with an increase in cycle stability for the gel version.16 Therefore, investigating the performance and charge storage mechanisms of liquid electrolytes is still relevant and insightful toward the fundamental understanding of the electrolytes and ultimately device commercialization. We acknowledge the pioneering work of Chen et al., who studied electrolyte properties via the concentrations and doping ratios (e.g., to improve the solubility of salts in organic solvents).17 And of the work by Stenman whose work investigated electrolytes as a function of anion and cation for the optical transmittance, absorbance, color efficiency, and cycling stability.18 To supplement their efforts, this work takes a focal consideration on electrolytes: that a switch in electrolytes would effectively change the electrochemical kinetics and overall response of electrochemical systems.
The creativity of this work lies in setting the spotlight on the electrolyte's role in the charge transfer process. To approach the critical challenge of optimizing the EC system for both optical modulation and cyclability, efforts are made to distinguish the charge transfer characteristics in two specially selected electrolytes with different working mechanisms and different functional properties. On this premise and expanding upon the work of those before, we select the lithium-based electrolyte PC-LiClO4 selected for great compatibility with both NiO and WO3 electrodes19 and the protonic-based electrolyte KOH (selected for demonstrating the broadest optical modulation, charge storage, and cycle durability for NiO films). A second major challenge with full-device compatibility is that some of the most anodically compatible electrolytes such as KOH show little compatibility to cathodic electrodes.20 Therefore, understanding the charge storage mechanisms in high-performing NiO-compatible electrolytes can then be used to tailor electrolytes that will also be compatible with the WO3 electrode, while still maintaining optimal anodic performance functionalities.
As we theorize which additional features of the electrolyte impact the functional properties of the system, we employ the concept of tradeoff theory (common in the engineering disciplines). There are always tradeoffs, i.e., compromises made to optimize the system for a certain perceived benefit: cost, environmental considerations, performance, durability, and bio-interfacing, to name a few. To determine the ideal electrolyte optimal for ionic conductivity and electrochromism (i.e., optimized for performance), we consider tradeoffs within the electrolyte. For instance, Xu et al.21 stated that good ion conductivity should result from a compromise between a high degree of dissociation and low mobility. Another tradeoff reported by Chen et al.22 is between a high quantity of free ions and the mobility of ionic carriers. This work investigates the effect of water-based and organic solutions with the selected aqueous KOH and non-aqueous PC-LiClO4 with a tradeoff concept, with consideration of the role the ions (OH−, Li+) play in the electrochemical systems. Comparing the KOH to LiClO4, their ionization energy, and electron affinity will affect the dissociation, and the molar mass will make a difference in the mobility of the ion carriers in the electrolyte. The viscosity of the aqueous vs. non-aqueous electrolytes also changes ion mobility. The coupling effect of the electrolyte composition and electrode materials determines the charge-storage mechanism and EC properties and is not negligible for accomplishing extraordinary electrochemical performance for most other clean energy systems (fuel cells, solar cells, electrolyzers, etc.).
Results and discussion
Electrochromic properties
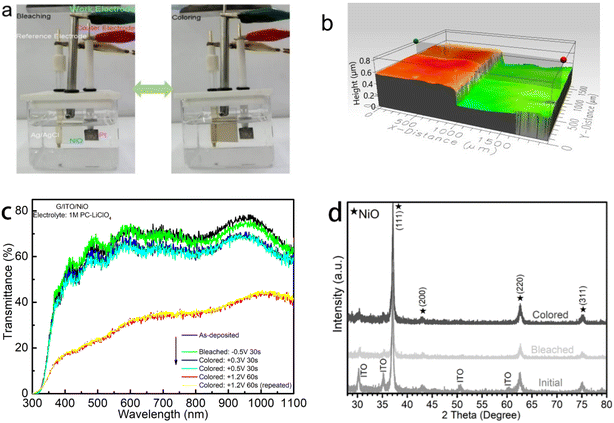
The EC optical properties of the NiO thin films are as demonstrated in Fig. 1. The EC NiO is capable of changing color within the visible spectrum, observable to the naked eye. The change in optical transmittance is a response to the positively and negatively applied voltages in the three-electrode system and the subsequent Li insertion/extraction (Fig. 1a). These optical changes can function as a visible representation of the energy storage/release, for example, we can observe the “partially colored” colored region in Fig. 1a is less intense comparing to the fully saturated state. The colored state in Fig. 1a is partially colored because the voltage applied is less than the voltage applied to achieve the “fully” colored state. This is further demonstrated in Fig. 8a. Extending beyond the qualification from visible observations we quantify these observations via optical transmittance spectra as shown in Fig. 1c. The NiO film does not approach 100% transmittance; the highest transmittance reached is approximately 80% around the 600 and 950 nm wavelengths for the most bleached state at −0.5 V potential. Additionally, for the most colored state at the +1.2 V potential, the transmittance trends up from about 15% to 35% in the visible spectra and continues to higher transmittance approaching the 1000 nm wavelength. Another observation is the repeatability of the response from the positive applied voltage for the most colored state shown in the nearly overlapping lowest transmission lines represented by the yellow and pink curves on the graph. This repeatability demonstrates stability which is promising for NiO and is consistent with the theory of the repeatability of the second of the two-stage processes proposed by S. Passerini and B. Scrosati.23 Once the NiO is activated, the Li insertion into the NiO is easier to repeat. This is because there is a strong initial activation energy for the EC properties of the NiO film in this PC-LiClO4 electrolyte as described by Wen et al.20 in their comparison of the inserted charge vs. the extracted charge as a function of cycle.Surface imaging and the EC NiO film thickness of ∼350 nm are shown in Fig. 1b. X-ray Diffraction (XRD) has been carried out to investigate the structural changes of the thin film in the EC process (Fig. 1d). We see the regions of preferential NiO growth in the (111) planar direction. Compared to the initial state in the XRD image, there appears to be no significant changes in the overall structure as it switches to the colored or bleached states. Additionally, we see a very slight peak shift right in the (111) planar direction in bleaching but shifts back left in the colored state. These slight, reversible changes could be indicative of the ion insertion-induced stress in NiO films.
Distinct charging mechanisms for aqueous/non-aqueous environments
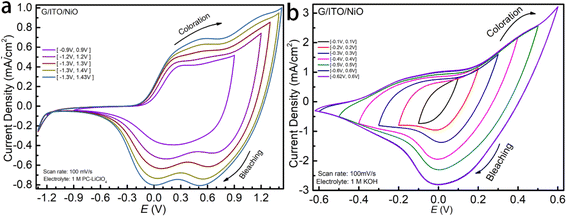
To comprehensively study the pseudocapacitive charge storage of the NiO film as well as the electrochemical kinetics, we start the cyclic voltammetry (CV) cycling of NiO in 1 M LiCIO4-PC at smaller potential windows and increase it until the redox peaks are complete for NiO, as shown in Fig. 2a. At the narrow potential windows, a peak centered around +0.3 V relates to the coloration. As the potential windows expand, this peak broadens and shifts towards the right, settling at +0.5 V. Initially, no peaks corresponding to the bleaching process show up in the smaller potential window; however, at the optimal potential window, two distinct peaks are observed around +0.5 V and 0 V. These peaks are broader at smaller potential windows and become narrower and more distinct as the potential window expands. Fig. 2b shows NiO films' electrochemical properties that allow easy comparison between 1 M KOH and 1 M LiClO4. The shape of the CV curves indicates that the electrochemistry for the charge insertion/extraction is different in Li-PC and KOH. As a result, the charge capacity, represented by the area cycled by the CV curve is significantly higher in KOH aqueous electrolyte. The overall shape of NiO in both of the two electrolytes corresponds to typical pseudocapacitive behaviors with broad oxidation and reduction features appearing. However, a multi-step electrochemical process in the Li-PC is reflected by more than one redox peak. Due to the fast electrochemical response, the parameters of the CV experiments were run at relatively fast scan rates, Fig. 3a and c starting from 200 to 50 mV s−1. We observe the highest current densities below +1.5 mA cm−2 in the potential window [−1.2 V, +1.3 V]. Interestingly, we see a vastly different response of NiO in the 1 M KOH. The optimal potential window allowing the full intercalation/de-intercalation is much narrower at a potential window of [−0.45, +0.45 V], whereas for 1 M LiCIO4-PC the potential window is up to [−1.2 V, +1.3 V]. The KOH results in much higher current densities (about 1.2 mA cm−2 and 3.5 mA cm−2) compared to the NiO in the LiCIO4-PC with a current density of 1.0 mA cm−2 and 1.5 mA cm−2. As you can see the KOH electrolyte is reaching nearly twice the peak current density as the Li-electrolyte with half of the applied potential window. There is no need to increase the potential window for the KOH any further for this study. This effect is explained by the ion insertion mechanism of the electrolytes (which will be discussed in further detail).
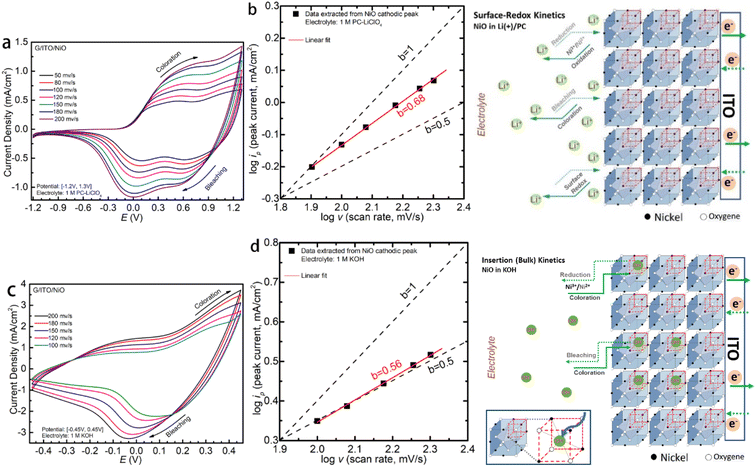
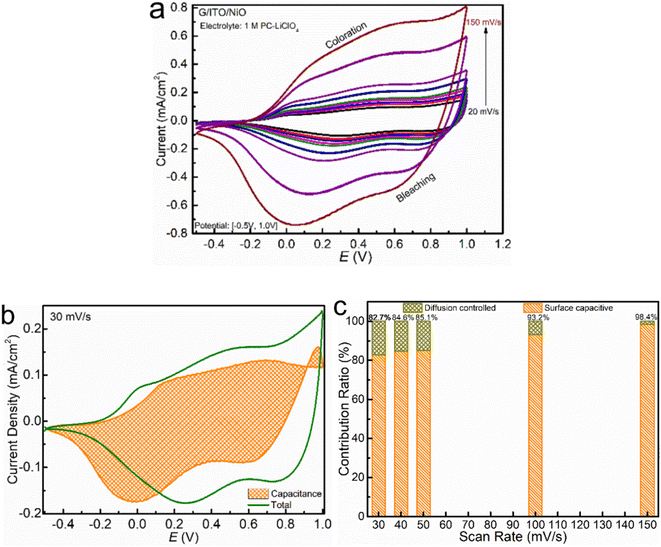
Multiple scan rates CV have been conducted to reveal the charge transfer kinetics, as shown in Fig. 3a and c. To quantitively distinguish the faradaic and capacitive behavior of the NiO in the two electrolytes, we employ the log![[thin space (1/6-em)]](https://www.rsc.org/images/entities/char_2009.gif) iP vs. log
iP vs. log![[thin space (1/6-em)]](https://www.rsc.org/images/entities/char_2009.gif) v analysis25 as plotted in Fig. 3b and d for the LiCIO4-PC and KOH, respectively. v is the scan rate, and a and b are interchangeable values. To interpret these data sets, b = 1.0 corresponds to a capacitive-like, surface-dominant response, whereas b = 0.5 is a diffusion-controlled response. Applying this, we confirm that the fitted b values of NiO in the LiCIO4-PC, being about b = 0.68, demonstrate a diffusion-dominant and capacitive-like behavior through the processes. Comparatively, the nickel oxide in KOH has a fitted b value at approximately b = 0.56, which denotes a significantly more diffusion-controlled process with the slightest deviance towards a capacitive-like response. log
v analysis25 as plotted in Fig. 3b and d for the LiCIO4-PC and KOH, respectively. v is the scan rate, and a and b are interchangeable values. To interpret these data sets, b = 1.0 corresponds to a capacitive-like, surface-dominant response, whereas b = 0.5 is a diffusion-controlled response. Applying this, we confirm that the fitted b values of NiO in the LiCIO4-PC, being about b = 0.68, demonstrate a diffusion-dominant and capacitive-like behavior through the processes. Comparatively, the nickel oxide in KOH has a fitted b value at approximately b = 0.56, which denotes a significantly more diffusion-controlled process with the slightest deviance towards a capacitive-like response. log![[thin space (1/6-em)]](https://www.rsc.org/images/entities/char_2009.gif) iP = b × log
iP = b × log![[thin space (1/6-em)]](https://www.rsc.org/images/entities/char_2009.gif) v + log
v + log![[thin space (1/6-em)]](https://www.rsc.org/images/entities/char_2009.gif) a. The surface-redox and insertion (bulk) kinetics mechanism are proposed for NiO in non-aqueous Li-PC and aqueous KOH electrolytes. Correspondingly, the mechanisms are also proposed for Li-PC and KOH, respectively. For the functional cations Li+, the surface capacitive redox is dominant, while it is ion-insertion (bulk) into the NiO face-center-cubic as dominant kinetics for the functional anions OH−.
a. The surface-redox and insertion (bulk) kinetics mechanism are proposed for NiO in non-aqueous Li-PC and aqueous KOH electrolytes. Correspondingly, the mechanisms are also proposed for Li-PC and KOH, respectively. For the functional cations Li+, the surface capacitive redox is dominant, while it is ion-insertion (bulk) into the NiO face-center-cubic as dominant kinetics for the functional anions OH−.
![[thin space (1/6-em)]](https://www.rsc.org/images/entities/char_2009.gif) iP vs. log
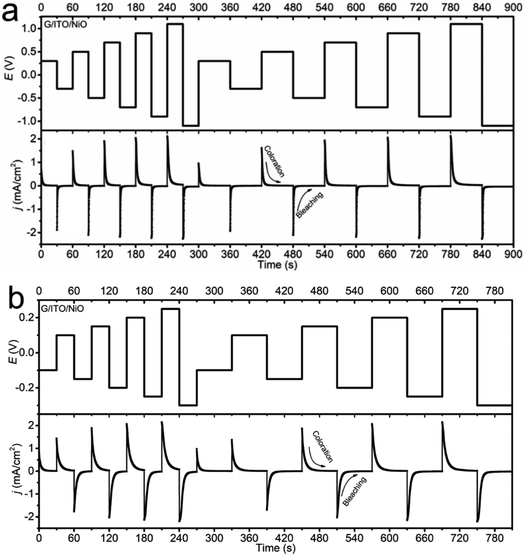
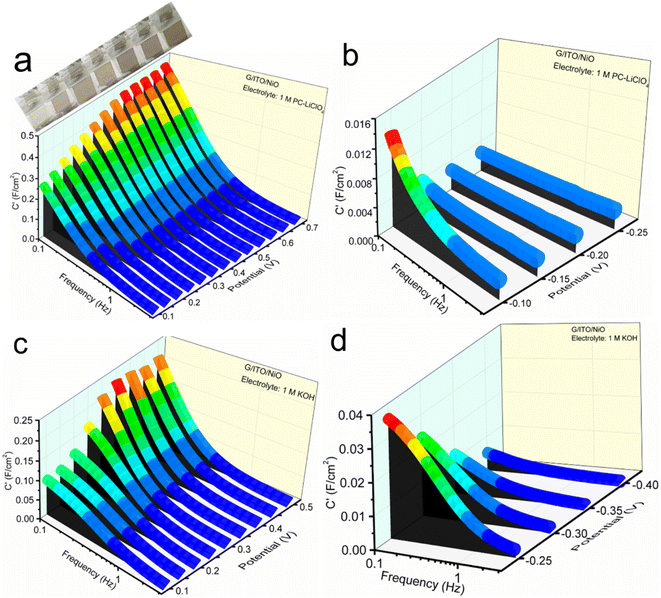
iP vs. log![[thin space (1/6-em)]](https://www.rsc.org/images/entities/char_2009.gif) v plot of NiO in KOH being more diffusion-dominant relative to the PC-LiClO4. Especially significant to note is that the current density in the KOH can reach a peak current density of 2 mA cm−2 at a small driving potential of 0.2 V, whereas to reach the same peak current density of 2 mA cm−2 using the PC-LiClO4 required a 5 times higher potential of 1.0 V. It is noteworthy that the response differs between the two electrolytes, consistent with the 3D Bode plot results. In KOH, the response for coloration and bleaching is more equal, while it is much faster in bleaching in Li-PC. This is also a very interesting part of the study which speaks again toward the diffusion dominant vs. capacitive dominant response, dependent on the electrolyte. With the KOH we see that the coloration process and the bleaching process are more symmetrical to each other and overall, both slower than the Li-PC electrolyte. This corresponds to the diffusion-controlled kinetics for charge insertion and extraction. On the other hand, the Li-PC coloration is surface capacitive dominant, comparable to a true capacitor. Therefore, as the PC-Li demonstrates the pseudocapacitive response we expect a very fast bleaching process, again comparable to the fast discharge rate of a capacitor. The response of pseudocapacitive systems vs. diffusion-controlled systems correspond well with literature. Shao et al. investigates a pseudocapacitive film where a fast response time is evident27 and Klymenko et al.28 investigates a diffusion dominant system where we see the symmetry and slower response times This is quite interesting, and more insights are obtained from the impedance studies in the subsequent section.
v plot of NiO in KOH being more diffusion-dominant relative to the PC-LiClO4. Especially significant to note is that the current density in the KOH can reach a peak current density of 2 mA cm−2 at a small driving potential of 0.2 V, whereas to reach the same peak current density of 2 mA cm−2 using the PC-LiClO4 required a 5 times higher potential of 1.0 V. It is noteworthy that the response differs between the two electrolytes, consistent with the 3D Bode plot results. In KOH, the response for coloration and bleaching is more equal, while it is much faster in bleaching in Li-PC. This is also a very interesting part of the study which speaks again toward the diffusion dominant vs. capacitive dominant response, dependent on the electrolyte. With the KOH we see that the coloration process and the bleaching process are more symmetrical to each other and overall, both slower than the Li-PC electrolyte. This corresponds to the diffusion-controlled kinetics for charge insertion and extraction. On the other hand, the Li-PC coloration is surface capacitive dominant, comparable to a true capacitor. Therefore, as the PC-Li demonstrates the pseudocapacitive response we expect a very fast bleaching process, again comparable to the fast discharge rate of a capacitor. The response of pseudocapacitive systems vs. diffusion-controlled systems correspond well with literature. Shao et al. investigates a pseudocapacitive film where a fast response time is evident27 and Klymenko et al.28 investigates a diffusion dominant system where we see the symmetry and slower response times This is quite interesting, and more insights are obtained from the impedance studies in the subsequent section.
Electrochemistry impedance spectroscopy (EIS)
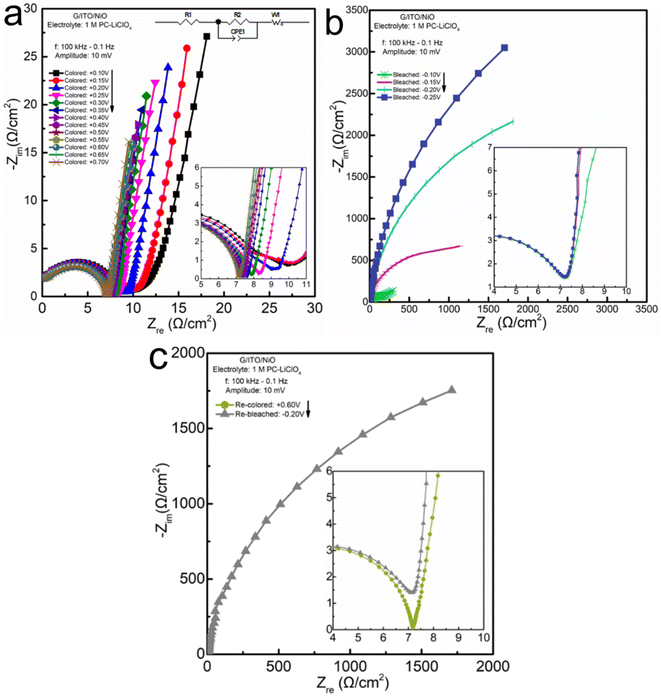
In addition to analyzing the lowest-frequency region in the EIS plot, we further analyze the full spectrum of EIS to determine if the overall response of the system is diffusion-controlled, capacitive-dominated, or pseudocapacitive. For example, if we only inspect the lowest frequency-data points the coloration process (Fig. 5a) shows an obvious linear progression of the data in the 90° angle direction. If we again, only look at the lowest frequency data in the bleaching process (Fig. 5b) it appears to be only in the 60° angle direction. However, as you can see clearly in the inset the process starts out towards the 90° angle direction (capacitive) and gradually shifts to the 60° angle direction (diffusion) as the frequency decreases.
Concluding the sequence of EIS investigations for the Li+ electrolyte, we look into a single re-colored and a single re-bleached potential shown in Fig. 5c. It gives insight into three facets: first, the response in a repeated aspect; second, the response of the instantly applied extreme potential, rather than the gradual progressions: and third a side-by-side comparison of the color vs. bleaching complex impedance responses. Comparing the colored at +0.6 V (Fig. 5a) with the re-colored at +0.6 V (Fig. 5c), we can see that the impedance on the right of the semi-circle denoting the end of the charge transfer resistance intercepts the x-axis at Zre ≅ 7 Ω cm−2 for both the color and re-color data plots. Additionally, the colored and re-colored tails are inclined towards the same angle at the figure insets. Ultimately, there appears to be no significant difference in the impedance responses of the system when the voltage is gradually increased to the highest value vs. an instantaneously applied potential. There appears to be no significant difference between the initially colored and re-colored films showing a reliable impedance response. These conclusions also hold for the charge transfer resistance region of the initially bleached and re-bleached. There also appears to be no significant difference comparing the semi-circle of the gradual bleaching to the directly bleached process; nor a significant difference between charge transfer resistance for the initially bleached and re-bleached, showing stability in this regime. We can also observe the pseudocapacitive behavior for direct bleaching compared with the gradual bleaching, although the imaginary impedance does appear to be slightly lower in the direct bleaching Warburg tail, which indicates a slight decrease in the capacitive reactance that occurs in the gradually applied potential process. This could be due to the residual charge in the film occurring during the gradual bleaching process.
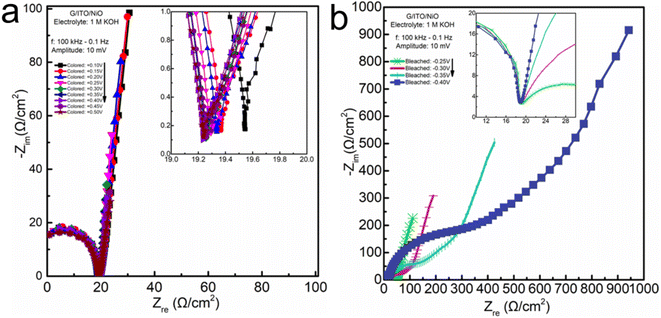
Interestingly, despite demonstrating such a higher complex impedance, the decrease in charge transfer resistance in the KOH electrolyte was less than a 0.4 Ω cm−2 shift from ≅19.6 down to ≅19.2 Ω cm−2. Yet, for the same potentials (+0.1 and +0.5 V) in the PC-LiClO4 with significantly lower overall complex impedance, the decrease in charge transfer resistance was much higher, around 3 Ω cm−2 shift from ≅10.5 down to ≅7.5 Ω cm−2. The similarity between the KOH and PC-LiClO4 is that the Warburg tail is more capacitive, inclining in the capacitive-denoting 90° angle direction through the coloration process. The coloration process occurs during the removal of electrons and Li+ from the NiO film. De-insertion of Li+ from thin films tends to consistently reflect capacitive behavior. The more interesting aspects of the impedance are in the bleaching of the NiO film corresponding to the insertion of electrons and Li+ into the NiO thin films. The bleaching process of the KOH demonstrates a much stronger preference for a diffusion-controlled response as the frequencies that make up the Warburg tail gravitate more strongly toward the diffusion-denoting 45° angle (i.e., frequency to frequency comparison) to the overall response of the PC-LiClO4 Warburg tail region. To reiterate, EIS analysis cannot be limited to the single lowest frequency of the EIS response to determining the angle inclination reflecting diffusion, capacitive, or pseudocapacitive dominated responses, but rather take into consideration the entire spectrum making up the Warburg tail.
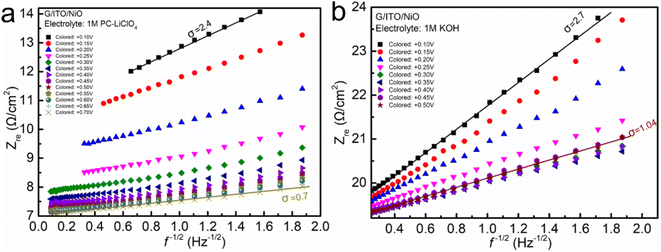 | ||
| Fig. 7 Warburg factor based on the linear fits of Zre against f−1/2 of NiO in non-aqueous Li+-based and aqueous KOH electrolytes. | ||
To obtain enhanced capacity, fast response, and improved electrochemical attributes, the inherent properties of the system, i.e., molar mass, electron affinity, ionization energy, electronegativity, viscosity, etc., have been taken into consideration, and the two electrolytes have been compared comprehensively (Tables 1 and 2). The chemical nature of the electrolytes shows a profound effect on electrochemical kinetics of EC NiO films. Based on the tradeoffs in this work, lower electron affinity, ionization energy, and viscosity are likely to be favorable for the ion diffusion and insertion into the NiO electrode.
| Properties | Non-aqueous PC-LiClO4 | Aqueous KOH |
|---|---|---|
| Molar mass | LiClO4 = 106.39 g mol−1 | KOH = 56.11 g mol−1 |
| Electron affinity | EA (ClO4) = 5.25 eV | EA(K) 0.50163 eV |
| Ionization energy | IE (L) = 5.3917 eV | IE (OH) 13.017 eV |
| Bandgap | 5.74 eV | 3.64 eV |
| Energy above Hull | 0.000 eV per atom | 0.002 eV per atom |
| Density | 2.42 g mL−1 | 1.05 g mL−1 |
| Viscosity of solvent (cps) | PC = 2.4 | H2O = 1 |
| Characterizations & analysis | Non-aqueous PC-LiClO4 | Aqueous KOH |
|---|---|---|
| Charge transfer resistance (EIS) | Low | High |
| Capacity (CV) | Low | High |
| Driving potential for 2 mA cm−2 (MSCA) | 1.0 V | 0.2 V |
Linear fitting of log![[thin space (1/6-em)]](https://www.rsc.org/images/entities/char_2009.gif) iP vs. log iP vs. log![[thin space (1/6-em)]](https://www.rsc.org/images/entities/char_2009.gif) v (CV) v (CV) |
b = 0.68 (pseudocapacitive) | b = 0.56 (diffusion) |
| Warburg region (EIS) | ≅60° ∠ (pseudocapacitive) | ≅45° ∠ (diffusion) |
What is unexpected and quite interesting is that the aqueous KOH showing higher capacity and ion-insertion (bulk) behavior is found to have a higher charge transfer resistance than the Li-PC. This is interesting and unusual; we generally expect that a lower charge transfer resistance is accompanied by a higher charge storage capacity. For example, Nara et al. Shows a systematic comparison of capacity vs. EIS in lithium batteries. Consistently when you see a decrease in Rct there is a corresponding increase in capacity.33 Again, in a study conducted by Hang et al. we see as the capacity decreases so the charge transfer resistance increases.34 However, in this study we see the charge transfer resistance for KOH is nearly 20 ohms and the PC-LiClO4 is only 7 ohms. So, we would expect the KOH to have less capacity compared to the PC-LiClO4 but this is not the case. This abnormally points to that the lower charge transfer resistance is not necessarily correlated with higher charge storage capacity when we compare the surface-capacitive dominant and ion-diffusion controlled processes. The coupling effect of the functional cations/anions in electrolyte and electrode materials is not negligible to accomplish enhanced fast charge storage for most sustainable electrochemical energy systems.
Conclusion
In this exhaustive investigation, we demonstrate electrolyte plays a critical role in the EC NiO charge storage electrochemical system. The working mechanism of different electrolytes toward NiO electrodes is also different, which largely determined the electrochemical behaviors. The electrochemical kinetics and charge transfer in two electrolyte solutions are compared: aqueous KOH and non-aqueous PC-LiClO4, which are evaluated for their effect on the electrochemical response of NiO thin films. The techniques implemented for this comprehensive analysis include CV, MSCA, and EIS techniques. It is found that the PC-LiClO4 electrolyte provides capacitive dominant traits in NiO, while the KOH electrolyte presents battery-dominant performance. Despite the constant working electrode and all other parameters being maintained, the aqueous KOH electrolyte exhibits much higher current densities and capacities with less driving potential and faster response, resulting from the ion-diffusion versus surface capacitive controlled kinetics. The mechanism for the electrochromism of NiO and how the interface kinetics are very different in anions (OH−) and cations (Li+) based electrolytes have been compared in KOH vs. PC-LiClO4. The interaction of NiO electrode and functional ions from electrolytes at interface mainly determines the charge transfer kinetics and electro-optical performance in the system. Several inherent tradeoffs have been considered in the electrolyte, including electron affinity, electron negativity, viscosity, etc. The coupling effect of the electrolyte and electrode materials is a key factor for the charge-storage mechanism and EC properties. Further investigation is recommended for accomplishing extraordinary electrochemical performance for EC devices and most other sustainable energy systems.Experimental
Deposition of NiO thin films
The reactive direct current magnetron sputtering deposition method was implemented as the NiO thin solid film fabrication process. Essential for the thin film deposition is the round Ni target (purity: 99.99%, diameter: 50.08 mm, thickness: 6.35 mm) and a gaseous atmosphere consisting of Ar (purity: 99.99%) and O2 (purity: 99.99%) at a ratio of 5![[thin space (1/6-em)]](https://www.rsc.org/images/entities/char_2009.gif) :
:![[thin space (1/6-em)]](https://www.rsc.org/images/entities/char_2009.gif) 4 respectively. The pressure at deposition was 3.5 Pa. Power was set at 200 W, and the substrate for deposition was a commercialized transparent conductive indium tin oxide (ITO, square resistance Rs: 30 ohms, thickness: 100 nm) on glass. After deposition, the NiO film thickness was measured by the optical profilometer to be ≅350 nm.
4 respectively. The pressure at deposition was 3.5 Pa. Power was set at 200 W, and the substrate for deposition was a commercialized transparent conductive indium tin oxide (ITO, square resistance Rs: 30 ohms, thickness: 100 nm) on glass. After deposition, the NiO film thickness was measured by the optical profilometer to be ≅350 nm.
Preparation of the electrolyte
The lithium perchlorate (LiClO4) powder (purity: 99+%, Thermo Scientific) and propylene carbonate (PC) liquid (purity: 99.5%, Thermo Scientific) were mixed and stirred for one hour and a half in ambient conditions to get a uniform, a transparent solution with one molar per liter concentration, namely, 1 M PC-LiClO4. The potassium hydroxide (KOH) powder (purity: 99+%, Thermo Scientific) and diluted water were mixed and stirred for one hour and a half in ambient conditions to obtain a uniform, transparent solution with one molar per liter concentration, namely, 1 M KOH.Characterizations
Structural characterizations were conducted for NiO thin films at each states: initial, bleached, and colored via the X-ray Diffractometer (Siemens Model: D 5000), which has an accuracy of ±005° and reproducibility of ±0.0005°. Surface imaging for step height thickness analysis was captured using the state-of-the-art three-dimensional optical profilometer (model: Profilm3D). To ensure a reliable image, the profilometer is stationed on a vibration-resistant table to circumvent the naturally occurring vibrations in the environment. The raw data is processed using the compatible “ProfilmOnline” software. The optical properties of the thin films were determined by using an ultraviolet-visible spectrophotometer (Thermo Scientific, Evolution 220) which features a larger rectangle with a 2 nm spectral bandwidth for enhanced photometric performance. All transmittance values in this work are referred to as the ITO-coated glass substrate at 100% transmittance.Electrochemical measurements
The electrochemical potentiostat/galvanostat (Metrohm, PGSTAT30 potentiostat) was the apparatus used to obtain the electrochemical data; cyclic voltammetry (CV), multi-step chronoamperometry (MSCA), and electrochemical impedance spectroscopy (EIS). This electrochemical station has a Potential accuracy of ±0.2% SCAN250, a Potential resolution of 0.3 μV ADC10M, Current accuracy of ±0.2% MUX and a Current resolution of 0.00039% (of current range) FI20. Zview software was used for EIS modeling. The experiments were all carried out as a three-electrode system: the working electrode being the NiO-ITO-glass fabricated as described above. The counter and reference electrodes were the platinum (Pt) wire and silver/silver chloride (Ag/AgCl), respectively. The results of the potentials documented in this work are hereby referenced against the Ag/AgCl. As described above, the experiments were designed to characterize and compare the two different electrolytes, 1 M PC-LiClO4, against 1 M KOH. Electrochemical characterizations start at smaller potential windows and increase until NiO's CV redox peaks are complete. Once the potential window was optimized, the NiO electrode with multiple scan rates was also investigated. Due to this EC film's fast response time, the CV experiments' parameters were run at relatively fast potential scan rates between (200 to 20 mV s−1).Conflicts of interest
The authors declare no conflict of interest.Acknowledgements
DOE-M2FCT supports this work under AWD000000013872 (LBNL No. 7621351). DOE-NNSA also supports this work funded under the minority-serving institutional partnership program (MSIPP) ASTERIX consortium under Award NA0003981.References
- M. A. Macêdo, L. H. Dall'Antonia, B. Valla and M. A. Aegerter, J. Non-Cryst. Solids, 1992, 147–148, 792–798, DOI:10.1016/S0022-3093(05)80718-5.
- F. G. K. Baucke, Sol. Energy Mater., 1987, 16(1–3), 67–77, DOI:10.1016/0165-1633(87)90009-8.
- P. Yang, P. Sun and W. Mai, Mater. Today, 2016, 19(7), 394–402, DOI:10.1016/j.mattod.2015.11.007.
- Rare Earth Elements Critical Resources for High Technology|USGS Fact Sheet 087-02, https://pubs.usgs.gov/fs/2002/fs087-02/.
- https://www.dailymetalprice.com/metalprices.php.
- R. Wen, G. A. Niklasson and C. G. Granqvist, Sol. Energy Mater. Sol. Cells, 2014, 120, 151–156, DOI:10.1016/j.solmat.2013.08.035.
- C. Dhas, R. Venkatesh, R. Sivakumar, A. M. E Raj and C. Sanjeeviraja, Ionics, 2016, 22, 1911–1926, DOI:10.1007/s11581-016-1707-0.
- L. Liu, T. Wang, Z. He, Y. Yi, M. Wang, Z. Luo, Q. Liu, J. Huang, X. Zhong, K. Du and X. Diao, Chem. Eng. J., 2021, 414, 128892 CrossRef.
- K. S. Kumar, D. Pandey and J. Thomas, ACS Energy Lett., 2021, 6, 3590–3599 CrossRef.
- Y. Abe, et al., Jpn. J. Appl. Phys., 2006, 45, 7780 CrossRef.
- Q. Zhang, Q. Liu, J. Kang, Q. Huang, Z. Liu, X. Diao and J. Zhai, Adv. Sci., 2018, 5, 1800163 CrossRef.
- J. Wang, X. Huo, M. Guo and M. Zhang, J. Energy Storage, 2022, 47, 103597, DOI:10.1016/j.est.2021.103597.
- S. K. Deb, Appl. Opt., 1969, 8, 192–195 CrossRef.
- M. H. Chua, T. Tang, K. H. Ong, W. T. Neo and J. W. Xu, Electrochromic Smart Materials: Fabrication and Applications, 2019, pp. 1–21 Search PubMed.
- Y. Ding, W. Mengying, Z. Mei and X. Diao, Sol. Energy Mater. Sol. Cells, 2022, 248, 112037, DOI:10.1016/j.solmat.2022.112037.
- F.-Q. Liu, W.-P. Wang, Y.-X. Yin, S.-F. Zhang, J.-L. Shi, L. Wang, X.-D. Zhang, Y. Zheng, J.-J. Zhou, L. Li and Y.-G. Guo, Sci. Adv., 2018, 4(10), eaat5383, DOI:10.1126/sciadv.aat5383.
- H. P. Chen, J. W. Fergus and B. Z. Jang, J. Electrochem. Soc., 2000, 147, 399 CrossRef CAS.
- A. Stenman, Electrochromic properties of nickel oxide in different electrolytes, 2013 Search PubMed.
- X. Che, J. Guo, M. Wang, M. Wang, X. Zhong, Q. Liu, G. Dong, X. Wang, J. Yang and X. Diao, Energy Technol., 2021, 9(12), 2100656, DOI:10.1002/ente.202100656.
- R. Wen, G. A. Niklasson and C. G. Granqvist, Thin Solid Films, 2014, 565, 128–135, DOI:10.1016/j.tsf.2014.07.004.
- K. Xu, Chem. Rev., 2004, 104, 4303–4418 CrossRef CAS PubMed.
- R. Younesi, G. M. Veith, P. Johansson, K. Edström and T. Vegge, Energy Environ. Sci., 2015, 8, 1905–1922 RSC.
- S. Passerini, B. Scrosati and A. Gorenstein, J. Electrochem. Soc., 1990, 137, 3297 CrossRef CAS.
- R. T. Wen, G. A. Niklasson and C. G. Granqvist, Thin Solid Films, 2014, 565, 128–135 CrossRef CAS.
- Z. Luo, L. Liu, X. Yang, X. Luo, P. Bi, Z. Fu, A. Pang, W. Li and Y. Yi, ACS Appl. Mater. Interfaces, 2020, 12, 39098–39107 CrossRef CAS.
- Z. Wu, S. M. Bak, Z. Shadike, S. Yu, E. Hu, X. Xing, Y. Du, X. Q. Yang, H. Liu and P. Liu, ACS Appl. Mater. Interfaces, 2021, 13, 31733–31740 CrossRef CAS PubMed.
- H. Shao, Z. Lin, K. Xu, P. Taberna and P. Simon, Energy Storage Mater., 2019, 18, 456–461, DOI:10.1016/j.ensm.2018.12.017ff.ffhal-02359535f.
- O. Klymenko, R. Evans, C. Hardacre, I. Svir and R. Compton, J. Electroanal. Chem., 2004, 571, 211–221, DOI:10.1016/j.jelechem.2004.05.012.
- W. Liu, H. Yi, Q. Zheng, X. Li and H. Zhang, J. Mater. Chem. A, 2017, 5, 10928 RSC.
- K. Li, X. Wang, X. Wang, M. Liang, V. Nicolosi, Y. Xu and Y. Gogotsi, Nano Energy, 2020, 75, 104971 CrossRef.
- Y. S. Lee and K. S. Ryu, Sci. Rep., 2017, 7, 16617, DOI:10.1038/s41598-017-16711-9.
- D. Dong, T. E. Benhaddouch, C. L. Metler, J. Marcial, Y. Zhao, V. Venkadesh, T. Thundat and S. Bhansali, J. Electrochem. Soc., 2022, 169(8), 080511, DOI:10.1149/1945-7111/ac86a5.
- H. Nara, D. Mukoyama, R. Shimizu, T. Momma and T. Osaka, J. Power Sources, 2019, 409, 139–147, DOI:10.1016/j.jpowsour.2018.09.014.
- T. Hang, D. Mukoyama, H. Nara, N. Takami, T. Momma and T. Osaka, J. Power Sources, 2013, 222, 442–447, DOI:10.1016/j.jpowsour.2012.09.010.
| This journal is © The Royal Society of Chemistry 2022 |

