 Open Access Article
A double co-sensitization strategy using heteroleptic transition metal ferrocenyl dithiocarbamate phenanthrolene-dione for enhancing the performance of N719-based DSSCs†
Amita Singh ab,
Devyani Srivastava
 b,
Suresh W. Gosavic,
Ratna Chauhan*d,
Muthupandian Ashokkumar
 e,
Awad Naseer Albalwif,
Mohd. Muddassir
 f and
Abhinav Kumar
 *b
*b
aDepartment of Chemistry, Dr Rammanohar Lohia Awadh University, Ayodhya-224001, India
bDepartment of Chemistry, Faculty of Science, University of Lucknow, Lucknow 226 007, India. E-mail: abhinavmarshal@gmail.com
cDepartment of Physics, Savitribai Phule Pune University, Pune-411007, India
dDepartment of Environmental Science, Savitribai Phule Pune University, Pune-411007, India. E-mail: ratnasingh.bhu@gmail.com
eSchool of Chemistry, University of Melbourne, VIC 3010, Australia
fDepartment of Chemistry, College of Sciences, King Saud University, Riyadh 11451, Saudi Arabia
First published on 3rd October 2022
Abstract
Three new heteroleptic dithiocarbamate complexes with formula [M(Phen-dione)(Fcdtc)]PF6 (where M = Ni(II) Ni-Fc, Cu(II) Cu-Fc) and [Co(Phen-dione)(Fcdtc)2]PF6 (Co-Fc) (Fcdtc = N-ethanol-N-methylferrocene dithiocarbamate and Phen-dione = 1,10-phenanthroline-5,6-dione; PF6− = hexafluorophosphate) were synthesized and characterized using microanalysis, FTIR, electronic absorption spectroscopy and mass spectrometry. The solution state electronic absorption spectroscopy for all three complexes displayed a band at ∼430 nm corresponding to the ferrocene unit and another low-intensity band in the visible region arising because of the d–d transitions. These newly synthesized complexes were used as co-sensitizers for the state-of-the-art di-tetrabutylammonium cis-bis(isothiocyanato)bis(2,2′-bipyridyl-4,4′-dicarboxylato)ruthenium(II) (N719) dye in dye-sensitized solar cells (DSSCs). Among the three co-sensitizers/co-adsorbent-based DSSC set-ups, the assembly fabricated using Co-Fc/N719 displayed good photovoltaic performance with 5.31% efficiency (η) while a new triple component strategy inculcating N719, Co-Fc and Cu-Fc dyes offered the best photovoltaic performance with 6.05% efficiency (η) with incident photon to current conversion efficiency (IPCE) of 63%. This indicated an upliftment of the DSSC performance by ∼38% in comparison to the set-up constructed by employing only N719 dye (η = 4.39%) under similar experimental conditions.
Introduction
There is a rising concern about fulfilling the energy needs of the exponentially increasing world population.1 Hence, apart from conventional non-renewable sources of energy, scientists and industries working in the energy sector are looking for renewable sources of energy. Amongst these, solar energy is a prudent option that can fulfill the energy demand of the entire world as annually around 6000 times more energy reaches from the sun to the earth's surface than the energy consumed by the entire world.2 To convert solar radiation into accessible form, apt photovoltaic devices that can capture and convert the quanta coming from the sun to electrical energy for their concomitant utilization in a plethora of applications are required. However, the photovoltaic devices developed using solid-state p–n junctions are expensive and difficulties associated with the fabrication of the p–n junction are the main obstacles in their use. Hence, due to potentially low production costs and good efficiency, dye-sensitized solar cells (DSSCs) have received considerable attention from researchers working in this field.3 Hence, after the pioneering work by Grätzel et al. in 1991, during the past twenty years, DSSCs had become the alluring class of devices due to their ease of fabrication with excellent incident photo conversion efficiency, charge transfer flexibility, transparency, and colour properties.4–7 A typical DSSC set-up is designed using a photo-anode fabricated using an appropriate light harvester coated over a suitable semiconducting material, especially nanocrystalline TiO2, a counter electrode, and a redox mediator.8The most important component of any typical DSSC set-up is the photosensitizer and amongst which the Ru(II) polypyridyl sensitizer, especially state-of-the-art di-tetrabutylammonium cis-bis-(isothiocyanato)-bis-(2,2′-bipyridyl-4,4′-dicarboxylato)ruthenium(II) (N719) dye exhibited certified photovoltaic efficiency of 11%.7 In spite of its low abundance, high cost, poor absorption in the near-infrared (NIR) region, and difficulty in purification and isolation of Ru(II) complexes, scientists working in the area of photovoltaics continuously developed analogues of N719.8 Apart from ruthenium-based sensitizers, till date, numerous organic and inorganic photosensitizers have been reported wherein the efficiency with metal-free organic sensitizers reached 14%.9–16 Also, to uplift the photovoltaic performance, porphyrin-based sensitizers have been used due to their high molar extinction coefficients.17,18 Also, by judicious modification in the structure of heterocycles such as pyrroles, thiophenes, imidazoles, their electrochemical and optical properties can be tuned. This results in broad electronic absorption, which ranges from the visible to the NIR region.17–24 The pertinent examples include meso-phenyl carboxylate zinc(II) porphyrin and porphyrin substituted with carboxylic groups at the β-pyrrole position that offered overall efficiencies of 3.5% (ref. 21) and 7.1%, respectively.23 Also, recently Grätzel et al. delineated YD2-O-C832 and SM315 sensitizers that offered efficiencies of up to 12.5% and 13%, respectively.25,26 Additionally, D–π–A porphyrin-based sensitizers with phenothiazine as an electron donor and benzothiadizole as an acceptor exhibited ∼10% photovoltaic efficiency.27 While, porphyrin-based organic co-sensitizers along with N719 dye exhibited 14.2% photovoltaic efficiency.28,29 Giribabu et al. reported D–π–A based porphyrin-based sensitizers viz. LG24, LG26, LG25, and LG27 exhibit ∼10.45% power conversion efficiency.30,31
Apart from these reports, the use of 2D and 3D hybrid systems viz. perovskite solar cells constitute very promising photovoltaic devices with a maximum overall conversion efficiency of 18.8%.32 Nevertheless, their instability and higher charge recombination hampered their commercial utilization. Further, photosensitizers having heterocyclic units viz. pyranylidene, thienothiophenes, carbazole, oxadiazole, benzimidazole and dicyanovinyl, dicyanoimidazole, tricyanofuran, indandione, (thio)barbituric acid have been widely employed as push–pull units in DSSCs.32,33 In relation to this, metallocenes, ferrocene (Fc), and Fc-based systems acting like electron-rich moieties can be employed as sensitizers in DSSC setups.34 Hence, a range of coordination complexes and compounds comprising ferrocene entities have been used as sensitizers in DSSCs.34 Further, to extend the applicability of ferrocene as a photosensitizer in DSSC and to uplift its stability and performance, π-conjugated ferrocene and ferrocene-appended heterocycles have been reported.35
Apart from these reports, the ferrocene-based complexes have been utilized as co-sensitizers to enhance the DSSC performance of the state-of-the-art N719 dyes.36 These investigations laid a firm platform to utilise ferrocene-based derivatives as co-sensitizers in DSSCs. The 1,10-phenanthrolene-5,6-dione ligand-based complexes display the potential to exhibit higher stability and have the capability to allow control over redox tenability and also these can engender suitable metalloligands for the generation of functionalized coordination complexes that could be utilized as sensitizers and co-sensitizers in DSSCs.37
In view of the aforementioned aspects associated with the ferrocene functionalized coordination complexes and in our quest to develop new ferrocene functionalized sensitizers, in the presented report new-heteroleptic complexes inculcating ferrocene and 1,10-phenanthrolene-5,6-dione have been synthesized and their plausible applications as sensitizers and co-sensitizers have been delineated. The outcomes of these investigations are presented herewith.
Results and discussion
Syntheses
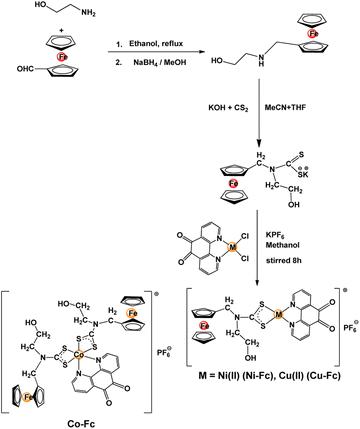
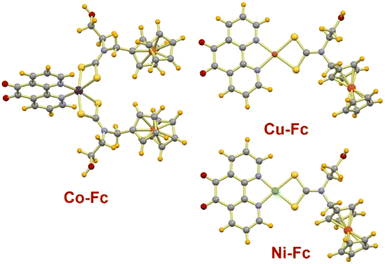
The ferrocene appended dithiocarbamate ligand was obtained by condensation of ferrocenecarboxaldehyde and ethanolamine that yielded a Schiff base, which after reduction with sodium borohydride gave ferrocene functionalized secondary amine. This reaction with KOH and carbon disulfide yielded the potassium salt of dithiocarbamate ligand (Scheme 1). Finally, reacting a methanol solution of [M(Phen-dione)] (M = Co(III), Ni(II), and Cu(II)) with the dithiocarbamate ligand yielded the desired sensitizers Co-Fc, Ni-Fc, Cu-Fc (Scheme 1). All three sensitizers were air and moisture stable and were characterized by microanalysis, FTIR, UV-Vis, and mass spectrometry.The molecular structure of all three sensitizers was assessed with the help of theoretical calculations and optimized geometries are presented in Fig. 1. The calculations revealed that the immediate geometry around Ni(II) in Ni-Fc and Cu(II) in Cu-Fc are distorted square planars, whereas in Co-Fc the geometry around Co(III) is distorted octahedral (Fig. 1). The geometry around the Ni(II) and Cu(II) are defined by two sulfur centers of Fc-dtc and two nitrogen of Phen-dione ligands. While, in Co-Fc, the octahedral geometry around Co(III) is satisfied by four sulfur atoms of two Fc-dtc ligands and two nitrogen atoms of Phen-dione ligand (Fig. 1). The Ni–S bond distances in Ni-Fc are 2.22 Å, while in Cu-Fc, the Cu–S distances are ∼2.31 Å. The Ni–N, and Cu–N bond distances are 1.957 and 2.075 Å, respectively. In Co-Fc, the Co–S bond distance is ∼2.31, Å and the Co–N bond distance is 2.020 Å. For Ni-Fc and Cu-Fc, the ∠S–Ni–S and ∠S–Cu–S are 79.06° and 77.48°, respectively. While ∠N–Ni–N and ∠N–Cu–N are 83.95° and 80.23° respectively. In Co-Fc, the ∠S–Co–S and ∠N–Co–N bite angles are 51.48° and 81.44°, respectively. The geometrical parameters are in good agreement with the previously reported analogous complexes.37e–i
The IR spectra of Ni-Fc, Cu-Fc, and Co-Fc displayed bands at 1583 cm−1, 1512 cm−1, and 1538 cm−1, respectively, which can be attributed to the stretching frequencies of the C![[double bond, length as m-dash]](https://www.rsc.org/images/entities/char_e001.gif) O group of the 1,10-phenanthroline-5,6-dione ligand. The antisymmetric stretching frequencies corresponding to the –CS2 moiety of dithiocarbamate ligand appears at 1195 cm−1 (Ni-Fc), 1197 cm−1 (Cu-Fc), and 1197 cm−1 (Co-Fc). While, symmetric νCS2 appears at 1037 cm−1 (Ni-Fc), 1037 cm−1 (Cu-Fc) and 1061 cm−1 (Co-Fc). Also, νNCS2 vibrations of the dithiocarbamate ligand appeared at 1430 cm−1 (Ni-Fc), 1443 cm−1 (Cu-Fc), and 1423 cm−1 (Co-Fc) in all three sensitizers, which are intermediate between single (1360–1250 cm−1) and double (1690–1640 cm−1) stretching vibrations and hence indicates the existence of partial double bond character between carbon and nitrogen centers of the dithiocarbamate ligand.37g
O group of the 1,10-phenanthroline-5,6-dione ligand. The antisymmetric stretching frequencies corresponding to the –CS2 moiety of dithiocarbamate ligand appears at 1195 cm−1 (Ni-Fc), 1197 cm−1 (Cu-Fc), and 1197 cm−1 (Co-Fc). While, symmetric νCS2 appears at 1037 cm−1 (Ni-Fc), 1037 cm−1 (Cu-Fc) and 1061 cm−1 (Co-Fc). Also, νNCS2 vibrations of the dithiocarbamate ligand appeared at 1430 cm−1 (Ni-Fc), 1443 cm−1 (Cu-Fc), and 1423 cm−1 (Co-Fc) in all three sensitizers, which are intermediate between single (1360–1250 cm−1) and double (1690–1640 cm−1) stretching vibrations and hence indicates the existence of partial double bond character between carbon and nitrogen centers of the dithiocarbamate ligand.37g
Electronic absorption spectroscopy
The electronic absorption spectroscopy on all three sensitizers was performed in DMF solutions (Fig. 2a). All three sensitizers display bands ∼450 nm, which is due to the d → d (assigned to the 1E1g ← 1A1g) transition of the ferrocene moiety.36b,c The higher energy absorptions observed near 360 nm, 300 nm and 250 nm in all the complexes may be assigned to the intraligand charge transfer transitions. Broad bands with medium intensity observed between 550–750 nm arise due to the square planar geometry around nickel(II) and copper(II) and the octahedral environment around cobalt(III).38 Apart from this, the spectral response of the Co-Fc complex extends up to ∼700 nm in comparison to Cu-Fc and Ni-Fc.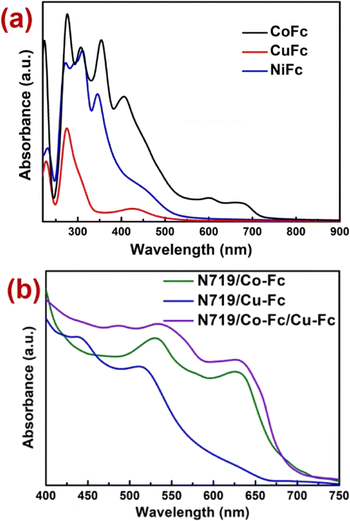 | ||
| Fig. 2 (a) Electronic absorption spectra of the complexes recorded in 1 × 10⁻³ M DMF solution. (b) Electronic absorption spectra of the co-sensitizers with N719 dyes recorded on TiO2 nanoparticles. | ||
Also, the electronic absorption spectra of co-sensitizers Cu-Fc and Co-Fc with N719 dyes anchored on TiO2 films were also recorded (Fig. 2b). The results indicated that after co-sensitization, the electronic absorption spectra of Cu-Fc and Co-Fc changed significantly. The electronic absorption responses of N719/Co-Fc, N719/Cu-Fc, and N719/Co-Fc/Cu-Fc in the visible region were enhanced, especially in the case of the triple sensitizer (N719/Cu-Fc/Co-Fc), it covered the spectral region from 400–720 nm. The enhancement in spectral response after co- and triple sensitization indicated that the light-harvesting ability of the DSSC devices fabricated using co- and triple sensitization strategies will be greatly improved, which may increase the short circuit current.
Electrochemical studies
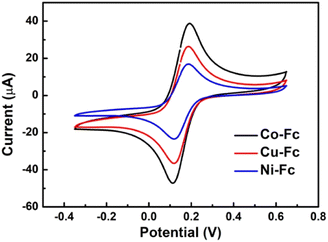
One of the important prerequisites for the utilization of any sensitizer in a DSSC set-up is its energy level, which must be matching with respect to the conduction band of TiO2 as it is important for the thermodynamic feasibility of the device. The sensitizers should have better regeneration efficiency and high electron injection efficiency for high-open-circuit voltage and short-circuit current of devices as well as high power conversion efficiency. Hence, in order to check the ability of electron injection and regeneration properties of sensitizers, cyclic voltammetry (CV) studies in a three-electrode cell on an electrochemical workstation, by using Pt disc as the working electrode and Ag/Ag+ (in acetonitrile) as the reference electrode, were performed. The electrochemical parameters of these complexes calculated from the CV are summarized in Table 1. From Table 1, it is evident that the LUMO level of sensitizers is more negative (−2.66 to −1.89 V vs. Ag/Ag+ in acetonitrile (ACN)) than the conduction band edge of the TiO2 (−0.85 V vs. Ag/Ag+ in ACN). This indicates that the excited dyes can efficiently inject electrons into the conduction band of TiO2 as well as the HOMO level of sensitizers is more positive (+0.146 to +0.152 V vs. Ag/Ag+ in ACN) than the redox potential of the electrolyte (−0.15 V Ag/Ag+ in ACN) providing an adequate driving force for regeneration of dyes (Fig. 3).| Sensitizer | Ep,a (V) | Ep,c (V) | ΔE = Ep,a − Ep,c (V) | E° (V) = (Ep,a + Ep,c)/2 | E.S = E° + hν |
|---|---|---|---|---|---|
| Co-Fc | +0.178 | +0.126 | +0.052 | +0.152 | −1.89 |
| Cu-Fc | +0.170 | +0.130 | +0.040 | +0.150 | −2.65 |
| Ni-Fc | +0.167 | +0.125 | +0.042 | +0.146 | −2.66 |
The energy level diagram (Fig. 4) obtained from the combined results of electronic absorption spectra and electrochemical data suggest a thermodynamically favourable electron injection from the excited state of N719 to the conduction band of TiO2 followed by successive regeneration of N719 by an electrolyte (I−/I3−). Also, the presence of co-sensitizers additionally transfers an electron to the conduction band of TiO2 as well as the LUMO of N719 to uplift the photovoltaic performance with concomitant regeneration by the electrolyte.
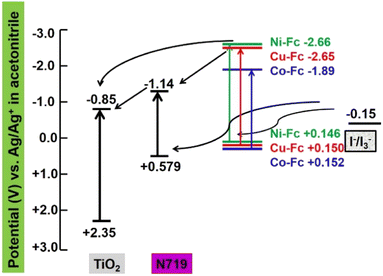 | ||
| Fig. 4 Schematic energy level diagrams of HOMO and LUMO levels for the sensitizers and co-sensitizers compared to TiO2. | ||
Photovoltaic performance of DSSCs
The photovoltaic performances of the DSSC set-up fabricated using sensitization and co-sensitization strategies were assessed and the resultant photovoltaic parameters, obtained from the J–V curves of DSSCs (Fig. 5) are listed in Table 2. We can see that the highest photoelectric conversion efficiency (η) for the sensitization of the dyes in DSSC based on Co-Fc is 3.01%, with open circuit voltage (Voc) 620 mV, short-circuit current (Jsc) 7.65 mA cm−2, and fill factor (FF) 0.63, whereas the η for the DSSC based on Cu-Fc and Ni-Fc are 2.27% and 1.48%, respectively. Evidently, the high Voc and Jsc for the Co-Fc-based DSSC are the key reasons for its high η. In comparison to Cu-Fc and Ni-Fc, Co-Fc exhibits better electron donation and conjugation properties due to the extended conjugation as well as earlier absorption spectroscopic studies, also revealed that Co-Fc has a better light-harvesting ability in the visible region, which is favourable to increasing the Jsc of the DSSCs. The spectral response of these dyes is not ideal to harvest the entire visible spectrum, so, for harvesting maximum visible light to the electrical energy, it is necessary to enhance the visible response of dyes. Hence, co-sensitization and double co-sensitization by combining N719 and one co-sensitizer (Cu-Fc or Co-Fc) and three dyes using N719 and two co-sensitizers (Cu-Fc and Co-Fc) to enhance the visible spectral response performed. Since the device performance of Ni-Fc was the poorest, this sensitizer was not used for co-sensitization studies further. By co-sensitizing, the spectral responses for Co-Fc/N719 and Cu-Fc/N719 were found to be extended in the visible region and it was from 450 nm to 750 nm and 400 nm to 650 nm for Co-Fc/N719 and Cu-Fc/N719, respectively, whereas, it covered the entire visible spectrum (400 to 750 nm) by double co-sensitization (Co-Fc/Cu-Fc/N719). As expected, the overall performance of the devices after co-sensitization and double co-sensitization improved significantly. Especially, for the DSSC based on Co-Fc/Cu-Fc/N719, the Jsc was enhanced up to 12.87 mA cm−2 with Voc and η values were 733 mV and 6.05% respectively. From Table 2, it is evident that the enhancement in η and Jsc is consistent with the enhancement of their spectral performance. Further, we also found that the Voc of the DSSCs was improved considerably after co-sensitization and double co-sensitization, increasing by almost 100 mV. This enhancement in Voc is due to the compactness of dye molecule arrangement, which is favourable for inhibiting the penetration of the oxidizing electrolyte into the photoanode. Also, it helps to reduce the charge recombination behaviour. Also, an increase in short-circuit current density and the spectral sensitivity of devices provide a reinforcing effect on the device performances.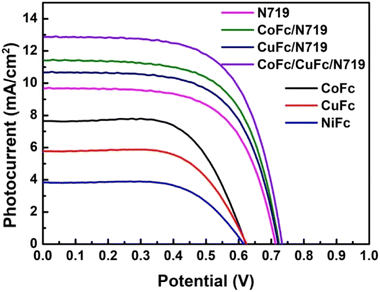 | ||
| Fig. 5 J–V curves for the DSSC cell set-up fabricated with different sensitizers and co-sensitizers. | ||
| Sensitizers | Jsc (mA cm−2) | Voc (mV) | FF | η (%) | IPCE (%) |
|---|---|---|---|---|---|
| N719 | 9.68 | 718 | 0.63 | 4.39 | 43 |
| Co-Fc | 7.65 | 620 | 0.63 | 3.01 | 44 |
| Cu-Fc | 5.78 | 616 | 0.64 | 2.27 | 44 |
| Ni-Fc | 3.83 | 610 | 0.63 | 1.48 | 42 |
| Co-Fc/N719 | 11.41 | 730 | 0.64 | 5.31 | 62 |
| Cu-Fc/N719 | 10.67 | 728 | 0.63 | 4.91 | 59 |
| Co-Fc/Cu-Fc/N719 | 12.87 | 733 | 0.64 | 6.05 | 63 |
The incident photon-to-electron conversion efficiencies (IPCEs) for all the photovoltaic cell set-ups as a function of the wavelength of incident monochromatic light are presented in Fig. 6. The IPCE was determined from light-harvesting efficiencies, charge injection, charge regeneration, and charge collection properties. The sensitizers, Ni-Fc and Cu-Fc displayed maximum IPCE values of 42% and 44%, respectively at 440 nm, whereas Co-Fc exhibited maximum IPCE on higher wavelengths (500–750 nm) and it matches well with the electronic absorption spectrum of the individual dyes (Fig. 6, Table 2). In co-sensitized photovoltaic cell set-ups, superior IPCE values were obtained than those for sensitized cell set-ups. For co-sensitized cell set-ups, Co-Fc/N719, Cu-Fc/N719, and double co-sensitized cell set-ups Co-Fc/Cu-Fc/N719 the IPCE values ranged between 60 and 63% with the exposure of the entire visible region. The obtained higher IPCE value in co-sensitized than sensitized cell setups indicates a more efficient charge collection. Also, in comparison to the N719-based cell set-up, the photocurrent responses of Co-Fc/N719, Cu-Fc/N719, and Co-Fc/Cu-Fc/N719 were relatively better. The overall best performance of Co-Fc in sensitized and co-sensitized DSSC set-up was better due to the charge carrier separation and transportation with reduced electron–hole recombination. Also, the variation in the performance of sensitizers in sensitized and co-sensitized set-ups can also be correlated to their differences in the absorbance in the 400–500 nm and 600–750 nm regions, the spectral region where light absorption by N719 is inferior. The light absorption by sensitizers and co-sensitizers in this spectral region follows the order Co-Fc/Cu-Fc/N719 > Co-Fc/N719 > Cu-Fc/N719 > Co-Fc > Cu-Fc > Ni-Fc, which suggests that Co-Fc/Cu-Fc/N719 is most capable of recompensing the light absorption by N719 in 400–500 nm and 600–750 nm regions. In addition, the integration of the IPCE curves was accomplished by the convolution of the IPCE spectra where Jsc for the DSSCs under solar illumination was predicted with the photo-flux density distribution for one sun as the following equation:7b
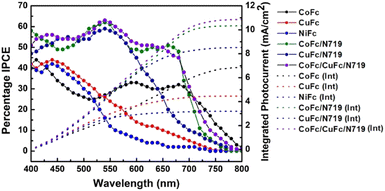 | ||
| Fig. 6 IPCE plots for DSSCs fabricated using Co-Fc, Cu-Fc and Ni-Fc sensitized and co-sensitized photoelectrodes with integrated photocurrent. | ||
Electrochemical impedance spectroscopy (EIS)
To assess the kinetics of the electron transport properties and charge recombination, electrochemical impedance spectroscopy (EIS) was performed, which assists in the investigation of the charge transfer dynamics at the interfacial regions of the solid–liquid layers. The Nyquist plots of sensitized and co-sensitized photoelectrodes were recorded under standard global AM 1.5 solar irradiation in light and in dark at their open circuit potential (OCP) over a frequency range of 10−2 to 105 Hz. In the EIS study, the semicircle in the middle frequency region is associated with the electron/charge transfer at the TiO2/dye/electrolyte interface.39–41 Fig. 7a and b show the Nyquist plots for DSSCs fabricated by using N719, Co-Fc/N719, Cu-Fc/N719 and Co-Fc/Cu-Fc/N719 in the dark and light, respectively.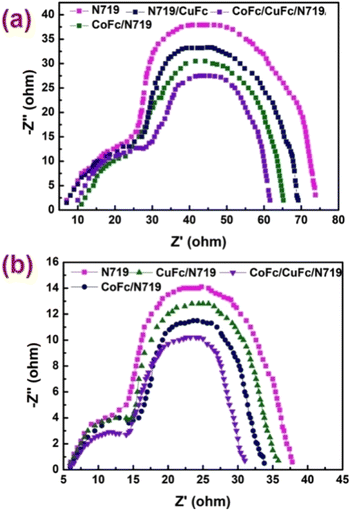 | ||
| Fig. 7 Electro-chemical impedance spectra, Nyquist plots of DSSCs measured in (a) dark and (b) light (100 mW cm−2). | ||
Under light illumination (Fig. 7b), the two semicircles located at high and middle-frequency regions are attributed to the electrochemical reaction at the Pt/electrolyte interface and charge transfer at the TiO2/dye/electrolyte interface. The semicircles of large radii positioned at the middle frequency region in the Nyquist plots decrease after co-sensitization with the metal complex and the decline in radii of the semicircles are in the order Co-Fc/Cu-Fc/N719 < Co-Fc/N719 < Cu-Fc/N719 < N719. This signifies a decreasing trend of the electron transfer impedance (Rct) as well as an increase in the charge transfer rate at this interface after co-sensitization.42 Under dark conditions (Fig. 7a), the appearance of the two semicircles in Nyquist plots at high and middle-frequency regions are attributed to the redox reaction at the Pt counter electrode and the electron transfer at the TiO2/dye/electrolyte interface. In dark, the large semicircle lying in the middle frequency region represents the resistance of the charge transfer from TiO2 to the electrolyte (back recombination resistance Rrec). The radii of the semicircles observed in the middle frequency range are in order of Co-Fc/Cu-Fc/N719 > Co-Fc/N719 > Cu-Fc/N719 > N719, indicating the sequence of Rrec at the TiO2/dye/electrolyte interface, which implies the retardation of the charge recombination between injected electrons and I3− ions in the electrolyte, which as a consequence resulted in increased Voc. The EIS study under light and dark conditions confirmed that the charge transfer rate increases and the charge recombination rate decreases for co-sensitized cell set-ups, which is conducive to enhancing the performance of DSSCs.43
Table 3 summarises the DSSC results of the previously published co-sensitizers. According to the photovoltaic data, the performance of the co-sensitizers tested in this work is comparable to those of the previously published analogous co-sensitizers. However, the cell performance of the co-sensitizers is much lower than that of a few comparable derivatives, which may be attributed in part to the better spectrum responsiveness and photo-electron transfer. To achieve higher cell performance, co-sensitizers should display enhanced spectrum response in spectral regions where N719 exhibits poorer spectral response, better co-sensitizer anchoring, and effective photo-electron transfer to both the semiconductor conduction band and the excited state of N719.
| Dyes | Jsc (mA cm−2) | Voc (V) | FF | η (%) | IPCE (%) | Ref |
|---|---|---|---|---|---|---|
| Zn/N719 | 12.90 ± 0.03 | 0.750 ± 0.002 | 0.73 ± 0.01 | 7.10 ± 0.02 | 47 ± 1 | 36b |
| Hg/N719 | 11.98 ± 0.04 | 0.730 ± 0.002 | 0.73 ± 0.01 | 6.38 ± 0.04 | 39 ± 1 | |
| Cd/N719 | 12.35 ± 0.03 | 0.740 ± 0.003 | 0.73 ± 0.01 | 6.68 ± 0.03 | 42 ± 1 | |
| ZnL/N719/TiO2 | 14.46 | 0.74 | 0.62 | 6.65 | 42 | 44a |
| CdL/N719/TiO2 | 14.35 | 0.73 | 0.60 | 6.30 | 41 | |
| HgL/N719/TiO2 | 13.92 | 0.70 | 0.61 | 5.96 | 40 | |
| 1/N719/TiO2 | 17.99 | 0.70 | 0.61 | 7.68 | 82 | 44b |
| 4/N719/TiO2 | 16.69 | 0.71 | 0.58 | 6.85 | 79 | |
| 1/N719/TiO2 | 17.48 | 0.75 | 0.63 | 8.27 | — | 44c |
| 2/N719/TiO2 | 17.39 | 0.74 | 0.60 | 7.73 | — | |
| 2-Py-Zn/N719 | 10.43 | −0.727 | 0.63 | 4.80 | 39 | 44d |
| 3-Py-Zn/N719 | 10.93 | −0.736 | 0.63 | 5.06 | 41 | |
| 4-Py-Zn/N719 | 14.08 | −0.727 | 0.64 | 6.52 | 44 | |
| N719/Zn-Fc | 11.25 ± 0.06 | 0.776 ± 0.02 | 0.65 ± 0.02 | 5.71 ± 0.04 | 63 ± 2 | 36c |
| N719/Cd-Fc | 10.15 ± 0.04 | 0.758 ± 0.03 | 0.65 ± 0.01 | 5.00 ± 0.05 | 59 ± 1 | |
| N719/Hg-Fc | 9.38 ± 0.06 | 0.742 ± 0.02 | 0.66 ± 0.01 | 4.57 ± 0.03 | 57 ± 1 |
Conclusion
In the presented investigation, three new ferrocene appended heteroleptic dithiocarbamate complexes with 1,10-phenanthroline-5,6-dione ancillary ligands were synthesized and used as co-sensitizers for state-of-the-art N719 dye. A new double co-sensitization strategy involving the use of Cu(II) and Co(III) complexes uplifted the photovoltaic performance of the state-of-the-art N719 dye and further uplifted DSSC performance by ∼38% in comparison to the set-up constructed using only N719 dye under similar experimental condition. The enhancement in the photovoltaic performance of such a photovoltaic cell was accredited to the expansion of the electronic absorption band in the visible region and the rise in the electronic absorption intensity. Further, as evident by EIS studies, this improvement in cell performance was due to an increase in the charge transfer rate and a decline in the charge recombination rate after co-sensitization of N719. Such investigation will lay a firm platform to develop new co-sensitizers that along with N719 and analogous dyes will improve the DSSC performance.Experimental
General considerations
All chemicals and reagents were obtained from commercial sources and used without any further purification. Elemental analyses for the co-sensitizers were performed on a PerkinElmer 240 C H N analyser, while FTIR spectra were recorded on a Shimadzu IR Affinity-1S spectrometer. The electronic absorption spectroscopy for the co-sensitizers was performed on a SPECORD 210 PLUS BU spectrophotometer. The mass spectrometry for all three co-sensitizers was performed on a Bruker Impact II mass spectrometer and data analyses were executed using Bruker Compass Data Analysis 4.2 software.Syntheses
The synthesis of 1,10-phenanthroline-5,6-dione,43a and [M-(Phen-dione)] M = Co, Ni, Cu was performed by considering the previously reported literature.43bSynthesis of potassium N-2-hydroxy-ethyl-N-methylferrocenyl dithiocarbamate
To the 10 mL ethanol solution of ferrocene carboxaldehyde (0.214 g, 1 mmol) was added ethanolamine (0.073 g, 1.2 mmol) and the reaction mixture was refluxed for 6 h under nitrogen to yield ferrocenyl imine derivative, which thereafter was reduced to a secondary amine with sodium borohydride (0.152 g, 4 mmol). The reaction mixture was rotary evaporated and the obtained product was extracted using dichloromethane (3 × 50 mL) and washed with water followed by brine. The crude organic layer was dried over anhydrous sodium sulfate, filtered and again rotary evaporated to obtain an oily orange solid (N-ethanol-N-methylferrocenyl amine). The N-ethanol-N-methylferrocenyl amine ligand (0.251 g, 0.97 mmol) was dissolved in THF/acetonitrile (50![[thin space (1/6-em)]](https://www.rsc.org/images/entities/char_2009.gif) :
:![[thin space (1/6-em)]](https://www.rsc.org/images/entities/char_2009.gif) 50 v/v, 10 mL) and THF solution of KOH (0.067 g, 1.2 mmol) was added to it. After stirring for 30 min, CS2 (0.114 g, 1.5 mmol) was added and the resultant reaction mixture was additionally stirred for 3 h to obtain a yellow precipitate, which was filtered and washed twice with diethyl ether and dried.
50 v/v, 10 mL) and THF solution of KOH (0.067 g, 1.2 mmol) was added to it. After stirring for 30 min, CS2 (0.114 g, 1.5 mmol) was added and the resultant reaction mixture was additionally stirred for 3 h to obtain a yellow precipitate, which was filtered and washed twice with diethyl ether and dried.
Synthesis of 1,10-phenanthroline 5,6-dione: (Ph-dione)
Caution: Reaction led to the liberation of bromine fumes.Potassium bromide (4.000 g, 33.6 mmol) and 1,10-phenanthroline (4.000 g, 22.2 mmol) were mixed in 200 mL two necked round bottom flask and to it was added the mixture of sulphuric acid (98%, 40 mL) and nitric acid (69%, 20 mL). During this addition, the temperature of the flask was maintained between 0–5 °C until the dark red-brown bromine fumes subsided and thereafter, the mixture was refluxed for 6 h. The obtained solution was cooled to room temperature and then poured over crushed ice. Thereafter, neutralisation of the reaction mixture using conc. NaOH solution between pH 4–5 yielded a yellow suspension, which was further extracted with chloroform (3 × 200 mL), washed with water (2 × 200 mL), and dried over anhydrous sodium sulfate, filtered and rotary evaporated to obtain a yellow residue. It was washed with diethyl ether and dried under a vacuum.43
Synthesis of [M(Phen-dione)] (M = Co, Ni, Cu)
The solution of CoCl2·6H2O (0.118 g, 0.5 mmol) or NiCl2·6H2O (0.119 g, 0.5 mmol) or CuCl2·3H2O (0.085 g, 0.5 mmol) in methanol was added dropwise into stirring chloroform solution of Ph-dione (0.105 g, 0.5 mmol). The resulting yellow-brown/intense green/brown green coloured reaction mixture was stirred overnight and the solvent was rotary evaporated. The obtained residue was washed repeatedly with diethyl ether and dried under a vacuum.Synthesis of [Co(Fcdtc)3(Phen-dione)]PF6(Co-Fc)
A methanolic solution of KPF6 (0.184 g, 1 mmol) was added dropwise to the stirring solution of Fcdtc (0.186 g, 0.5 mmol). The obtained light yellow solution was stirred for half an hour in an ice bath followed by the addition of [Co(Phen-dione)] (0.169 g, 0.5 mmol). Upon complete addition, the colour of the reaction mixture turned olive brown and the reaction mixture was stirred overnight. The solvent was rotary evaporated and the obtained residue was washed with petroleum ether and dried under a vacuum.Synthesis of [Ni(Fcdtc)2(Phen-dione)]PF6(Ni-Fc)
A methanolic solution of KPF6 (0.368 g, 2 mmol) was added dropwise to the stirring solution of Fcdtc (0.373 g, 1 mmol). The obtained light yellow solution was additionally stirred for half an hour in an ice bath and followed by the addition of [Ni(Phen-dione)] (0.338 g, 1 mmol). Upon complete addition, the colour of the reaction mixture turned dark, red brown. The solution was stirred overnight. The solvent was evaporated and the obtained residue was washed with petroleum ether and dried under a vacuum.Synthesis of [Cu(Fcdtc)2(Phen-dione)]PF6 (Cu-Fc)
Methanol solution of potassium hexaflourophosphate (0.184 g, 1 mmol) was added dropwise into the stirring solution of Fcdtc (N-ethanol-N-methylferrocene dithiocarbamate) (0.186 g, 0.5 mmol). The obtained light yellow solution was stirred for half an hour in an ice bath followed by the addition of [Cu(Phen-dione)] (0.171 g, 0.5 mmol). Upon complete addition, the colour of the reaction mixture turned from brown to dark green and this was stirred overnight. The solvent was evaporated and obtained residue was washed with petroleum ether and dried under a vacuum.Fabrication of DSSCs
For the fabrication of DSSC, FTO (F-doped SnO2: purchased from Pilkington. Co. Ltd., 8Ω/γ) glass plates were cleaned in ethanol by using an ultrasonic bath for 30 min. FTO was used to prepare both the photo- and counter-electrodes. The TiO2 thin films were prepared using a commercial TiO2 paste (Ti-Nanoxide T, Solaronix) and using the doctor-blade technique onto the FTO substrate followed by calcination at 450 °C for 30 min. The sensitized and co-sensitized photoelectrodes were prepared by immersing the thin nanoporous TiO2 film (∼6 μm) in a 1![[thin space (1/6-em)]](https://www.rsc.org/images/entities/char_2009.gif) :
:![[thin space (1/6-em)]](https://www.rsc.org/images/entities/char_2009.gif) 1 ratio of DMF: ethanol solution of Co-Fc, Cu-Fc, Ni-Fc, and 1
1 ratio of DMF: ethanol solution of Co-Fc, Cu-Fc, Ni-Fc, and 1![[thin space (1/6-em)]](https://www.rsc.org/images/entities/char_2009.gif) :
:![[thin space (1/6-em)]](https://www.rsc.org/images/entities/char_2009.gif) 1 ratio of DMF: ethanol solution of Co-Fc/N719, Cu-Fc/N719, and Co-Fc/Cu-Fc/N719 correspondingly for 6 h and then washing with dichloromethane, followed by ethanol and drying at room temperature. The platinum counter-electrodes were prepared by screen printing of the Pt catalyst (Solaronix) on FTO and then sintering at 400 °C for 30 min. The dye-anchored TiO2 photoelectrodes and Pt counter-electrodes were assembled into face to face sandwich type assembly, which was sealed from three sides by using a hot-melt sealant film (Solaronix) as a spacer between the electrodes by heating it at 80 °C. A drop of electrolytic solution (0.05 M iodine, 0.05 M LiI, and 0.5 M 4-tert butylpyridine in acetonitrile) was placed on the open side of the cell assembly, which was driven inside the cell by capillary action and then the open side was closed by using Araldite followed by copper connection on both the electrodes with the help of silver paste and Araldite.
1 ratio of DMF: ethanol solution of Co-Fc/N719, Cu-Fc/N719, and Co-Fc/Cu-Fc/N719 correspondingly for 6 h and then washing with dichloromethane, followed by ethanol and drying at room temperature. The platinum counter-electrodes were prepared by screen printing of the Pt catalyst (Solaronix) on FTO and then sintering at 400 °C for 30 min. The dye-anchored TiO2 photoelectrodes and Pt counter-electrodes were assembled into face to face sandwich type assembly, which was sealed from three sides by using a hot-melt sealant film (Solaronix) as a spacer between the electrodes by heating it at 80 °C. A drop of electrolytic solution (0.05 M iodine, 0.05 M LiI, and 0.5 M 4-tert butylpyridine in acetonitrile) was placed on the open side of the cell assembly, which was driven inside the cell by capillary action and then the open side was closed by using Araldite followed by copper connection on both the electrodes with the help of silver paste and Araldite.
Characterization of DSSCs
The photoelectrochemical performance characteristics (short circuit current Jsc (mA cm−2), open-circuit voltage Voc (V), fill factor FF, and overall conversion efficiency η) were measured under illumination with a 1000 W xenon lamp (Oriel 91193) using a Keithley Model 2400. The light intensity was confirmed to be homogenous over an 8 × 8 in2 area by calibration with a Si solar cell for 1 sunlight intensity (AM 1.5G, 100 mW cm−2). An accidental increase in the temperature inside the cell was prevented using a cooler with a propeller. Incident photon-to-current conversion efficiency (IPCE) for the dyes was measured as a function of wavelength from 400–700 nm (PV Measurement Inc.) using a standard tungsten–halogen lamp as monochromatic light and a broadband bias light for approximating 1 sunlight intensity. The electrochemical impedance spectroscopy (EIS) was performed on a CH 660C electrochemical analyzer (CH Instruments, Shanghai, China) in a two-electrode configuration. The photoanode was used as a working electrode and the Pt electrode as a counter electrode. The electron transport properties were investigated using electrochemical impedance spectroscopy (EIS) with a 10 mV alternative signal in the frequency range of 10−2 to 105 Hz. UV-vis absorption spectra were recorded on a Shimadzu UV-3600 spectrometer. Cyclic voltammetry (CV) was performed using a Chenhua CHI760E model electrochemical workstation (Shanghai). The amount of dye loading on the TiO2 films was measured using a Shimadzu UV-3600 spectrometer. The sensitized electrodes were immersed in a 0.1 M NaOH solution in a mixed solvent 1![[thin space (1/6-em)]](https://www.rsc.org/images/entities/char_2009.gif) :
:![[thin space (1/6-em)]](https://www.rsc.org/images/entities/char_2009.gif) 1 of DCM
1 of DCM![[thin space (1/6-em)]](https://www.rsc.org/images/entities/char_2009.gif) :
:![[thin space (1/6-em)]](https://www.rsc.org/images/entities/char_2009.gif) ethanol, which resulted in the desorption of each dye. The dye loading amount can be estimated by using formula: C = AV/εSo (where C: is the amount of dye loading, A: is the optical absorbance of the dye, V: is the volume of desorption solution, ε: is the molar extinction coefficients and So: effective area of TiO2 films).
ethanol, which resulted in the desorption of each dye. The dye loading amount can be estimated by using formula: C = AV/εSo (where C: is the amount of dye loading, A: is the optical absorbance of the dye, V: is the volume of desorption solution, ε: is the molar extinction coefficients and So: effective area of TiO2 films).
Computational details
In order to assess the structures of all three sensitizers, density functional theory calculations were executed. The molecular geometries of all the three compounds were optimized using the B3LYP exchange-correlation functional.45 The MDF10 basis set for Fe, Co, Ni, and Cu was used, while the 6-31G** basis set for other atoms was used for geometry optimization. All calculations were performed using the Gaussian 09 program.46Conflicts of interest
The authors declare no conflicts of interest.Acknowledgements
Dr Mohd. Muddassir is grateful to Researchers Supporting Project number (RSP-2021/141), King Saud University, Riyadh, Saudi Arabia, for financial assistance. AK is grateful to the Research and Development, Department of Higher Education, UP Government for sanctioning project number 108/2021/2585/sattar-4-2021-4(28)/2021.References
- D. Raja, B. Selvaraj, G. Shanmugam, A. Maruthapillai and D. Sundaramurthy, Energy Fuels, 2021, 35, 4273–4282 CrossRef CAS.
- A. Y. Hoekstra and T. O. Wiedmann, Science, 2014, 344, 1114–1117 CrossRef CAS.
- X.-B. Li, C.-H. Tung and L.-Z. Wu, Nat. Rev. Chem., 2018, 2, 160–173 CrossRef CAS.
- C. Dragonetti and A. Colombo, Molecules, 2021, 26, 2461 CrossRef CAS PubMed.
- M. Kokkonen, P. Talebi, J. Zhou, S. Asgari, S. A. Soomro, F. Elsehrawy, J. Halme, S. Ahmad, A. Hagfeldt and S. G. Hashmi, J. Mater. Chem. A, 2021, 9, 10527–10545 RSC.
- B. O'Regan and M. Grätzel, Nature, 1991, 353, 737–740 CrossRef.
- (a) M. Grätzel, Nature, 2001, 414, 338–344 CrossRef; (b) H. L. Jia, S. S. Li, B. Q. Gong, L. Gu, Z. L. Bao and M. Y. Guan, Sustainable Energy Fuels, 2020, 4, 347–353 RSC.
- V. K. Singh, R. K. Kanaparthi and L. Giribabu, RSC Adv., 2014, 4, 6970–6984 RSC.
- P. S. Gangadhar, A. Jagadeesh, A. S. George, G. Reddy, S. Prasanthkumar, S. Soman and L. Giribabu, Mol. Syst. Des. Eng., 2021, 6, 779–789 RSC.
- M. V. Vinayak, T. M. Lakshmykanth, M. Yoosuf, S. Soman and K. R. Gopidas, Sol. Energy, 2016, 124, 227–241 CrossRef CAS.
- K. Kakiage, Y. Aoyama, T. Yano, K. Oya, J.-I. Fujisawa and M. Hanaya, Chem. Commun., 2015, 51, 15894–15897 RSC.
- L. Giribabu, R. K. Kanaparthi and V. Velkannan, Chem. Rec., 2012, 12, 306–328 CrossRef CAS PubMed.
- Q. Yu, Y. Wang, Z. Yi, N. Zu, J. Zhang, M. Zhang and P. Wang, ACS Nano, 2010, 4, 6032–6038 CrossRef CAS PubMed.
- Z.-S. Wang, Y. Cui, Y. Dan-oh, C. Kasada, A. Shinpo and K. Hara, J. Phys. Chem. C, 2007, 111, 7224–7230 CrossRef CAS.
- S. Ferrere and B. A. Greg, New J. Chem., 2002, 26, 1155 RSC.
- T. Horiuchi, H. Miura and S. Uchida, Chem. Commun., 2003, 24, 3036–3037 RSC.
- K. Devulapally, G. Reddy, S. Prasanthkumar, A. Jagadeesh, S. Soman and L. Giribabu, J. Porphyrins Phthalocyanines, 2021, 25, 407–417 CrossRef CAS.
- J. V. S. Krishna, D. Koteshwar, T. H. Chowdhury, S. P. Singh, I. Bedja, A. Islam and L. Giribabu, J. Mater. Chem. C, 2019, 7, 13594–13605 RSC.
- V. Nikalou, A. Charisiadis, S. Chalkiadaki, I. Alexandropolous, S. C. Pradhan and S. Soman, Polyhedron, 2018, 140, 9–18 CrossRef.
- V. K. Narra, H. Ullah, V. K. Singh, L. Giribabu, S. Senthilarasu, S. Z. Karazhanov, A. A. Tahir, T. K. Mallick and H. M. Upadhyaya, Polyhedron, 2015, 100, 313–320 CrossRef CAS.
- M. Urbani, M. Grätzel, M. K. Nazeeruddin and T. Torres, Chem. Rev., 2014, 114, 12330–12396 CrossRef CAS PubMed.
- S. Cherian and C. C. Wamser, J. Phys. Chem. B, 2000, 104, 3624–3629 CrossRef CAS.
- W. M. Campbell, K. W. Jolley, P. Wagner, K. Wagner, P. J. Walsh, K. C. Gordon, L. Schmidt-Mende, M. K. Nazeeruddin, Q. Wang and M. Grätzel, J. Phys. Chem. C, 2007, 111, 11760–11762 CrossRef CAS.
- A. Yella, H.-W. Lee, N. Tsao, C. H. Yi, A. K. Chandiran, M. K. Nazeeruddin, E. W.-G. Diau, C.-Y. Yeh, S. M. Zakeeruddin and M. Grätzel, Science, 2011, 334, 629–634 CrossRef CAS PubMed.
- S. Mathew, A. Yella, P. Gao, R. Humphry-Baker, B. F. E. Curchod, N. Ashari-Astani, I. Tavernelli, U. Rothlis-berger, M. K. Nazeeruddin and M. Grätzel, Nat. Chem., 2014, 6, 242–247 CrossRef CAS PubMed.
- J.-M. Ji, H. Zhou, Y. K. Eom, C. H. Kim and H. K. Kim, Adv. Energy Mater., 2020, 10, 2000124 CrossRef CAS.
- D. Koteshwar, S. Prashathkumar, S. P. Singh, T. H. Chaudhar, I. Bedja, A. Islam and L. Giribabu, Mater. Chem. Front., 2022, 6, 580–592 RSC.
- Y. K. Eom, S. H. Kang, I. T. Choi, Y. Yoo, J. Kim and H. K. Kim, J. Mater. Chem. A, 2017, 5, 2297–2308 RSC.
- N. V. Krishna, J. V. S. Krishna, S. P. Singh, L. Giribabu, L. Han, I. Bedja, R. K. Gupta and A. Islam, J. Phys. Chem. C, 2017, 121, 6464–6477 CrossRef CAS.
- F. Bonnìn-Ripoll, Y. B. Martynov, R.-G. Nazmitdinov, G. Cardona and R. Pujol-Nadal, Phys. Chem. Chem. Phys., 2021, 23, 26250–26262 RSC.
- M. Klikar, P. Solanke, J. Tydlitt and F. Bureš, Chem. Rec., 2016, 16, 1886 CrossRef CAS PubMed.
- (a) P. Solanke, S. Achelle, N. Cabon, O. Pytela, A. Barsella, B. Caro, F. Robin-le Guen, J. Podlesńy, M. KLikar and F. Burés, Dyes Pigm., 2016, 134, 129 CrossRef CAS; (b) J. Podlesný, O. Pytela, M. Klikar, V. Jelínková, I. V. Kityk, K. Ozga, J. Jedryka, M. Rudysh and F. Burés, Org. Biomol. Chem., 2019, 17, 3623 RSC; (c) P. Ledwon, Org. Electron., 2019, 75, 105422 CrossRef CAS; (d) M. Klikar, V. Jelínková, Z. Rüȥičkoă, T. Mikysek, O. Pytela, M. Ludwig and F. Burês, Eur. J. Org. Chem., 2017, 19, 2764–2779 CrossRef; (e) J. Kulhánek and F. Burês, Beilstein J. Org. Chem., 2012, 8, 25–49 CrossRef PubMed; (f) E. Novotňa, I. V. Kityk, O. Pytela, F. Burês, M. Ludwig, M. Klikar, K. Ozga and J. Jedryka, ChemPlusChem, 2020, 85, 1549 CrossRef PubMed.
- (a) S. Kaur, M. Kaur, P. Kaur, K. Clays and K. Singh, Coord. Chem. Rev., 2017, 343, 185 CrossRef CAS; (b) D. Brunel, G. Noirbent and F. Dumur, Dyes Pigm., 2019, 170, 107611 CrossRef CAS.
- (a) R. Chauhan, M. Trivedi, L. Bahadur and A. Kumar, Chem.–Asian J., 2011, 6(6), 1525–1532 CrossRef CAS; (b) A. Singh, P. Singh, G. Kociok-Köhn, M. Trivedi, A. Kumar, R. Chauhan, S. B. Rane, C. Terashima, S. W. Gosavi and A. Fujishima, New J. Chem., 2018, 42, 9306–9316 RSC; (c) A. Singh, G. Kociok- Köhn, M. Trivedi, R. Chauhan, A. Kumar, S. W. Gosavi, C. Terashima and A. Fujishima, New J. Chem., 2019, 43, 4745–4756 RSC; (d) R. Yadav, A. Singh, G. Koiciok-Köhn, R. Chauhan, A. Kumar and S. Gosavi, New J. Chem., 2017, 41, 7312–7321 RSC; (e) J. J. Dannenberg and J. H. Richards, J. Am. Chem. Soc., 1965, 87, 71626–711627 CrossRef; (f) S. Sönmezoğlu, C. Akyürek and S. AkÍn, J. Phys. D, 2021, 45, 425101 CrossRef.
- (a) J.-F. Yin, M. Velayudham, D. Bhattacharya, H.-C. Lin and K.-L. Lu, Coord. Chem. Rev., 2012, 256, 3008 CrossRef CAS; (b) S. Ardo and G. J. Meyer, Chem. Soc. Rev., 2009, 38, 115 RSC; (c) C.-Y. Chen, M. Wang, J.-Y. Li, N. Pootrakulchote, L. Alibabaei, C. Ngoc-le, J.-D. Decoppet, J.-H. Tsai, C.-G. Wu, S. M. Zakeeruddin and M. Grätzel, ACS Nano, 2009, 3, 3103 CrossRef CAS PubMed.
- (a) E. A. M. Geary, L. J. Yellowlees, L. A. Jack, I. D. H. Oswald, S. Parsons, N. Hirata, J. R. Durrant and N. Robertson, Inorg. Chem., 2005, 44, 242–250 CrossRef CAS PubMed; (b) R. Yadav, M. Trivedi, G. Kociok-Köhn, R. Chauhan, A. Kumar and S. W. Gosavi, Eur. J. Inorg. Chem., 2016, 6, 1013–1021 CrossRef; (c) C. Gautam, A. Singh, S. W. Gosavi, R. Chauhan, V. K. Sharma, A. Alarifi, M. Afzal, M. Muddassir and A. Kumar, Appl. Organomet. Chem., 2022, 36, e6608 CrossRef CAS.
- (a) A. Islam, H. Sugihara, K. Hara, L. P. Singh, R. Katoh, M. Yanagida, Y. Takahashe, S. Murata and H. Arakawa, Inorg. Chem., 2001, 40, 5371 CrossRef CAS PubMed; (b) C. A. Goss and H. D. Abruna, Inorg. Chem., 1985, 24(25), 4263–4267 CrossRef CAS; (c) A. Singh, A. Dutta, A. K. Singh, M. Trivedi, G. Kociok- Köhn, M. Muddassir and A. Kumar, Appl. Organomet. Chem., 2020, 34, e5879 CAS; (d) C. Gautam, A. Singh, S. W. Gosavi, R. Chauhan, V. K. sharma, A. Alarifi, M. Afzal, M. Muddassir and A. Kumar, Appl. Organomet. Chem., 2022, 36, e6608 CrossRef CAS; (e) A. Kumar, R. Chauhan, K. C. Molloy, G. Kociok-Köhn, L. Bahadur and N. Singh, Chem.–Eur. J., 2010, 16, 4307–4314 CrossRef CAS; (f) R. Yadav, Y. Waghadkar, G. Kociok-Köhn, A. Kumar, S. B. Rane and R. Chauhan, Opt. Mater., 2016, 62, 176–183 CrossRef CAS; (g) G. Gurumoorthy, P. J. Rani, S. Thirumaran and S. Ciattini, Inorg. Chim. Acta, 2017, 455, 132–139 CrossRef CAS; (h) K. Larsson and L. Öhrström, Inorg. Chim. Acta, 2004, 357, 657–664 CrossRef CAS; (i) I. Warada, F. F. Awwadi, M. Daqqa, A. A. Ali, T. S. Ababneh, T. M. A. AlShboul, T. M. A. Jazzazi, F. Al-Rimawi, T. Ben Hadda and Y. N. Mabkhotg, J. Photochem. Photobiol., B, 2017, 171, 9–19 CrossRef PubMed.
- (a) A. Singh, A. Dutta, D. Srivasatava, G. Kociok-Köhn, R. Chauhan, S. W. Gosavi, A. Kumar and M. Moddassir, Appl. Organomet. Chem., 2021, e6402 CAS; (b) M. N. Chaur Valencia, H. F. Z. Corrables and G. Martìnez, Rev. Colomb. Quim., 2018, 47, 45–53 CrossRef.
- S. Ashoka, G. Nagaraju, C. N. Tharamani and G. T. Chandrapp, Mater. Lett., 2009, 63, 873–876 CrossRef CAS.
- A. Zhang, Z. Wang, H. Ouyang, W. Lyu, J. Sun, Y. Cheng and B. Fu, Nanomaterials, 2021, 11(7), 1778 CrossRef CAS PubMed.
- C. S. Chou, R.-Y. Yang, C.-K. Kuo and Y.-J. Lin, Powder Technol., 2009, 194, 95–105 CrossRef CAS.
- K. Matsumoto, N. Saito, T. Mitate, J. Hojo, M. Inada and H. Haneda, Cryst. Growth Des., 2009, 9, 5014 CrossRef CAS.
- (a) S. A. Miltsov, V. S. Karavan and V. A. Borin, J. Gen. Chem., 2019, 89, 1055–1057 CrossRef CAS; (b) L. Calucci, G. Pampaloni, C. Pinzino and A. Prescimone, Inorg. Chim. Acta, 2006, 359, 3911–3920 CrossRef CAS.
- (a) L. Wie, Y. Yang, F. Fan, Y. Na, P. Wang, Y. Dong, B. Yang and W. Cao, Dalton Trans., 2014, 43, 11361 RSC; (b) S. Gao, R. Q. Fan, X. M. Wang, L. S. Qiang, L. G. Wei, P. Wang, H. J. Zhang, Y. L. Yang and Y. L. Wang, J. Mater. Chem. A, 2015, 3, 6053–6063 RSC; (c) S. Gao, R. Q. Fan, X. M. Wang, L. S. Qiang, L. G. Wei, P. Wang, Y. L. Yang and Y. L. Wang, Dalton Trans., 2015, 44, 18187–18195 RSC; (d) M. Muddassir, A. Alarifi, A. A. Y. Abduh and M. Afzal, J. Mol. Struct., 2021, 1246, 131191 CrossRef CAS.
- (a) A. D. Becke, J. Chem. Phys., 1993, 98, 5648 CrossRef CAS; (b) C. T. Lee, W. T. Yang and R. G. Parr, Phys. Rev. B: Condens. Matter Mater. Phys., 1998, 37, 1133 Search PubMed.
- M. J. Frisch, G. W. Trucks, H. B. Schlegel, G. E. Scuseria, M. A. Robb, J. R. Cheeseman, J. A. Montgomery, T. Vreven Jr, K. N. Kudin, J. C. Burant, J. M. Millam, S. S. Iyengar, J. Tomasi, V. Barone, B. Mennucci, M. Cossi, G. Scalmani, N. Rega, G. A. Petersson, H. Nakatsuji, M. Hada, M. Ehara, K. Toyota, R. Fukuda, J. Hasegawa, M. Ishida, T. Nakajima, Y. Honda, O. Kitao, H. Nakai, M. Klene, X. Li, J. E. Knox, H. P. Hratchian, J. B. Cross, V. Bakken, C. Adamo, J. Jaramillo, R. Gomperts, R. E. Stratmann, O. Yazyev, A. J. Austin, R. Cammi, C. Pomelli, J. W. Ochterski, P. Y. Ayala, K. Morokuma, G. A. Voth, P. Salvador, J. J. Dannenberg, V. G. Zakrzewski, S. Dapprich, A. D. Daniels, M. C. Strain, O. Farkas, D. K. Malick, A. D. Rabuck, K. Raghavachari, J. B. Foresman, J. V. Ortiz, Q. Cui, A. G. Baboul, S. Clifford, J. Cioslowski, B. B. Stefanov, G. Liu, A. Liashenko, P. Piskorz, I. Komaromi, R. L. Martin, D. J. Fox, T. Keith, M. A. Al-Laham, C. Y. Peng, A. Nanayakkara, M. Challacombe, P. M. W. Gill, B. Johnson, W. Chen, W. M. Wong, C. Gonzalez and J. A. Pople, Gaussian 09, revision B.01, Gaussian, Inc., Wallingford CT, 2009 Search PubMed.
Footnote |
| † Electronic supplementary information (ESI) available. See https://doi.org/10.1039/d2ra05601a |
| This journal is © The Royal Society of Chemistry 2022 |

