 Open Access Article
Development and validation of molnupiravir assessment in bulk powder and pharmaceutical formulation by the RP-HPLC-UV method
Abdelaziz M. Annadia,
Noha M. El Zaharbc,
Nour El-Din A. Abdel-Sattara,
Ekram H. Mohamed d,
Safwat A. Mahmoud*e and
Mohamed S. Attia
 *a
*a
aChemistry Department, Faculty of Science, Ain Shams University, Abbassia, Cairo, 11566, Egypt. E-mail: mohd_mostafa@sci.asu.edu.eg
bPharmaceutical Analytical Chemistry Department, Faculty of Pharmacy, Ain Shams University, Organization of African Unity Street, Abbassia, Cairo 11566, Egypt
cMedicinal Chemistry Department, Faculty of Pharmacy, King Salman International University, Ras-Sedr, South Sinai, Egypt
dPharmaceutical Chemistry Department, Faculty of Pharmacy, The British University in Egypt, ElSherouk City, Cairo, Egypt
ePhysics Department, Faculty of Science, Northern Border University, Arar, Saudi Arabia. E-mail: samahmoud2002@yahoo.com
First published on 30th November 2022
Abstract
An accurate, sensitive and selective RP-HPLC-UV method has been established for the estimation of Molnupiravir (MOL) in pure bulk powder and pharmaceutical formulation. Separation was achieved on an Inertsil C18 column (150.0 mm × 4.6 mm, 5.0 μm), using a mobile phase of 20 mM phosphate buffer pH 2.5![[thin space (1/6-em)]](https://www.rsc.org/images/entities/char_2009.gif) :
:![[thin space (1/6-em)]](https://www.rsc.org/images/entities/char_2009.gif) acetonitrile (80
acetonitrile (80![[thin space (1/6-em)]](https://www.rsc.org/images/entities/char_2009.gif) :
:![[thin space (1/6-em)]](https://www.rsc.org/images/entities/char_2009.gif) 20, v/v%) in isocratic mode with a flow rate of 1.0 mL min−1. The λmax of MOL prepared in the chosen diluent (ethanol
20, v/v%) in isocratic mode with a flow rate of 1.0 mL min−1. The λmax of MOL prepared in the chosen diluent (ethanol![[thin space (1/6-em)]](https://www.rsc.org/images/entities/char_2009.gif) :
:![[thin space (1/6-em)]](https://www.rsc.org/images/entities/char_2009.gif) water in equal proportions) was found to be 230.0 nm. The constructed calibration curve was found to be linear in the concentration range of 0.2–80.0 μg mL−1. The recovery% of MOL using the proposed method was 100.29%. The limit of detection (LOD) and limit of quantification (LOQ) were 0.04 μg mL−1 and 0.12 μg mL−1, respectively. No significant interference was detected in the presence of the common pharmaceutical formulation excipients. The method was validated following the ICH recommendations. All the obtained results were statistically compared with those using reported methods and there were no significant differences. The method developed in this work was successfully employed for the assessment of MOL in bulk powder and pharmaceutical formulation.
water in equal proportions) was found to be 230.0 nm. The constructed calibration curve was found to be linear in the concentration range of 0.2–80.0 μg mL−1. The recovery% of MOL using the proposed method was 100.29%. The limit of detection (LOD) and limit of quantification (LOQ) were 0.04 μg mL−1 and 0.12 μg mL−1, respectively. No significant interference was detected in the presence of the common pharmaceutical formulation excipients. The method was validated following the ICH recommendations. All the obtained results were statistically compared with those using reported methods and there were no significant differences. The method developed in this work was successfully employed for the assessment of MOL in bulk powder and pharmaceutical formulation.
Introduction
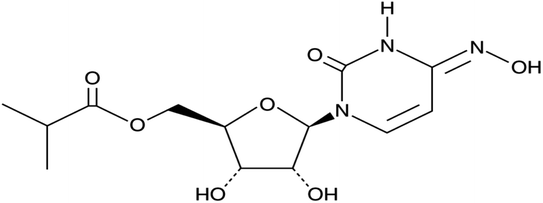
The rise of SARS-CoV-2 variants of concern (VoCs) has aggravated the COVID-19 pandemic situation. The existing monoclonal antibodies and vaccines have reduced efficacy against these VoCs to some extent. Antivirals play an important role in affecting the conserved proteins of SARS-CoV-2. They are not usually affected by VoC mutations and thus should be efficient against the arising variants. The orally available antiviral MOL (molnupiravir, MK-4482, EIDD-2801) effectively inhibits certain RNA virus replication and so has been ascertained to be active against infections caused by different variants of SARS-CoV-2.1–4 MOL shows strong potential resistance against the emerging VoCs where the initial efficacy data in COVID-19 patients have been recently revealed.5–10 Consequently, MOL represents a promising cost-effective cure for the treatment of COVID-19 while demonstrating high safety and efficacy in ongoing clinical trials.11–15 MOL is considered to be the first oral, direct-acting antiviral proved to be extremely efficient at reducing nasopharyngeal SARS-CoV-2 infective virus and viral RNA.16–19 The chemical structure of MOL is shown in Fig. 1.To the best of our knowledge, no simple RP-HPLC-UV methods for the determination of MOL in bulk and pharmaceutical formulations have been previously reported. A literature review reveals limited methods for analysis, with no clear, well-defined, validated methods (Table 1). MOL levels have been quantified using LC-MS/MS in human plasma17 and animal models,20 while the validation parameters have not been completely reported. One validated method has been described for quantifying MOL and its metabolite by LC-MS/MS in human plasma and saliva.21 Herein, a simple RP-HPLC-UV method was established and validated for the assessment of MOL in bulk powder and pharmaceutical formulation as per ICH guidelines.
| Method | Mobile phase | Stationary phase | Linear range μg mL−1 | Ref. |
|---|---|---|---|---|
| LC-MS-MS | 1 mM ammonium acetate in water (pH 4.3) and 1 mM ammonium acetate in acetonitrile | Polar atlantis C18 column | 2.5–5000 ng ml−1 | 21 |
| LC | Ammonium formate and ACN | Waters Xselect HSS T3 (75 × 4.6 mm, 2.5 μm) | — | 22 |
| RP-HPLC-PDA | ACN![[thin space (1/6-em)]](https://www.rsc.org/images/entities/char_2009.gif) : :![[thin space (1/6-em)]](https://www.rsc.org/images/entities/char_2009.gif) water (20 water (20![[thin space (1/6-em)]](https://www.rsc.org/images/entities/char_2009.gif) : :![[thin space (1/6-em)]](https://www.rsc.org/images/entities/char_2009.gif) 80 v/v) 80 v/v) |
Discovery® HS C18 column (75 × 4.6 mm, 3 μm) | 0.1–60.0 | 23 |
| RP-HPLC-UV | 20 mM phosphate buffer pH 2.5![[thin space (1/6-em)]](https://www.rsc.org/images/entities/char_2009.gif) : :![[thin space (1/6-em)]](https://www.rsc.org/images/entities/char_2009.gif) acetonitrile; 80 acetonitrile; 80![[thin space (1/6-em)]](https://www.rsc.org/images/entities/char_2009.gif) : :![[thin space (1/6-em)]](https://www.rsc.org/images/entities/char_2009.gif) 20, v/v% 20, v/v% |
Inertsil C18 column (150 × 4.6 mm, 5 μm) | 0.2–80.0 | This work |
Experimental
Materials and reagents
MOL, purity 98%, was obtained from Optimus Drugs Pvt LTD, India. 200 mg per capsule (R&D prepared samples) was used as the pharmaceutical formulation dosage form. American Society for Testing and Materials (ASTM) grade I water was obtained daily from the central laboratory. Potassium dihydrogen phosphate, sodium dihydrogen phosphate, dipotassium hydrogen phosphate, o-phosphoric acid, acetic acid, and anhydrous sodium acetate were supplied by Scharlau, Barcelona, Spain. The solvents used, such as acetonitrile, ethanol and methanol, were also supplied by Scharlau, Barcelona, Spain.The chosen diluent for standard and test sample preparation was a mixture of ethanol and water in equal proportions.
Apparatus
An electronic balance, pH meter (Mettler Toledo, 235, MA, USA), sonicator and UV-visible spectrophotometer (Shimadzu UV JAPAN 1801) were used for development of the method. Chromatographic separation and analysis were conducted using high-performance liquid chromatography with a PDA-detector Agilent 1260 HPLC system (Deutschland GmbH, Waldbronn, Germany).MOL solubility measurements in different solvents
For each solvent, about 500 mg of MOL was transferred into 10 mL of solvent, sonicated for 1 h at 37 °C, and then cooled to room temperature to yield the stock solution, which was then diluted to be in the targeted concentration range of the MOL assay method. The recovery amount (mg mL−1) was reported for each solvent.Preparation of stock and standard solutions
20.0 mg of MOL was dissolved in 100 mL of diluent to yield the stock solution, which was then diluted to prepare different standard solutions in the concentration range 0.2–80.0 μg mL−1 for the MOL assay method calibration curve.Chromatographic conditions
MOL was analyzed using an Inertsil C18 column (150.0 × 4.6 mm, 5 μm) and a mobile phase of 20 mM phosphate buffer pH 2.5![[thin space (1/6-em)]](https://www.rsc.org/images/entities/char_2009.gif) :
:![[thin space (1/6-em)]](https://www.rsc.org/images/entities/char_2009.gif) acetonitrile (80
acetonitrile (80![[thin space (1/6-em)]](https://www.rsc.org/images/entities/char_2009.gif) :
:![[thin space (1/6-em)]](https://www.rsc.org/images/entities/char_2009.gif) 20, v/v%) in isocratic mode, with a flow rate of 1.0 mL min−1. The buffer was filtered using a 0.45 μm nylon membrane filter, and the used mobile phase was stable for more than 5 days without any physical changes or any fluctuation in the system's suitability parameters. The wavelength of detection was adjusted to be 230.0 nm. The temperature was set to 30 °C for the column, and 25 °C for the sample tray. The injection volume was 50.0 μL.
20, v/v%) in isocratic mode, with a flow rate of 1.0 mL min−1. The buffer was filtered using a 0.45 μm nylon membrane filter, and the used mobile phase was stable for more than 5 days without any physical changes or any fluctuation in the system's suitability parameters. The wavelength of detection was adjusted to be 230.0 nm. The temperature was set to 30 °C for the column, and 25 °C for the sample tray. The injection volume was 50.0 μL.
Method validation
The analytical method was suitably developed and validated, regarding the accuracy, precision, linearity, specificity, limit of detection (LOD) and the quantification limit (LOQ), in agreement with the requirements of the ICH guidelines.24–38Linearity
Standard solutions in the concentration range 0.2–80.0 μg mL−1 for MOL were injected into the RP-HPLC-UV system. Each solution was measured three times. The response signal was measured at 230.0 nm. The calibration curve was constructed using the corresponding concentrations for each response signal, and the regression equation was computed.Accuracy
The accuracy of the method is the proximity between the true quantity and the test result. The values of the method recovery reflect the accuracy of the procedure, and this was done by spiking the active drug to the placebo at three different concentrations (5, 10 and 20 μg mL−1).Precision
The precision of the method was checked by measuring a 10.0 μg mL−1 standard solution of MOL six times. The precision was evaluated on three different levels: repeatability (six determinations of the standard solution), intraday (analyst I and analyst II) and interday (day I and day II). Each analyst prepared six different tests. The peak areas as the recovery% were determined and compared. The percentage relative standard deviation RSD% was used as an indicator for precision, and should be less than 2.0%.Selectivity
The selectivity was evaluated by measuring the response of the blank, placebo, and analyte samples and any potential or identified species such as the formulation excipients. No response that interferes with the analyte's response should be obtained.Detection and quantification limits
The LOD is the lowest level of analyte that gives a qualitative response, while the LOQ is the lowest concentration that can be quantified consistently with a defined level of recovery and precision. The LOD and LOQ were calculated as per ICH guidelines.24–38Robustness
The robustness of the optimized method was investigated by assessing small deliberate changes in the values in the method development parameters such as the column temperature and buffer pH value. The quantitative effect of the variables was determined by considering the value of the recovery%, and the acceptable limits should be ±2% for the peak response and retention times of the analyte.Solution stability
The stability of the sample solutions was evaluated by analyzing a known MOL concentration (10.0 μg mL−1). Replicates (n = 3) were exposed to different temperature conditions, including lab temperature (15–25 °C) for 8, 12 and 24 h, cooling temperature (5 ± 3 °C) for 5 days, and freezer temperature (−20 °C) for 10 days. The results were investigated by comparing them with those from the assays of freshly prepared solutions of reference standards.23Applications to pharmaceutical formulation
Standard solution preparation
20 mg of MOL was dissolved in 100 mL of diluent to yield solution A. Then, 5 mL from solution A was diluted into 100 mL of diluent, and filtered using a 0.45 μm nylon syringe filter. The first 5 mL was discarded, and the nominal concentration was 0.01 mg mL−1.Test solution preparation
The content of ten capsules (MOL 200 mg per capsule, R & D prepared samples) was mixed well and ground to a fine powder. The weight equivalent to 20 mg of MOL was dissolved in a 100 mL volumetric flask containing 80 mL of diluent, then sonicated for 15 min at 25 °C and diluted to the required volume with diluent. 5.0 mL of this ethanolic solution was diluted in a 100 mL volumetric flask using the same diluent, and filtered using a 0.45 μm nylon syringe filter. The first 5 mL was discarded, and the nominal concentration was 0.01 mg mL−1.Results and discussion
Optimization of experimental parameters
In the RP-HPLC-UV method, initial trials were performed with the aim to select the most suitable chromatographic condition parameters. These parameters, such as the solvent, mobile phase components and their percentages, detection wavelength, pH value, type of column and concentration range for the target standard solutions, were carefully studied.Solvent and diluent selection
MOL is soluble in water (5.8 mg mL−1),39 phosphate buffer pH 7.2 (1 mg mL−1), ethanol (28 mg mL−1), DMF (30 mg mL−1), DMSO (30 mg mL−1),40 methanol (24 mg mL−1) and acetonitrile (1.4 mg mL−1) (Fig. 2). Thus, the stock and working standard solutions were prepared in ethanol![[thin space (1/6-em)]](https://www.rsc.org/images/entities/char_2009.gif) :
:![[thin space (1/6-em)]](https://www.rsc.org/images/entities/char_2009.gif) water (1
water (1![[thin space (1/6-em)]](https://www.rsc.org/images/entities/char_2009.gif) :
:![[thin space (1/6-em)]](https://www.rsc.org/images/entities/char_2009.gif) 1, v/v) as the diluent.
1, v/v) as the diluent.
Wavelength selection
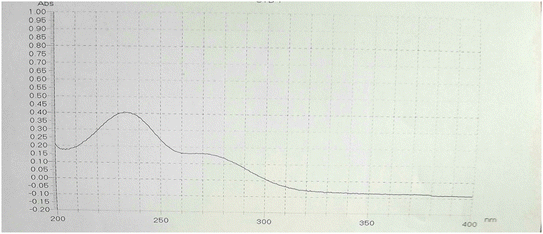
The UV spectrum of MOL was recorded by scanning the wavelength range of 200.0–400.0 nm (Fig. 3). Two absorbance peaks were observed at 230.0 and 270.0 nm.40 From the UV spectrum, a wavelength of 230.0 nm was selected as the maximum wavelength.Organic modifier selection
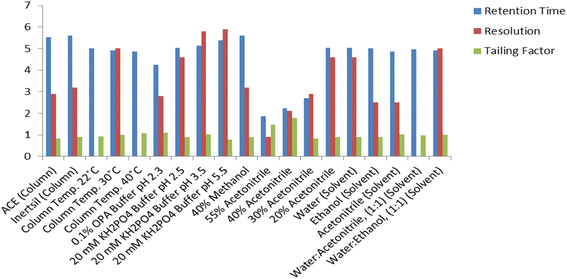
Different ratios of methanol (40–60%, v/v) and acetonitrile (10–40%, v/v) as organic modifiers were evaluated (Fig. 4 and 5). The results show that methanol gives a longer run time than acetonitrile and causes peak broadening. Using a mixture of acetonitrile and buffer gives better separation and resolution for the investigated drug.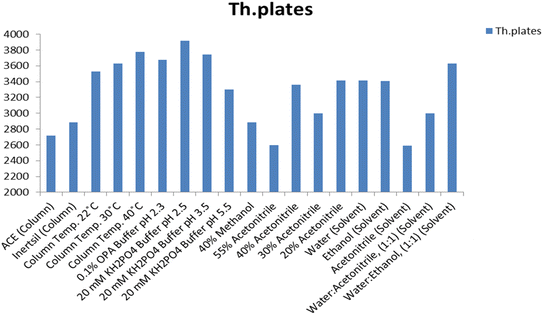 | ||
| Fig. 5 Effect of the change of the chromatographic parameters on the theoretical (Th.) plates of the MOL peak using the Inertsil column. | ||
Moreover, as the ratio of methanol in the mobile phase decreases, the retention of MOL increases. Therefore, acetonitrile was chosen as the organic modifier of choice as it permitted the separation of MOL within a short analytical run time, a favorable resolution factor and exceptional sensitivity.
Buffer selection
Several buffers in different proportions were tested including phosphate buffer with varying strength (5.0–30.0 mM). The results revealed that 20.0 mM phosphate buffer resulted in a stable baseline and sharp peak. Similarly, 0.1% o-phosphoric acid solution as a buffer was tested and gives a stable baseline and a sharp peak shape but with low resolution. The 20.0 mM phosphate buffer was used as the buffer of choice throughout this study (Fig. 4 and 5).Buffer pH selection
The effect of varying the mobile phase pH on the selectivity and retention times of MOL was studied using mobile phases adjusted to different pH values ranging from 2.5 to 5.5. The pKa of MOL is 8.21;25 hence variation of the pH value of the mobile phase did not meaningfully affect the retention time. A pH value of 2.5 was chosen as the most suitable pH value, generating well-defined symmetrical peaks for MOL with high sensitivity through a short analytical run time (Fig. 4 and 5).Column selection
Different brands of C18 (150.0 × 4.6 mm, 5.0 μm) column were tested. Inertsil had a longer run time than ACE, which exhibited low resolution (Fig. 4 and 5). Hence, the Inertsil column was used in this method.System suitability
The main reason for carrying out system suitability tests was to verify the equipment performance; the RSD% for the average area for six replicate injections of the working standard was calculated.In the RP-HPLC method, the RSD% for the peak area was found to be less than 1.5%. The tailing parameter for the analyte peak was found to be not more than 1.2 and the theoretical plates were not less than 3000.
Selectivity
No significant responses for the diluent or placebo (formulation excipients) were detected at the given retention time of MOL (Fig. 6). These results demonstrate that the proposed method is selective for MOL quantification in bulk powder and pharmaceutical formulation. The peak purity index was more than 0.9992 for all preparations.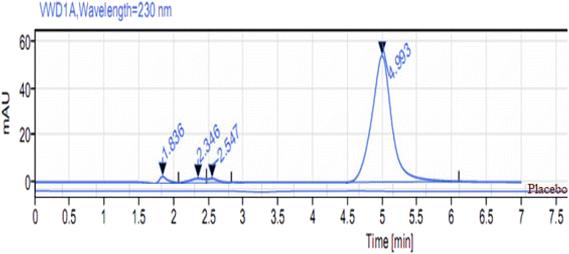 | ||
Fig. 6 HPLC chromatogram of the placebo and MOL (10 μg mL−1) at 4.9 min in ethanol![[thin space (1/6-em)]](https://www.rsc.org/images/entities/char_2009.gif) : :![[thin space (1/6-em)]](https://www.rsc.org/images/entities/char_2009.gif) water (1 water (1![[thin space (1/6-em)]](https://www.rsc.org/images/entities/char_2009.gif) : :![[thin space (1/6-em)]](https://www.rsc.org/images/entities/char_2009.gif) 1, v/v) at λmax = 230 nm, using the Inertsil column. 1, v/v) at λmax = 230 nm, using the Inertsil column. | ||
Linearity and range
The MOL standard calibration curve was linear with RSD% less than 1% based on three successive readings, and the correlation coefficient r2 was 1.0, showing that the adopted HPLC method had outstanding linearity over the concentration range 0.2–80.0 μg mL−1 for MOL.Accuracy and recovery
The accuracy of the method was assessed by using recovery studies with different levels of spiking. At each level, three determinations were achieved and the results were recorded. The percent recovery values were calculated and were found to be within the limit (100.67, 99.96 and 100.24%) with RSD% of 0.36, 0.45 and 0.30, as shown in Table 2.| Parameter | MOL |
|---|---|
| Linear range (μg mL−1) | 0.2–80 |
| SD of the calibration curve | 1.339 |
| Correlation coefficient (r2) | 1.0 |
| Equation of calibration curve | y = 110.43x + 1.1332 |
| Accuracy levels | 5, 10 and 20 μg mL−1 |
| Recovery% | 100.67, 99.96 and 100.24% |
| RSD% | 0.36, 0.45 and 0.30% |
| Precision | |
| Intraday precision RSD% | 0.51% |
| Interday precision RSD% | 0.57% |
| LOD (μg mL−1) | 0.04 |
| LOQ (μg mL−1) | 0.12 |
Precision
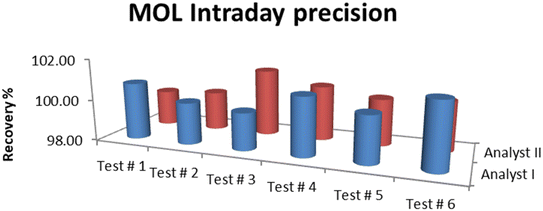
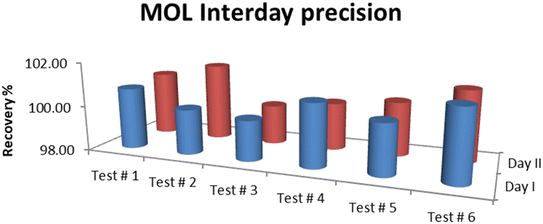
The results of precision tests performed on the standard solutions of MOL showed that the RSD% was in the acceptable range. The average assay for intraday (analyst I and analyst II) precision was 100.42% with RSD 0.51% while the interday (day I and day II) precision was 100.56% with RSD 0.57%. RSD% was 0.34 for the repeatability of six determinations of the standard solution. Therefore, the method precision was confirmed to be satisfactory, and the results are summarized in Fig. 7 and 8.Robustness
The recovery% and retention time were not affected by increasing the column temperature from 25 to 35 °C or by increasing the pH value from 2.5 to 5.5, while the theoretical plates are increased by an increase in column temperature and a decrease in pH value (Fig. 4 and 5). The findings indicated that minor modifications in the values provided for the chromatographic conditions do not influence the outcomes for the recovery and retention time of MOL. According to ICH, the evaluation of robustness should be considered during the development phase and depends on the type of procedure under study. Therefore, we used the results from the optimization of the experimental parameters as a guide. Fig. 4 and 5 indicate that even when the changes in the chromatographic parameters were large, the method was still robust.Stability of the solution
The stability of the MOL solutions was investigated. The results confirmed that the solutions were stable for 12 h at room temperature (15–25 °C) as the assay% decreased from 100 to 94% and small peaks appeared at 2.3 and 2.5 min, indicating that the MOL was hydrolyzed. Additionally, MOL was stable for 5 days at a cool temperature (5 ± 3 °C) and 10 days in a freezer (−20 °C), stored in amber colored flasks protected from the light. We don't recommend storing the aqueous solution for more than one day.40Applications of the proposed method
The assay results are shown in Table 3. The average of three determinations for the MOL 200 mg capsule (R & D sample) assay was 100.58% and the RSD% was 0.54.| Exp. # | MOL assay% |
|---|---|
| I | 100.14 |
| II | 100.42 |
| III | 101.19 |
| Average | 100.58 |
| RSD% | 0.54 |
Statistical analysis
All the results obtained by the proposed HPLC method were compared with those obtained by the reported method for MOL,23 and no significant difference between the methods was observed, as shown in Table 4.Conclusions
In this work, a simple, fast and reliable RP-HPLC-UV method was optimized and validated according to the ICH guidelines for the determination of MOL in bulk and pharmaceutical formulation. The optimized method demonstrated excellent linearity, sensitivity, recovery, precision and selectivity. The established method was effectively implemented to analyze the studied drug, and it is suggested that this can be applied successfully to the routine work of quality control.Conflicts of interest
The authors declare no conflict of interest.Acknowledgements
Authors extend their appreciation to the Deputyship for Research & Innovation, Ministry of Education in Saudi Arabia for funding this research work through the project number “IF_2020_NBU_242”.References
- R. Abdelnabi, C. S. Foo, S. De Jonghe, P. Maes, B. Weynand and J. Neyts, Molnupiravir Inhibits Replication of the Emerging SARS-CoV-2 Variants of Concern in a Hamster Infection Model, J. Infect. Dis., 2021, 224(5), 749–753 CrossRef CAS PubMed.
- C. J. Gordon, E. P. Tchesnokov, R. F. Schinazi and M. Gotte, Molnupiravir promotes SARS-CoV-2 mutagenesis via the RNA template, J. Biol. Chem., 2021, 297(1), 100770 CrossRef CAS PubMed.
- F. Graham, Daily briefing: Inside Merck’s COVID drug, molnupiravir, Nature, 2021 DOI:10.1038/d41586-021-02792-0.
- W. Holman, W. Holman, S. McIntosh, W. Painter, G. Painter and J. Bush, et al., Accelerated first-in-human clinical trial of EIDD-2801/MK-4482 (molnupiravir), a ribonucleoside analog with potent antiviral activity against SARS-CoV-2, Trials, 2021, 22(1), 561 CrossRef CAS PubMed.
- R. Abdelnabi, C. S. Foo, S. J. F. Kaptein, X. Zhang, T. N. D. Do and L. Langendries, et al., The combined treatment of Molnupiravir and Favipiravir results in a potentiation of antiviral efficacy in a SARS-CoV-2 hamster infection model, EBioMedicine, 2021, 72, 103595 CrossRef CAS PubMed.
- M. Imran, M. Kumar Arora, S. M. B. Asdaq, S. A. Khan, S. I. Alaqel and M. K. Alshammari, et al., Discovery, Development, and Patent Trends on Molnupiravir: A Prospective Oral Treatment for COVID-19, Molecules, 2021, 26(19), 5795 CrossRef CAS.
- F. Kabinger, C. Stiller, J. Schmitzova, C. Dienemann, G. Kokic and H. S. Hillen, et al., Mechanism of molnupiravir-induced SARS-CoV-2 mutagenesis, Nat. Struct. Mol. Biol., 2021, 28(9), 740–746 CrossRef CAS PubMed.
- S. H. Khoo, R. Fitzgerald, T. Fletcher, S. Ewings, T. Jaki and R. Lyon, et al., Optimal dose and safety of molnupiravir in patients with early SARS-CoV-2: a Phase I, open-label, dose-escalating, randomized controlled study, J. Antimicrob. Chemother., 2021, 76(12), 3286–3295 CrossRef CAS PubMed.
- E. Mahase, Covid-19: Molnupiravir reduces risk of hospital admission or death by 50% in patients at risk, MSD reports, Bmj, 2021, 375, n2422 CrossRef PubMed.
- B. Malone and E. A. Campbell, Publisher Correction: Molnupiravir: coding for catastrophe, Nat. Struct. Mol. Biol., 2021, 28(11), 955 CrossRef CAS PubMed.
- G. P. Ahlqvist, C. P. McGeough, C. Senanayake, J. D. Armstrong, A. Yadaw and S. Roy, et al., Progress Toward a Large-Scale Synthesis of Molnupiravir (MK-4482, EIDD-2801) from Cytidine, ACS Omega, 2021, 6(15), 10396–10402 CrossRef CAS PubMed.
- B. Malone and E. A. Campbell, Molnupiravir: coding for catastrophe, Nat. Struct. Mol. Biol., 2021, 28(9), 706–708 CrossRef CAS PubMed.
- L. Menendez-Arias, Decoding molnupiravir-induced mutagenesis in SARS-CoV-2, J. Biol. Chem., 2021, 297(1), 100867 CrossRef CAS PubMed.
- G. R. Painter, M. G. Natchus, O. Cohen, W. Holman and W. P. Painter, Developing a direct acting, orally available antiviral agent in a pandemic: the evolution of molnupiravir as a potential treatment for COVID-19, Curr. Opin. Virol., 2021, 50, 17–22 CrossRef CAS PubMed.
- J. Reina, Plitidepsin, an inhibitor of the cell elongation factor eEF1a, and molnupiravir an analogue of the ribonucleoside cytidine, two new chemical compounds with intense activity against SARS-CoV-2, Revista espanola de quimioterapia, 2021, 34(5), 402–407 CAS.
- W. Fischer, J. J. Eron, W. Holman, M. S. Cohen, L. Fang and L. J. Szewczyk, et al. Molnupiravir, an Oral Antiviral Treatment for COVID-19. medRxiv : the preprint server for health sciences, 2021 Search PubMed.
- W. P. Painter, W. Holman, J. A. Bush, F. Almazedi, H. Malik and N. Eraut, et al. Human Safety, Tolerability, and Pharmacokinetics of Molnupiravir, a Novel Broad-Spectrum Oral Antiviral Agent with Activity Against SARS-CoV-2. Antimicrobial agents and chemotherapy, 2021 Search PubMed.
- Y. Wang, P. Li, K. Solanki, Y. Li, Z. Ma and M. P. Peppelenbosch, et al., Viral polymerase binding and broad-spectrum antiviral activity of molnupiravir against human seasonal coronaviruses, Virology, 2021, 564, 33–38 CrossRef CAS PubMed.
- C. Willyard, How antiviral pill molnupiravir shot ahead in the COVID drug hunt, Nature, 2021 DOI:10.1038/d41586-021-02783-1.
- K. Rosenke, F. Hansen, B. Schwarz, F. Feldmann, E. Haddock and R. Rosenke, et al., Orally delivered MK-4482 inhibits SARS-CoV-2 replication in the Syrian hamster model, Nat. Commun., 2021, 12(1), 2295 CrossRef CAS PubMed.
- A. Amara, S. D. Penchala, L. Else, C. Hale, R. FitzGerald and L. Walker, et al., The development and validation of a novel LC-MS/MS method for the simultaneous quantification of Molnupiravir and its metabolite ss-d-N4-hydroxycytidine in human plasma and saliva, J. Pharm. Biomed. Anal., 2021, 206, 114356 CrossRef CAS PubMed.
- S. Jain, S. Giri, N. Sharma and R. P. Shah, LC and LC-HRMS studies on stability behavior of molnupiravir an anti-COVID 19 drug, J. Liq. Chromatogr. Relat. Technol., 2022, 1–10 Search PubMed.
- T. Recber, S. S. Timur, S. Erdogan Kablan, F. Yalcin, T. C. Karabulut and R. Neslihan Gursoy, et al., A stability indicating RP-HPLC method for determination of the COVID-19 drug molnupiravir applied using nanoformulations in permeability studies, J. Pharm. Biomed. Anal., 2022, 214, 114693 CrossRef CAS PubMed.
- M. S. Attia, M. H. Khalil, M. S. A. Abdel-Mottaleb, M. B. Lukyanova, Yu. A. Alekseenko and B. Lukyanov, Int. J. Photoenergy, 2006, 2006, 1–9 CrossRef.
- M. S. Attia, A. O. Youssef, Z. A. Khan and M. N. Abou-Omar, Talanta, 2018, 186, 36–43 CrossRef CAS PubMed.
- M. S. Attia, A. O. Youssef and A. A. Essawy, Anal. Methods, 2012, 4, 2323–2328 RSC.
- M. S. Attia, K. Ali, M. El-Kemary and W. M. Darwish, Talanta, 2019, 201, 185–193 CrossRef CAS PubMed.
- M. S. Attia, W. H. Mahmoud, A. O. Youssef and M. S. Mostafa, J. Fluoresc., 2011, 21, 2229–2235 CrossRef CAS PubMed.
- M. S. Attia, M. N. Ramsis, L. H. Khalil and S. G. Hashem, J. Fluoresc., 2012, 22, 779–788 CrossRef CAS PubMed.
- M. S. Attia, W. H. Mahmoud, M. N. Ramsis, L. H. Khalil, A. M. Othman, S. G. Hashem and M. S. Mostafa, J. Fluoresc., 2011, 21, 1739–1748 CrossRef CAS.
- M. S. Attia, A. M. Othman, E. Elraghi and H. Y. Aboul-Enein, J. Fluoresc., 2011, 21, 739–745 CrossRef CAS PubMed.
- A. A. Elabd and M. S. Attia, J. Lumin., 2016, 169, 313–318 CrossRef CAS.
- M. S. Attia, S. A. Elsaadany, K. A. Ahmed, M. M. El-Molla and M. S. A. Abdel-Mottaleb, J. Fluoresc., 2015, 25, 119–125 CrossRef CAS PubMed.
- S. G. Hashem, M. M. Elsaady, H. G. Afify, M. El-Kemary and M. S. Attia, Talanta, 2019, 199, 89–96 CrossRef CAS PubMed.
- M. S. A. Abdel-Mottaleb, M. Saif, M. S. Attia, M. M. Abo-Aly and S. N. Mobarez, Photochem. Photobiol. Sci., 2018, 17, 221–230 CrossRef CAS PubMed.
- W. E. Omer, M. A. El-Kemary, M. M. Elsaady, A. A. Gouda and M. S. Attia, ACS Omega, 2020, 5, 5629–5637 CrossRef CAS.
- L. M. Abdullah, M. S. Attia and M. S. A. Abdel-Mottaleb, Egypt. J. Chem., 2019, 62, 247–255 Search PubMed.
- M. S. Attia, A. O. Youssef, A.-S. S. H. Elgazwy, S. M. Agami and S. I. Elewa, J. Fluoresc., 2014, 24, 759–765 CrossRef CAS PubMed.
- D. Bank. https://go.drugbank.com/drugs/DB15661.
- cayman chem, M. Physicochemical properties, https://www.caymanchem.com/product/29586/eidd-2801 Search PubMed.
| This journal is © The Royal Society of Chemistry 2022 |

