 Open Access Article
Combined laser-induced breakdown spectroscopy and hyperspectral imaging with machine learning for the classification and identification of rice geographical origin
Yuanyuan Liua,
Shangyong Zhaob,
Xun Gao *a,
Shaoyan Fua,
Chao Song*c,
Yinping Doua,
Shaozhong Songd,
Chunyan Qie and
Jingquan Lina
aSchool of Physics, Changchun University of Science and Technology, Jilin, 130022, China. E-mail: lasercust@163.com; songchao@cust.edu.cn
bDepartment of Energy and Power Engineering, Tsinghua University, Beijing, 100084, China
cSchool of Chemistry and Environmental Engineering, Changchun University of Science and Technology, Jilin, 130022, China
dSchool of Data Science and Artificial Intelligence, Jilin Engineering Normal University, Jilin, 130052, China
eJilin Academy of Agricultural Sciences, Jilin, 130033, China
First published on 30th November 2022
Abstract
With the events of fake and inferior rice and food products occurring frequently, how to establish a rapid and high accuracy monitoring method for rice food identification becomes an urgent problem. In this work, we investigate using combined laser-induced breakdown spectroscopy (LIBS) and hyperspectral imaging (HSI) with machine learning algorithms to identify the place of origin of rice production. Six geographical origin rice samples grown in different parts of China are selected and pretreated, and measured by the atomic emission spectra of LIBS and the reflection spectra of HSI, respectively. The principal component analysis (PCA) is utilized to realize data dimensionality and extract the data feat of LIBS, HSI and fusion data, and based on this, three models employing the partial least squares discriminant analysis (PLS-DA), the support vector machine (SVM) and the extreme learning machine (ELM) are used to identify the rice geographical origin. The results show that the accuracy of LIBS and HSI analysis with the SVM machine learning algorithm can reach 93.06% and 88.07%, respectively, and the accuracy of combined LIBS and HSI data fusion recognition can reach 99.85%. Besides, the classification accuracy of the three models measured after pretreatment is basically all above 95%, and up to 99.85%. This study proves the effectiveness of using the combined LIBS and HSI with the machine learning algorithm in rice geographical origin identification, which can achieve rapid and accurate rice quality and identity detection.
1. Introduction
Rice is one of the most important food crops in the world, which has rich nutritional value and can provide carbohydrate, protein, fat and various mineral elements for human body. Since the quality of rice is closely related to its external growing environment, such as soil, sunshine and irrigation water, therefore, the quality of rice produced by the same rice variety in different geographical regions varies to some extent.1 As rice from different origins is difficult to distinguish directly in appearance, it occurs some undesirable events of selling counterfeit branded rice of low quality for high price, causing increasingly serious confusion of authenticity and origin fraud. This economic-driven adulteration2 not only violates the rights and interests of consumers, but also causes serious economic losses to rice farmers and brands. Therefore, the identification of rice geographical origin is critical in protecting rice brand and quality and securing stable development of rice market. The traditional rice identification methods include morphological identification,3 chemical identification,4 electrophoretic identification5 and molecular marker technology.6 Morphological identification relies on subjective judgment and cannot provide quantitative results objectively and consistently. Chemical identification is labor-intensive and time-consuming, and requires the expertise of researchers. Electrophoretic identification and molecular marker identification are complicated and tedious, which are not suitable for bulk analysis and nondestructive on-line detection of samples. As a result, these techniques are no longer able to meet the growing demand for fast, real-time rice recognition tasks.Spectroscopy provides a fast and nondestructive method for food detection, and both the quality detection and classification identification of rice have been studied using spectral analyses. Zhang et al.7 developed a method for purity analysis of multi-grain rice seeds using visible and near infrared spectroscopy. Maneenuam8 used Fourier transform infrared spectroscopy to successfully determine the content of 2-acetyl-1-pyrroline (2AP) in red Mali rice. Wang9 extracted and classified the characteristic spectral peaks of rice grain samples with the same variety but grown from different producing areas based on Raman spectroscopy, and PCA-BPNN training samples are tested in five periods, with the average prediction accuracy reaching 97.5%. The above studies show that it is effective to use spectroscopic techniques to evaluate the quality of rice. Near infrared spectroscopy and Fourier transform infrared spectroscopy are mainly used to study the overtones and combined vibrations of the C–H bond, because the spectral characteristic of the substance is usually not obvious due to its wide signal band, weak spectral intensity and overlapping spectral signals. Furthermore, these methods do not provide direct analysis of the inorganic substances contained in rice. Raman spectroscopy can detect the detailed chemical information of samples quickly and nondestructive. However, the fluorescence of organic compounds in the sample (sometimes several orders of magnitude stronger than weak Raman scattering) will interfere with the Raman signal and lead to baseline drift.10,11 Therefore, new spectroscopic techniques are needed to provide rich, clear and representative chemical information for reliable evaluation of rice quality.
Laser-induced breakdown spectroscopy (LIBS) has the advantages of fast processing speed, simple sample preparation, and multi-element analysis. The intensity lines of its characteristic spectrum can be used to determine the composition and concentration of elements based on the chemometrics methods. Hyperspectral imaging (HSI) combined spectroscopy and spatial imaging can obtain both spectral and spatial information of samples, and the spectral information can fully reflect the difference of physical structure and chemical composition within the sample. These two spectroscopic techniques have been widely used in rice quality identification and evaluation. In terms of LIBS, Yan12 collected 24 rice samples to study the effect of full spectrum intensity method and gradient-oriented image histogram feature method on classification accuracy. Yang13 comparatively studied the classification effects of 20 kinds of rice from different origins under 4 kinds of sample preparation methods. In terms of HSI, Jin14 used hyperspectral imager to identify rice varieties and established classification models based on machine learning algorithms, and the final classification accuracy is above 80%. Tang15 proposed a rice hyperspectral image classification model based on multilayer perceptron (MLP) network and residual learning, which has been validated on two public datasets. In summary, although LIBS and HSI techniques have been proved to be suitable for rice identification, they are used as a single and separated spectroscopic technique in most cases.
LIBS is based on atomic emission spectroscopy and plasma emission spectroscopy to analyze the chemical element information of substances, and HSI is a detection technique that combines both spectroscopy and imaging in a signal system. One of the most significant features of HSI is its ability to simultaneously obtain spectral and spatial information, which enables a detailed sample analysis.16 The two methods provide complementary functional information, and the combination of the two techniques can simultaneously obtain the physical and chemical properties of the sample, making it more efficient and stable for the analysis and identification. However, the differences and changes between samples from different origins cannot be seen intuitively by spectral technology and data fusion. Only when combined with machine learning algorithm, the spectral data can be preprocessed to remove spectral redundant information, then the relationship and difference of inherent information of spectral data between the samples can be analyzed by the algorithm to achieve the purpose of both quality inspection and origin identification. Currently, data fusion combined with machine learning has been applied to food origin certification and quality assessment. Zhao17 used combined LIBS and HSI with machine learning to determine the plant species, geographic origin and age of ginseng samples, and the final classification accuracy are better than 93%, 94%, and 99%, respectively, and the spectral fusion further improves the classification result of origin by at least 2%. Wu18 fused LIBS and HSI with principal component analysis (PCA) and partial least squares regression (PLSR) to detect mulberry fruit samples with different methyl thiodicaric acid residues, and the results confirm the feasibility of using combined LIBS and HSI to quickly detect methyl thiophene residues in mulberry fruit. LIBS identifies the spectra of elements, whereas HSI is commonly used to identify the absorption peaks of chemical bonds and functional groups in organic matter in the visible and near-infrared bands. We suggest that the two together make it possible to quickly and simply detect fungicide residue on mulberries by identifying both molecular bond vibrations and elements. The results of data fusion in the literature are improved, which may make it possible to identify and detect products quickly and accurately by identifying molecular bond vibration and elements after combining the two technologies.19 In addition, LIBS-Raman technique can complement the synergistic effect of atomic and molecular information, and overcome the limitation of single spectroscopy for sample identification. However, for the incoming radiation set high enough, a smaller laser spot size, even providing photon scattering, will benefit the LIBS signal. Contrarily, a larger laser spot size will highlight the Raman response. In other words, the conditions favorable to Raman scattering tend to reduce the intensity of LIBS, so it is difficult to coordinate and determine the conditions that make LIBS and Raman response reach the best quality.20
In this work, the spectral technology of combined LIBS-HSI with machine learning algorithm are used to classify and identify the rice geographical origin. First, atomic emission and reflection spectra of rice samples are obtained by LIBS and HSI, and fusion data representing both physical and chemical characteristics of the rice samples are obtained by the data layer fusion method. Second, through spectral preprocessing and principal component analysis, the clustering effects of the three kinds of data are analyzed and compared. Finally, the PLS-DA, SVM and ELM are used to construct the identification of rice geographical origin based on LIBS, HSI and combined LIBS-HSI fusion spectral data.
2. Experimental methods
2.1 Experiment setup
The LIBS system is shown in Fig. 1(a). The laser source is a Nd:YAG laser (Surelite II, Continuum) with wavelength of 1064 nm, pulse width of 10 ns, and repetition rate of 10 Hz. The laser beam diameter is of 6 mm. The laser beam regulates the pulse energy of the induced breakdown rice plasma through an energy regulation system composed of a half wavelength plate and a Gran prism. The laser beam with an energy of 30 mJ passes through a dichroic mirror and gets focused by a fused silica glass plano-convex lens with a focal length of 120 mm on the surface of the rice sample to generate plasma. In the direction of plasma emission spectrum, the rice plasma emission spectrum is collected by a fused quartz lens of 75 mm focal length and transmitted to a mid-step spectrometer (Mechelle5000, Andor, wavelength range from 200–850 nm, spectral resolution of 0.05 nm) equipped with an ICCD detector. An edge filter is placed in front of lens 2# to block the 1064 nm light from entering the spectrometer. The ICCD detector and the laser output trigger are synchronously controlled by a digital pulse delay generator DG645. The delay and gate width of the ICCD detector are set to 0.5 μs and 7 μs, respectively, to eliminate the influence of the background and improve the signal-to-noise ratio of the rice LIBS. In order to avoid excessive ablation of the rice sample, the rice sample is fixed on a three-dimensional translation platform, so each laser pulse acts on a new position on the rice sample surface. The experiments are carried out under the conditions of standard atmospheric pressure, with indoor temperature of 25 °C and relative humidity of 35%. In order to reduce the influence of external environmental factors, the average spectrum is measured over every 20 pulses, and finally 150 sets of spectral data are obtained for each rice geographical origin.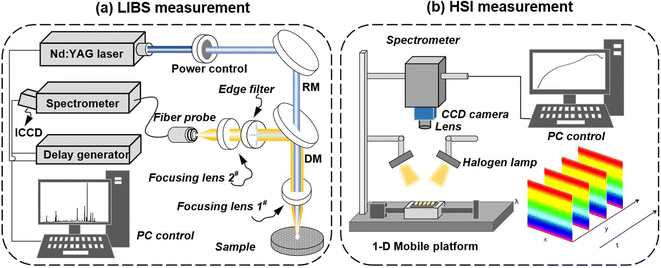 | ||
| Fig. 1 The system diagram of LIBS and HSI for rice spectra collection (RM: reflection mirror; DM: dichroic mirror, and CCD: charge coupled device). | ||
The HSI system is shown in Fig. 1(b). A push-broom hyperspectral imager (PIKA II, Resonon Inc, Bozeman, MT, USA) is attached to a CCD camera (Raptor EagleV), and a lens (Schneider-Kreuznach Cinagon 1.8/4.8) is mounted 45.2 cm above the rice sample. Two halogen lamps (IT, 3900, 150 W) are installed under both sides of the lens, and the illumination distance is 29 cm to acquire hyperspectral images with a spatial resolution of 50 pixels per mm2. In order to avoid distortion of the hyperspectral image, it is necessary to set the parameters of the hyperspectral imaging system. In this experiment, the angle between the two halogen lamps and the mobile platform is set to 45°, the exposure time of the camera is 20 ms, and the moving speed of the mobile platform is 1.1 mm s−1. To prevent interference from external light, the HSI system operates in a dark box. The HSI spectra are averaged to obtain 150 sets of spectral data from each rice geographical origin.
2.2 Sample preparation
The rice grain from six geographical origins including Daan (DA), Gongzhuling (GZL), Meihekou (MHK), Songyuan (SY), Yushu (YS) and Zhenlai (ZL) grown in Jilin Province in northeastern China are obtained from the Jilin Provincial Academy of Agricultural Sciences, and the rice samples were all grown in 2021 (Fig. 2(a)). The rice grains are peeled and washed with distilled water, and dried by a dryer (Shanghai Xinmiao Medical Instrument DZF-6000). For the LIBS experiment, the rice grains are grinded, sieved and pressed to make a round rice plate with 30 mm in diameter and 2.5 mm of thickness (Fig. 2(b)). For the HSI experiment, the rice grains are only shelled in order to ensure the integrity of rice grains and capture the original morphology (Fig. 2(c)).2.3 Spectral measurement
The LIBS and HSI spectra of rice samples from the selected six geographical origins are shown in Fig. 3. The rice LIBS spectra contain multiple discrete spectral lines whose intensities are related to the concentration of specific chemical elements.21 According to the atomic spectrum database of the National Institute of Standards and Technology (NIST), the element labeling spectra of rice LIBS are identified as that there are mineral nutrients such as Mg, Ca, Fe and other component elements such as C, H, N, and O. The difference in the characteristic spectral line intensities reflects the difference in the element concentration of the rice grains from the six rice geographical origins, so the rice geographical origin can be identified by the characteristic spectral intensity of the multiple elements. The selection of the characteristic spectrum should meet the conditions of less overlap of the spectral lines, weak self-absorption phenomenon, and high intensity of the spectral lines. In this work, 25 characteristic spectral lines of 14 elements are selected for rice geographical origin classification and identification, as shown in Table 1. The HSI spectra represent the intensity of electromagnetic radiation on the surface of a rice grain, which is related to the optical properties of the rice grain surface, such as optical absorption, emission, scattering, and reflection. From Fig. 3(b), the spectral curves of rice grains from the six geographical origins differ slightly in intensity and shape, which is due to the different soil and climate conditions in the different origins, resulting in different contents of amylose, amylopectin, protein and so on. The band intensity in the range of 500–600 nm is related to the amylopectin in rice, the weak absorption peak around 750 nm is produced by amylose in rice, and the absorption peak near 910 nm is produced by the functional groups of proteins in rice.22 Due to the low response and high noise at the edge of the spectral interval, the front and back bands are excluded in this paper, and a total of 378 wavelengths between 451.58–949.44 nm from the HSI spectrum are selected for rice geographical origin identification. It is worth noting that the experimental setup of LIBS and HSI are two completely independent systems, and the spectrum of LIBS and HSI is obtained independently.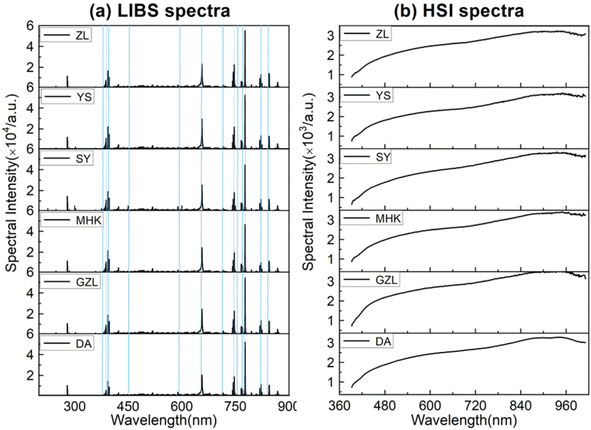 | ||
| Fig. 3 The spectra of rice grown in different geographical origins, (a) LIBS spectra, and (b) HSI spectra. | ||
| Element | Wavelength (nm) | Element | Wavelength (nm) |
|---|---|---|---|
| C I | 247.89/795.38 | Na I | 589.01/818.62 |
| Mg I | 285.21/518.41 | H I | 656.43 |
| Mg II | 279.56/280.27 | NI | 742.50/744.33/746.98/821.68/868.14 |
| P I | 715.88 | K I | 766.54/769.95 |
| Fe I | 387.08/388.33 | O I | 777.51/844.76 |
| Ca I | 422.71 | O II | 777.32 |
| Ca II | 393.40/396.87 | Th I | 824.32 |
2.4 Spectral data fusion
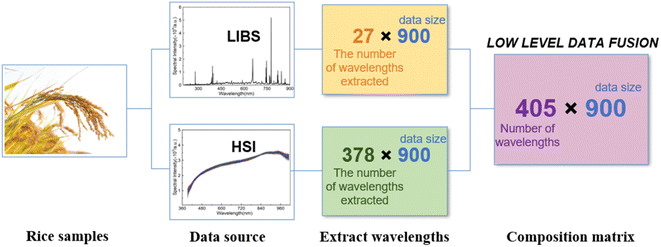
Data fusion can obtain a more reliable authentication model based on the results obtained by LIBS and HSI techniques, respectively, and the fusion of the two spectral information obtained can improve the quantity and quality of knowledge about the distinguishing characteristics between rice. Data fusion can be carried out in three levels, low-level fusion (data-level fusion), mid-level fusion (feature-level fusion), and high-level fusion (decision-level fusion), depending on the target to be combined, the number and type of data sets.23 In this work, the rice data are analyzed by the low-level fusion (data layer fusion). Relevant features are extracted from LIBS and HSI data sources, and then these data are concatenated into a single array to form a new matrix. The new matrix has the same number of rows as the analyzed data, and the same number of columns as the spectral wavelengths selected altogether from the two data sources.24 The data fusion schematic diagram is shown in Fig. 4.2.5 Machine learning algorithm
In this work, the machine learning algorithms such as the principal component analysis (PCA), the partial least squares discriminant analysis (PLS-DA), the support vector machine (SVM), and the extreme learning machine (ELM) are applied to the classification and identification of the rice geographical origin combined with LIBS, HSI, and combination of LIBS-HSI fusion data. Spectral data is divided into training set and testing set at the ratio of 7![[thin space (1/6-em)]](https://www.rsc.org/images/entities/char_2009.gif) :
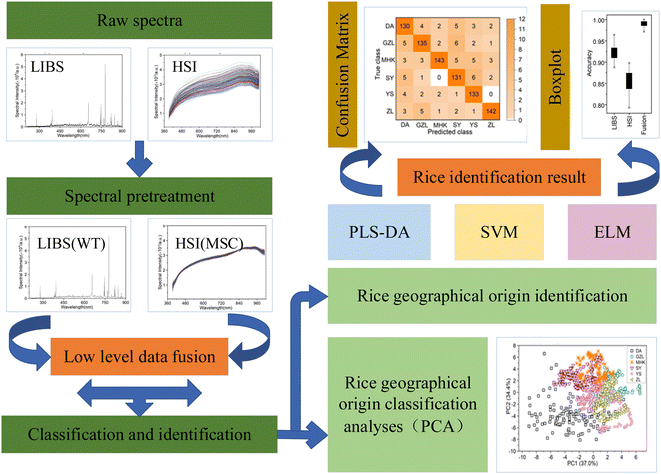
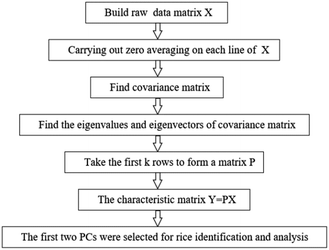
:![[thin space (1/6-em)]](https://www.rsc.org/images/entities/char_2009.gif) 3, and the training process is repeated 50 times to ensure that the results are fully compared by the combination of LIBS, HSI and LIBS-HSI fusion data. The flow chart of rice origin identification is shown in Fig. 5.
3, and the training process is repeated 50 times to ensure that the results are fully compared by the combination of LIBS, HSI and LIBS-HSI fusion data. The flow chart of rice origin identification is shown in Fig. 5.
3. Results and discussion
3.1 Spectral preprocessing
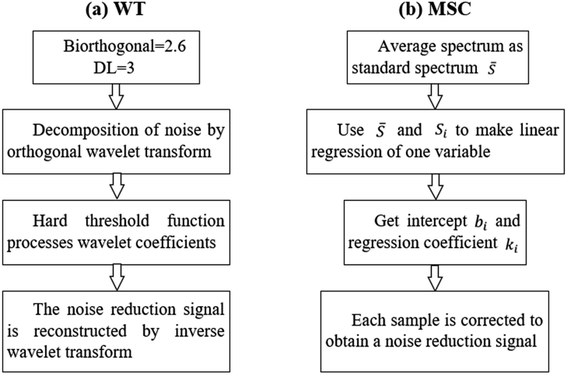
The LIBS and HSI systems are usually interfered by noise signals when collecting spectral information of the rice samples. Preprocessing can effectively eliminate the noise signal of the spectrum and enhance the correlation between the spectrum and the data, which is beneficial to qualitative analysis of the samples. Wavelet transform (WT) has the characteristics of multi-resolution and good time-frequency, which can carry out multi-scale refined analysis of signals through scaling and shifting operation functions. Selecting proper WT to preprocess the LIBS spectral data can effectively reduce noise interference, remove baseline drift, and obtain relevant information of the corresponding position and frequency. Multiple scattering correction (MSC) is a commonly used algorithm for hyperspectral data preprocessing. Using MSC to preprocess HSI spectral data can effectively eliminate the spectral differences caused by different scattering levels.Taking the rice grain from DA origin as an example, the rice spectra of LIBS and HSI before and after pretreatment are shown in Fig. 6. The original spectrum of LIBS contains a high baseline, which even hides the characteristic spectral lines of individual elements. The WT transform processing significantly reduced the spectral background noise and noise interference. The original spectral lines of HSI also have a wide range of spectral line intensity variation at different wavelengths, which was decreased obviously after the MSC treatment and the spectral lines show a clear clustering effect. The pretreatment effectively optimized the spectral data of LIBS and HSI, which plays a positive role in the subsequent rice origin classification work. The flow chart of data preprocessing method is shown in Fig. 7.
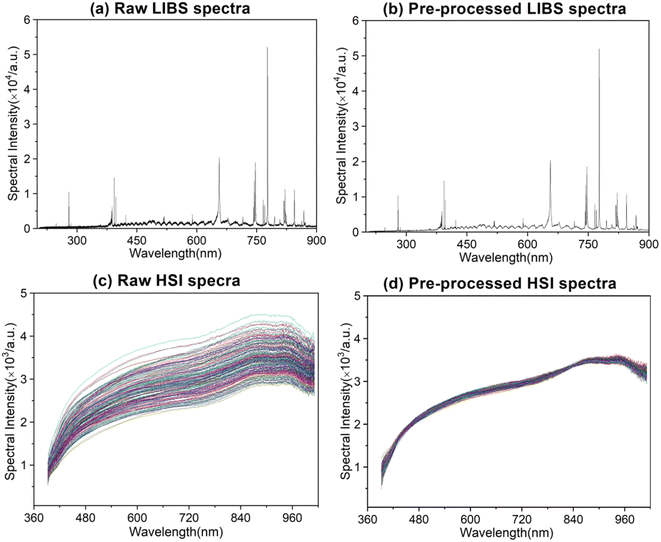 | ||
| Fig. 6 Raw and pre-processed spectra, raw LIBS spectra (a), pre-processed LIBS spectra (b), raw HSI spectra (c), and pre-processed HSI spectra (d). | ||
3.2 Rice geographical origin classification analyses
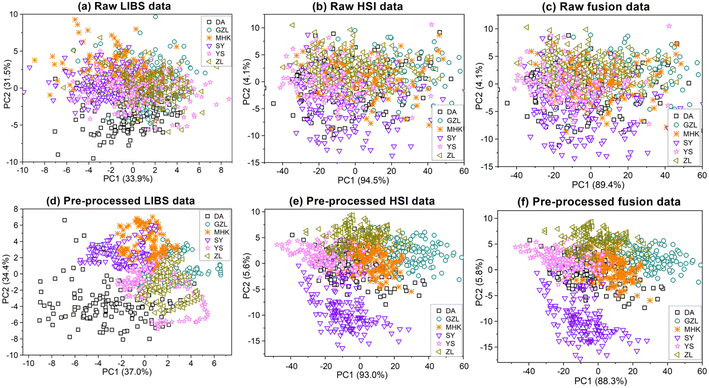
The spectral data acquired from LIBS and HSI are preliminarily analyzed by PCA before feeding to PLS-DA, SVM and ELM for classification and identification of rice geographical origin. The LIBS, HSI, and combined LIBS-HSI fusion data are plotted based on the PCA scores to reveal an overview of the distinction between different rice geographical origins, as shown in Fig. 8. It can be seen that for the un-preprocessed rice data of LIBS and HIS, there exist lots of overlap in the scatter plots, and it is impossible to intuitively see any differences between the origins. After spectral preprocessing of LIBS and HSI, the scatter plots of the rice data of the same origin are concentrated in a certain range of spatial regions, and show a good cluster distribution. The preprocessed LIBS scatter plots are approximately circular as a whole, and the scatter of each origin diverges from each angle with a certain point as the center. Among them, the dispersion of DA is the strongest and the division is relatively obvious. The degree of dispersion of the other five varieties is similar, except the four varieties of GZL, MHK, SY, and YS have a little overlap, but it can still be clearly seen that the differences in the clustering range between the rice geographical origins. There is numerous overlap between YS and ZL, so the partition effect is not obvious in this case. The scatter plots of rice data based on the HSI measurement are approximately linearly distributed along the y-axis (PC2). The clustering range of SY is clearly separated from other origins. GZL, MHK, YS, and ZL overlap with each other, but the overall clustering range is still clearly divided. Different from the classification of LIBS, in HSI, DA, whose clustering range differs most from the other origins in LIBS, has serious overlap with MHK, SY, and YS. The classification of combined LIBS-HSI fusion data is better than that of single LIBS and HSI, and the clustering of the six geographical origins is less overlapped and provides better visualization results, which can be attributed to that the combined LIBS-HSI fusion data can provide both the physical structure and chemical composition of the rice grain. The flow chart of PCA feature extraction is shown in Fig. 9.3.3 Rice geographical origin identification
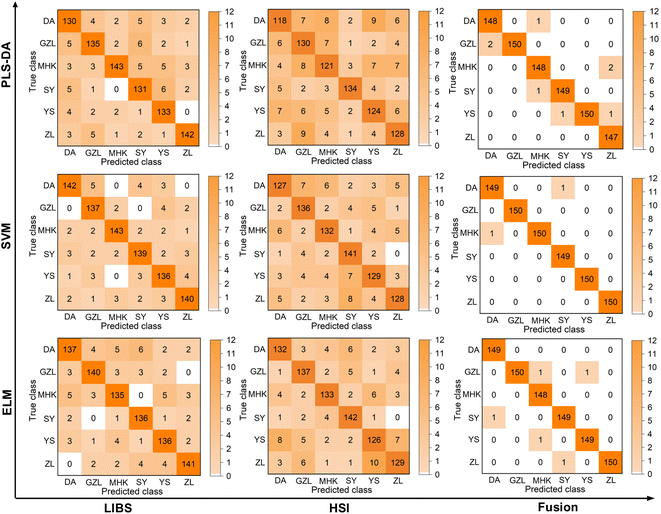
The average accuracy, optimal parameter selection and standard deviation comparison of identification of the rice geographical origin by the original and pretreated LIBS, HSI and combined LIBS-HSI fusion data are shown in Table 2. The specific identification of rice geographical origin after pretreatment are shown in the confusion matrix in Fig. 10. For the original data, the classification accuracy of LIBS under each algorithm is about 75%, while that of HSI is only about 60%, which failed to classify rice origin successfully. However, the classification accuracy of the fused data is all around 90%, which is different from the situation that PCA can hardly cluster, and can successfully identify the rice geographical origin. The nonlinear correlation may be lost for the linear dimensionality reduction of the spectral data of LIBS and HSI using PCA, and the principal components with small contribution rates may often contain important information about the differences among the rice geographical origins. After spectral pretreatment, the identification accuracy of the rice geographical origin with the LIBS, HSI and combined LIBS-HSI fusion data has all been improved, which can achieve the purpose of origin classification. HSI has the most significant accuracy improvement effect, with an average improvement of about 25% due to the wide variation range of spectral line intensity under different wavelengths of the original HSI spectrum and the large overlap of spectral lines, and there is more overlap between different areas. After pretreatment, the spectral line intensity of each area is more concentrated, which is more conducive to producing area classification| LIBS | HSI | LIBS-HSI | ||||
|---|---|---|---|---|---|---|
| PLS-DA | ||||||
| Accuracy of original data | 73.69% | (4.08) | 59.78% | (2.25) | 86.85% | (1.42) |
| Parameter-LVs | 7.56 | 7.65 | 8.64 | |||
| Accuracy after pretreatment data | 90.43% | (1.81) | 83.85% | (2.19) | 99.08% | (0.95) |
| Parameter-LVs | 7.52 | 6.94 | 8.06 | |||
![[thin space (1/6-em)]](https://www.rsc.org/images/entities/char_2009.gif) |
||||||
| SVM | ||||||
| Accuracy of original data | 77.94% | (3.84) | 58.25% | (6.46) | 88.67% | (1.98) |
| Parameter-C & g | C = 17.65 | C = 21.79 | C = 18.72 | |||
| g = 0.88 | g = 0.74 | g = 0.36 | ||||
| Accuracy after pretreatment data | 93.06% | (1.24) | 88.07% | (2.54) | 99.85% | (0.24) |
| Parameter-C & g | C = 22.68 | C = 10.45 | C = 19.37 | |||
| g = 1.92 | g = 1.76 | g = 0.95 | ||||
![[thin space (1/6-em)]](https://www.rsc.org/images/entities/char_2009.gif) |
||||||
| ELM | ||||||
| Accuracy of original data | 80.73% | (3.23) | 60.82% | (3.15) | 91.52% | (2.42) |
| Parameter-n | 92 | 90 | 86 | |||
| Accuracy after pretreatment data | 91.65% | (2.32) | 88.73% | (2.47) | 99.47% | (0.96) |
| Parameter-n | 90 | 95 | 85 | |||
The three algorithms obtain the best identification results under the pre-processed fusion method, which are 99.08% (PLS-DA), 99.85% (SVM), and 99.47% (ELM), respectively. In most cases, PLS-DA has the lowest standard deviation and the highest accuracy, and its performance is better than the other two algorithms. This may be due to that the computational complexity of PLS-DA is related to the number of samples, but has nothing to do with feature dimensions, so it is more suitable for the classification task with more features and fewer number of samples. Data fusion methods have higher accuracy and smaller standard deviation than LIBS and HSI. Therefore, the fusion method has higher accuracy and better robustness than using of any single method. The overall model running results after 50 rounds of preprocessing are shown in Fig. 11.
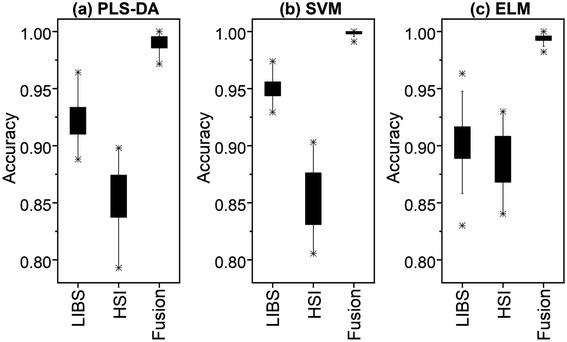 | ||
| Fig. 11 Boxplots of the 50-repetition results for rice origin identification: (a) PLS-DA, (b) SVM, and (c) ELM. | ||
The LIBS spectra are informative and easily identifiable. However, the main disadvantages of LIBS are of low measurement repeatability and signal uncertainty, mainly caused by plasma instability, matrix effects and other causes.25–28 HSI is a detection technique that combines spectroscopy and imaging into one signaling system. One of the most striking features of HSI is its ability to acquire both spectral and spatial information, enabling detailed analysis of the sample.29 The LIBS-HSI combination can fully reflect the differences in the physical structure and chemical composition of the samples. In the rice geographical origin identification task, the stability of the HSI system enables to achieve a certain level of accuracy, but the identification result is worse than that of LIBS due to its fewer spectral lines and lower resolution. However, the good generalization performance of ELM makes the recognition rate of HSI data reach a certain level.30 Compared with the HSI spectra, the LIBS spectra contain more element information and exhibit a high resolution, yielding better results. Notably, the powder compaction pretreatment is beneficial to reduce the effects of surface inhomogeneity and compositional differences, which contributes to the better identification task of LIBS.17 Although the rice samples that are only husked are good for the hyperspectral camera to capture the original morphology of the samples, the classification effect of the spectral data without pretreatment is still poor, and data pretreatment (MSC) plays an important role in the classification effect of HSI.
Compared with other techniques used for rice classification and identification (Raman technique,10,11 near infrared spectroscopy31), when using a single LIBS (90.43–93.06%) or HSI (83.85–88.73%) technique, the recognition rate is slightly lower than the classification effect of other techniques (90–98.75%), which may be due to the growth of rice. However, the identification rate (over 99%) of the two technologies is better than that of other technologies. It can be seen that the combination of LIBS and HIS technologies can effectively improve the identification effect of rice origin and can be used for identification of other agricultural products.
4. Conclusions
In this work, the combined LIBS-HSI with the machine learning algorithms has been applied to the classification and identification of rice geographical origin. The classification and identification results of the LIBS data are superior to that of the HSI data due to the large amount of useful chemical information obtained from the LIBS spectra. The combined LIBS-HSI fusion data provides complementary functional information to simultaneously capture the physical and chemical properties of the rice samples, which, therefore, further improves the classification and identification results of the rice geographical origin. The appropriate pretreatment methods for the LIBS and HSI spectra are selected, which can significantly improve the identification accuracy of the rice geographical origin. Using the pretreated spectral data, the classification by the combined LIBS-HIS fusion data is better than that of LIBS and HSI only, and the clustering of the six geographical origins is less overlapped and provides better visualization results, and the identification accuracy of the rice geographical origin thus achieves the highest of 99.08%, 99.85%, and 99.47% among the three algorithms of employing PLS-DA, SVM, and ELM, respectively. In this paper, LIBS and HSI are combined for the rice geographical origin identification, the experimental results reveal the effectiveness of LIBS and HSI in combination for rapid detection of rice geographical origin. The combined LIBS-HSI with machine learning has good application potential to be extended to the quality detection and origin identification of other kinds of agricultural products.Conflicts of interest
There are no conflicts to declare.Acknowledgements
This paper was supported by the National Natural Science Foundation of China (61575030) and Natural Science Foundation of Jilin province (20220101035JC, 20200301042RQ, 2020122348JC, 20200602054ZP).References
- P. Sousa Sampaio, A. Castanho, A. S. Almeida, J. Oliveira and C. Brites, Identification of rice flour types with near-infrared spectroscopy associated with PLS-DA and SVM methods, Eur. Food Res. Technol., 2020, 246(3), 527–537 CrossRef.
- C. S. Tibola, S. A. da Silva, A. Augusto Dossa and D. I. Patricio, Economically motivated food fraud and adulteration in Brazil: incidents and alternatives to minimize occurrence, Food Sci., 2018, 83(8), 2028–2038 CrossRef CAS PubMed.
- E. Susetyarini, P. Wahyono, R. Latifa and E. Nurrohman, The identification of morphological and anatomical structures of Pluchea indica, J. Phys.:Conf. Ser., 2020, 1539(1), 012001 CrossRef CAS.
- V. C. Ito and L. Gustavo Lacerda, Black rice (Oryza sativa L.): a review of its historical aspects, chemical composition, nutritional and functional properties, and applications and processing technologies, Food Chem., 2019, 301, 125304 CrossRef CAS PubMed.
- J. Chen, M. Li, T. Pan, L. Pang, L. Yao and J. Zhang, Rapid and non-destructive analysis for the identification of multi-grain rice seeds with near-infrared spectroscopy, Spectrochim. Acta Mol. Biomol. Spectrosc., 2019,(219), 179–185 CrossRef PubMed.
- S. C. Chukwu, M. Y. Rafii, S. I. Ramlee, S. I. Ismail, Y. Oladosu, E. Okporie, G. Onyishi, E. Utobo, L. Ekwu, S. Swaray and M. Jalloh, Marker-assisted selection and gene pyramiding for resistance to bacterial leaf blight disease of rice (Oryza sativa L.), Biotechnol. Biotechnol. Equip., 2019, 33(1), 440–455 CrossRef CAS.
- J. Zhang, M. Li, T. Pan, L. Yao and J. Chen, Purity analysis of multi-grain rice seeds with non-destructive visible and near-infrared spectroscopy, Comput. Electron. Agric., 2019, 164, 104882 CrossRef.
- T. Maneenuam, W. Chanprasert, R. Rittiron, A. Prasertsak and S. Wongpiyachon, Rapid determination of trace substance,2-acetyl-1-pyrroline content in Hom Mali rice using near infrared spectroscopy, J. Near Infrared Spectrosc., 2015, 23(6), 361–367 CrossRef CAS.
- Y. Wang and F. Tan, Extraction and classification of origin characteristic peaks from rice Raman spectra by principal component analysis, Vib. Spectrosc., 2021,(114), 103249 CrossRef CAS.
- Feng, Q. Zhang, P. Cong and Z. Zhu, Preliminary study on classification of rice and detection of paraffin in the adulterated samples by Raman spectroscopy combined with multivariate analysis, Talanta, 2013, 115, 548–555 CrossRef CAS PubMed.
- M. Sha, D. Zhang, Z. Zhang, J. Wei, Y. Chen, M. Wang and J. Liu, Improving Raman spectroscopic identification of rice varieties by feature extraction, J. Raman Spectrosc., 2020, 51(4), 702–710 CrossRef CAS.
- J. Yan, P. Yang, H. Zhongqi, R. Zhou, X. Li, S. Tang, Y. Tang, X. Zeng and Y. Lu, Classification accuracy improvement of laser-induced breakdown spectroscopy based on histogram of oriented gradients features of spectral images, Opt. Exp., 2018, 26(22), 28996–29004 CrossRef PubMed.
- P. Yang, Y. Zhu, I. Yang, J. Li, S. Tang, H. Zhongqi, L. Guo, X. Li, X. Zeng and Y. Lu, Evaluation of sample preparation methods for rice geographic origin classification using laser-induced breakdown spectroscopy, J. Cereal. Sci., 2018, 80, 111–118 CrossRef CAS.
- X. Jin, J. Sun, H. Mao and S. Jiang, Discrimination of rice varieties using LS-SVM classification algorithms and hyperspectral data, Adv. J. Food Sci. Technol., 2015, 7(9), 691–696 CrossRef.
- X. Tang, X. Liu, P. Yan, B. Li, H. Qi and F. Huang, An MLP Network Based on Residual Learning for Rice Hyperspectral Data Classification, Geosci. Rem. Sens. Lett. IEEE, 2022, 19, 1–5 Search PubMed.
- D. F. Barbin, G. El Masry, D. Wen Sun and P. Allen, Non-destructive determination of chemical composition in intact and minced pork using near-infrared hyperspectral imaging, Food Chem., 2013, 138(2–3), 1162–1171 CrossRef CAS PubMed.
- S. Zhao, W. Song, Z. Hou and Z. Wang, Classification of ginseng according to plant species, geographical origin, and age using laser-induced breakdown spectroscopy and hyperspectral imaging, J. Anal. At. Spectrom., 2021, 36(8), 1704–1711 RSC.
- D. Wu, L. Meng, Y. Liang, J. Wang, X. Fu, X. Du, S. Li, Y. He and L. Huang, Feasibility of laser-induced breakdown spectroscopy and hyperspectral imaging for rapid detection of thiophanate-methyl residue on mulberry fruit, Int. J. Mol. Sci., 2019, 20(8), 2017–2021 CrossRef CAS PubMed.
- R. R. V. Carvalho, J. A. O. Coelho, J. M. Santos, F. W. B. Aquino, R. L. Carneiro and E. R. Pereira-Filho, Laser-induced breakdown spectroscopy (LIBS) combined with hyperspectral imaging for the evaluation of printed circuit board composition, Talanta, 2015, 134, 278–283 CrossRef CAS PubMed.
- J. Moros, M. M. ElFaham and J. Javier Laserna, Dual-spectroscopy platform for the surveillance of Mars mineralogy using a decisions fusion architecture on simultaneous LIBS-Raman data, Anal. Chem., 2018, 90(3), 2079–2087 CrossRef CAS PubMed.
- L. Guo, D. Zhang, L. Sun, S. Yao, L. Zhang, Z. Wang, Q. Wang, H. Ding, Y. Lu, Y. Hou and Z. Wang, Development in the application of laser-induced breakdown spectroscopy in recent years: a review, Front. Phys., 2021, 16(2), 1–25 Search PubMed.
- D. de Souza, A. F. Sbardelotto, D. R. Ziegler, L. Damasceno Ferreira Marczak and I. CristinaTessaro, Characterization of rice starch and protein obtained by a fast alkaline extraction method, Food Chem., 2016, 191, 36–44 CrossRef PubMed.
- E. Borràsa, J. Ferréb, R. Boquéb, M. Mestresa, L. Aceñaa and O. Bustoa, Data fusion methodologies for food and beverage authentication andquality assessment-a review, Anal. Chim. Acta, 2015,(891), 1–14 CrossRef PubMed.
- R. Ríos-Reinaa, R. M. Callejóna, F. Savoranib, J. M. Amigoc and M. Cocchi, Data fusion approaches in spectroscopic characterization and classification of PDO wine vinegars, Talanta, 2019, 198, 560–572 CrossRef PubMed.
- Y. Dai, C. Song, X. Gao, A. Chen, Z. Hao and J. Lin, Quantitative determination of Al–Cu–Mg–Fe–Ni aluminum alloy using laser-induced breakdown spectroscopy combined with LASSO–LSSVM regression, J. Anal. At. Spectrom., 2021, 36(8), 1634–1642 RSC.
- S. Zhao, X. Gao, A. Chen and J. Lin, Effect of spatial confinement on Pb measurements in soil by femtosecond laser-induced breakdown spectroscopy, Appl. Phys. B, 2020, 126(1), 1–6 CrossRef.
- Y. Fu, W. Gu, Z. Hou, S. A. Muhammed, T. Li, Y. Wang and Z. Wang, Mechanism of signal uncertainty generation for laser-induced breakdown spectroscopy, Front. Phys., 2021, 16(2), 1–10 CAS.
- W. Wang, L. Sun, G. Wang, P. Zhang, L. Qi, L. Zheng and W. Dong, The effect of sample surface roughness on the microanalysis of microchip laser-induced breakdown spectroscopy, J. Anal. At. Spectrom., 2020, 35, 357–365 RSC.
- D. F. Barbin, G. El Masry, D. Wen Sun and P. Allen, Non-destructive determination of chemical composition in intact and minced pork using near-infrared hyperspectral imaging, Food Chem., 2013, 138(2–3), 1162–1171 CrossRef CAS PubMed.
- C. W. Deng, G. B. Huang, X. Jia and J. X. Tang, Extreme learning machines: new trends and applications, Sci. China Inf. Sci., 2015, 58(2), 1–16 CrossRef.
- F. Davrieux, Y. El Ouadrhiri, B. Pons and D. Bastianelli, Discrimination between aromatic and non-aromatic rice by near infrared spectroscopy: a preliminary study, Proceedings of the 12th International Conference, New Zealand, Auckland, 2007, pp. 394–396 Search PubMed.
| This journal is © The Royal Society of Chemistry 2022 |


