DOI:
10.1039/D2RA04881G
(Paper)
RSC Adv., 2022,
12, 25096-25105
Synthesis of nano-crystallite gypsum and bassanite from waste Pila globosa shells: crystallographic characterization
Received
5th August 2022
, Accepted 21st August 2022
First published on 3rd September 2022
Abstract
For the first time, in this work, waste Pila globosa shells have been used to synthesize two industrially valuable materials, gypsum and bassanite. In the first stage, gypsum was synthesized using a wet chemical precipitation method. Subsequently, bassanite was produced by the heat treatment of gypsum at a certain temperature (200 °C), which was chosen after TGA and DSC analysis. The synthesized gypsum and bassanite phases were confirmed by XRD with the assistance of FTIR spectroscopy. Various crystallographic parameters of gypsum and bassanite were investigated, such as the crystallite size (a number of models were employed along with the Scherrer equation), crystallinity index, lattice parameters, unit cell volume, dislocation density, relative intensity, preference growth, specific surface area, microstrain (models were also engaged), and residual stress using the XRD-sin2![[thin space (1/6-em)]](https://www.rsc.org/images/entities/char_2009.gif) Ψ technique.
Ψ technique.
Introduction
Gypsum (CaSO4·2H2O) is an important mineral that forms rocks and is present throughout the surface of the earth.1 Naturally occurring gypsum is found in different regions of the world containing various percentages of water of crystallization. Outside the earth's surface, gypsum has been found as a key water-holding compound on Mars.2 Recently, calcium sulphate-based compounds (gypsum, bassanite, etc.) have found extensive use in various fields. As the world population is increasing day by day, the demand for food is also rising in a similar fashion. However, the amount of land has more or less remained the same. To meet the rising food demand, plants must be supplied with adequate nutrients. Thus, nutrients are supplied externally in addition to the nutrients in the soil. Gypsums are a source of calcium and sulphate that are essential nutrients for the appropriate growth and development of plants by increasing the seed oil and protein content through the formation of sulphur-containing amino acids and via the synthesis of chlorophyll and vitamins.3 The other applications of gypsum are agriculture waste material-based gypsum walls, which are used as building blocks or wall partitions, and in some cases, fiber-reinforced gypsum composites are also used.4 The various applications of gypsums are as a source of raw material for cement retarders,5 in arsenic mitigation by forming gypsum,6 CO2 removal by the carbonation process,7 in biominerals and biomaterials,8 in the removal of cadmium by solidification,9 etc.
Hemihydrate or bassanite is widely known as plaster of Paris (as it was extensively mined from Montmartre in the Paris district) due to its use in the previous century. Nowadays, nearly 100 million kilograms of bassanite (CaSO4·0.5H2O) are produced to meet the global requirement, which are produced from the gypsum phase.10 The predominant applications of plaster of Paris or bassanite in the medical field are as a bone grafting substitute and in bone defect filling,10,11 bioactive and resorbable bone treatment,12 heritage conservation, dental prosthetics, and drug delivery.13 Other applications include water-soluble templates for inorganic oxide synthesis,14 stucco marble (a composite of bassanite, animal glue and pigments), and decorative plasterwork.15
Fluid-triggered earthquakes can be predicted by similar types of reactions as the dehydration process of gypsum to bassanite. The temperature and vapour pressure greatly influence the reaction kinetics of dehydration.10 Thus, the study of this material is gaining importance.
These versatile applications of such materials require a variation in their characteristics, which mainly depend on the structure or more precisely the particle configuration or orientation. The study or exploration of crystallographic parameters such as crystallite size, crystallinity index, lattice parameters, unit cell volume, dislocation density, relative intensity, preference growth, specific surface area, microstrain, and residual stress, will enhance the applicability of such materials.
In this study, gypsum and bassanite were synthesized from waste Pila globosa shells and their crystallographic characterization were explored.
Materials and methods
Materials
Pila globosa shells (snail shells) were gathered from a local field near Mirzapur, Tangail. After separating them carefully with subsequent drying in sunlight, the shells were stored for further use. The dried shells were characterized using XRF (X-ray fluorescence) and the data reveal that the shells contained 97% calcium and 0.95% sodium with other negligible metals. Sulfuric acid was procured from E-Merck Germany through S. F. Scientific limited.
Gypsum and bassanite synthesis
The dried snail shells were ground finely using a high-speed ball mill. From the powder of the shells, a 100 mL 1 M suspension was prepared, and sulfuric acid was diluted to 1 M and taken to 100 mL. Equal volumes of each (100 mL shell suspension and 100 mL acid) were mixed thoroughly by slow-dropping the acid from a burette. After completion of the mixing, the solution was openly stirred for 24 hours at room temperature (25 °C) and 60% relative humidity. This resulted in the formation of gypsum precipitate, which after filtering, was dried at 70 °C for 24 hours. The dried gypsum was stored in an air-tight sample bottle. A similar procedure was employed to synthesize bassanite from Pila globosa shells up to the final drying procedure. In the final stage, the precipitate was heated at 200 °C for 1 hour to obtain bassanite. The synthetic procedures of gypsum and bassanite from Pila globosa shells are illustrated in eqn (1)–(3).| | |
Pila globosa + H2O → CaCO3 suspension
| (1) |
| | |
CaCO3 suspension + H2SO4 → CaSO4·2H2O (gypsum)
| (2) |
| | |
CaSO4·2H2O (gypsum) + Heating → CaSO4·0.5H2O (bassanite)
| (3) |
Thermogravimetric analysis
Thermogravimetric (TG) analysis and differential scanning calorimetry (DSC) were performed to observe the thermal behavior of the synthesized sample, and these were executed using a simultaneous thermal analysis machine (NETZSCH STA 449F5 STA449F5B-0167-M). The investigating temperature was from 30 to 900 °C with a heating rate of 30 °C per minute. The experiment was performed with an alumina sample holder, and the reference maintained an inert atmosphere by purging nitrogen gas.
X-ray diffraction analysis
Phase analysis of the synthesized products was performed on a Rigaku Smart Lab XRD instrument. The documented pattern's 2θ range was from 5° to 80° with fixing steps of 0.01°. Before analyzing the samples, the machine was calibrated with a standard silicon reference. For X-ray diffraction, a copper tube made of ceramic (Cu Kα, λ = 1.54060 Å) was chosen as the X-ray source, and the temperature of the tube was maintained by a chiller operated at 23 °C with a water flow rate of 4.6–4.8 L min−1. To produce X-rays, the voltage and current were fixed at 40 kV and 50 mA, respectively, which is standard for the appended Cu-anode. Bragg–Brentano parafocusing geometry with a Ni-Kβ filter was employed to record the data of the standard as well as the samples. To identify the phase, the pdf + 42021 software embedded with the ICDD database was functionalized.
FT-IR analysis
The activating groups of the synthesized gypsum and bassanite were recognized with the aid of an IR-Prestige 21 machine (Shimadzu, Japan). The data were accumulated with the assistance of the attenuated total reflection (ATR) mode ranging from 400 to 4000 cm−1 in percentage transmittance. The spectrum was generated with a 4 cm−1 spectral resolution and a mean of 30 scans.
Results and discussion
Thermal analysis
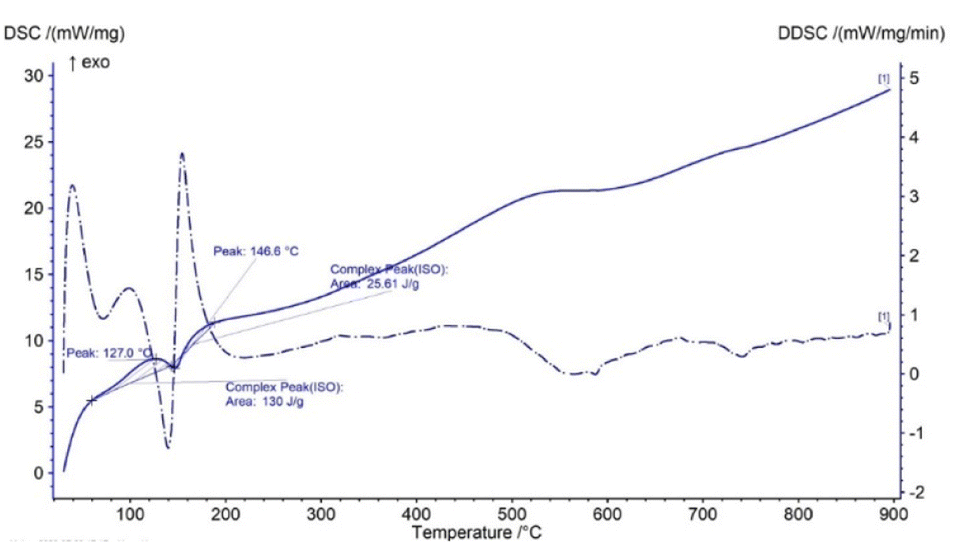
In TG analysis, the mass is changed with respect to temperature variation. In the TG curve, only one stage of mass change was noticed, which occurred within the temperature range of 100–180 °C. At this stage, gypsum is changed to bassanite by removing only water molecules. DTG also revealed no other mass loss or gain, with only one peak at the 150 °C maximum point. Thus, gypsum is converted to bassanite gradually by releasing water. Very similar types of TG results have been reported in a number of literature studies, although most of the literature reports the TG results of gypsum board contained other impurities like CaCO3.16–18 Fig. 1 presents the thermal analysis of pure gypsum synthesized from Pila globosa. The heat energy flow against temperature variation is explained by differential scanning calorimetry (DSC). Sometimes, its derivative form (DDSC) is also taken into consideration for a better understanding of the types of heat change, such as heat being absorbed or given off. In the DSC curve, only one peak was visualized at 150 °C. This peak coincided with the TGA peak and this occurred due to the endothermic dehydration reaction exhibiting a downward peak. The rest of the curve represented an exothermic heat change, and this may be due to the phase transformation and crystallization of calcium sulphate compounds. DDSC also showed the rapid heat flow change at 200 °C. Fig. 2 reveals the DSC and DDSC curves of the synthesized gypsum products. To produce bassanite from the synthesized gypsum, 200 °C was chosen based on the TG, DTG, DSC, and DDSC data.
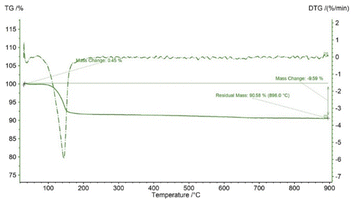 |
| | Fig. 1 Thermal analysis (TG and DTG) of the raw sample (gypsum). | |
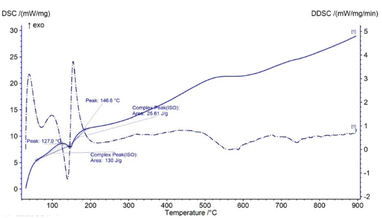 |
| | Fig. 2 Differential scanning calorimetry (DSC) analysis of the raw sample (gypsum). | |
Phase and crystallographic analysis
The XRD patterns of the synthesized gypsum and bassanite are revealed in Fig. 3, and the crystallographic parameters were explored from the generated pattern. The standard ICDD database (card no.: #00-033-0311) was taken into consideration to match the generated data. The synthesized gypsum exerted peaks at 2-theta values of 11.646 (020), 20.74 (021), 23.40 (040), 31.85 (−221), 33.36 (220), 34.56 (−151), 35.98 (−202), 40.69 (151), 45.41 (170), 47.71 (080), 50.34 (062), 51.35 (−262), 56.72 (190), 63.60 (−372), and 68.71 (262). The generated peaks of the synthesized gypsum were identical to those of synthesized gypsum in the ICDD database.
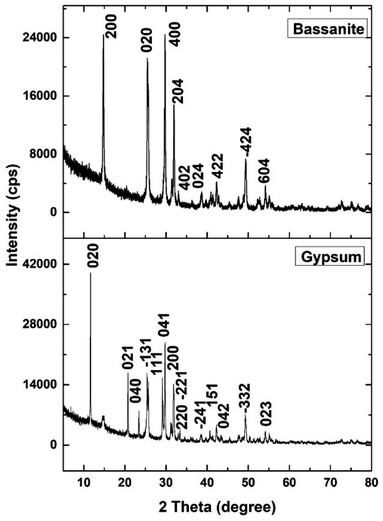 |
| | Fig. 3 X-ray diffraction patterns of gypsum and bassanite synthesized from Pila globosa. | |
The XRD pattern of the synthesized bassanite was compared with the standard ICDD database card no.: #00-041-0224. Nearly identical peak positions were noticed in the case of synthesized bassanite. The XRD-generated peak positions and planes are 14.77 (200), 25.47 (020), 29.75 (400), 31.93 (204), 33.00 (402), 38.68 (024), 42.26 (422), 49.35 (−424), and 54.17 (604). These peaks confirmed the presence of the bassanite phase in the synthesized sample.
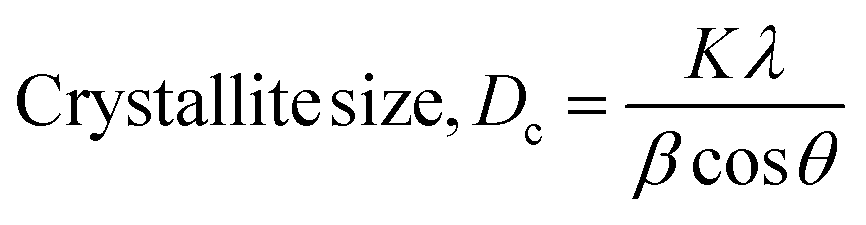
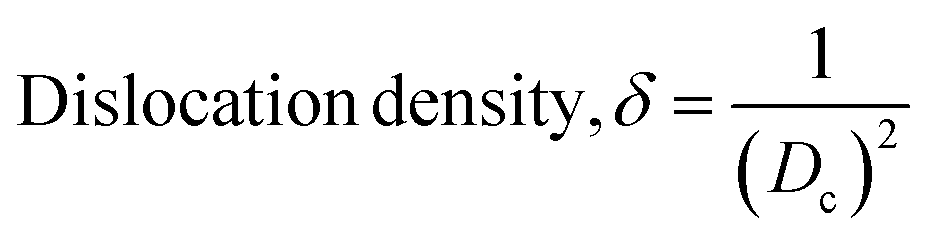
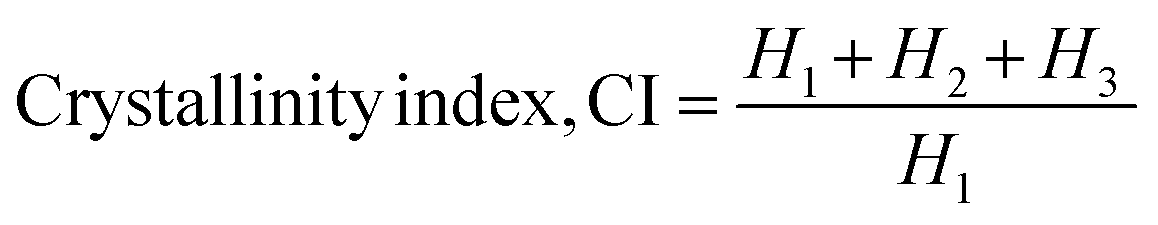
X-ray diffraction is a great tool to characterize materials in terms of crystallography, and the crystallographic parameters are very crucial for any crystalline materials. Along with phase identification, crystallographic parameters such as the crystallite size, crystallinity index, lattice parameters, unit cell volume, dislocation density, and microstrain were estimated using eqn (4)–(10).19–21 Both gypsum and bassanite are monoclinic crystals but have the different space groups of C2/c (15) and I2 (5), respectively.
| |
 | (4) |
| |
 | (5) |
| |
 | (6) |
| |
 | (7) |
| |
 | (8) |
In the above equations,
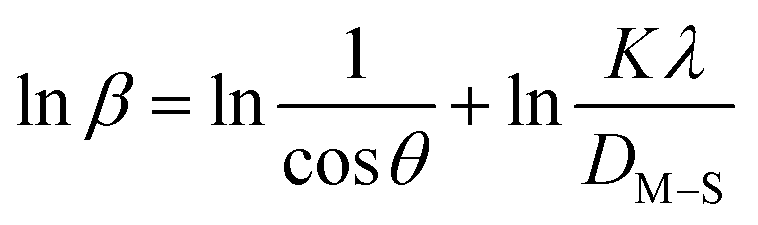
β = full width at half maximum (FWHM) (in radian); Scherrer's constant
K = 0.94;
λ = X-ray source wavelength = 0.15406 nm;
θ = angle of diffraction;
a,
b,
c, and
h,
k,
l = lattice parameters of crystals;
H1 = peak height of the three strongest peaks.
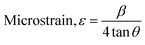
The Scherrer equation (eqn (4)) showed the crystallite sizes of gypsum and bassanite to be 105 nm and 44 nm, respectively. Another important parameter is the dislocation density. In this case, the line dislocation was calculated using eqn (5) and the values for gypsum and bassanite were 0.0907 line per m2 and 0.0516 line per m2, respectively. Eqn (6) depicts the expression for the calculation of lattice parameters, and the unit cell lengths of gypsum are a = 6.297 Å, b = 15.185 Å, and c = 5.672 Å (ICDD standard values of card no.: #00-033-0311: a = 6.284 Å, b = 15.208 Å, c = 5.677 Å) and those of bassanite are a = 11.98 Å, b = 6.927 Å, c = 12.67 Å (standard values of ICDD card no.: #00-041-0224: a = 12.02 Å, b = 6.932 Å, c = 12.691 Å). During the synthesis, microstrains are normally generated in the crystallite. The microstrains of gypsum and bassanite are 0.1864 and 0.356, respectively, which were calculated using eqn (7). Following eqn (8), the crystallinity indices of gypsum and bassanite are 2.037 and 2.365, respectively.
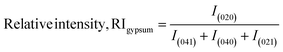
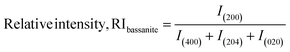
From the relative peak intensities of the XRD pattern, the direction of the crystal growth can be estimated, showing which plane is preferred by the reaction parameters, and this term is widely known as plane preference or simply preference. Three strong peaks are considered to measure the relative intensity (RI) with respect to one single plane. To calculate the relative intensity of the (020) plane, the three strong planes at (040), (021) and (041) were considered.
Thus, the preference along the (020) plane is considered on the basis of the growth of the (040), (021), and (041) planes. The RI for the (020) plane can be computed using eqn (9).22 The RI of a standard is an essential operator for the exploration of preference growth, which was measured from the ICDD card no.: #00-033-0311 of gypsum using eqn (9).
| |
 | (9) |
In eqn (9), the subscript explains the plane of gypsum. The relative intensities of the standard and gypsum samples are 0.521 and 0.505, respectively. In a similar fashion, the relative intensity of bassanite can be explored by utilizing eqn (10). In this case, the relative intensity of the (200) plane was measured considering the (400), (204), and (020) planes.
| |
 | (10) |
The standard RI of bassanite was calculated from the standard ICDD card no.: #00-041-0224 of the same planes. Thus, the calculated relative intensities of the bassanite sample and standard are 0.382 and 0.3333, respectively.
Eqn (11) was employed to estimate the preference growth of the gypsum and bassanite samples.19
| |
 | (11) |
The preference growth of gypsum along the (020) plane and that of bassanite along the (200) plane are 0.0316 and 0.147, respectively. The preference growth of the most significant planes can be measured following the aforementioned methodology. If one plane is thermodynamically stable and the growth of the crystals is favorable, then the preference growth is positive, and vice versa. The positive values of the synthesized gypsum and bassanite carried good evidence of being stable along the abovementioned planes.
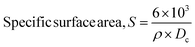
The calculated crystallite size (Dc) and density (ρ) of gypsum and bassanite were used to estimate the specific surface area of the crystal. The crystallite size was computed from the Scherrer equation and the density was picked from the ICDD database. Eqn (12) was employed to measure the specific surface area.23
| |
 | (12) |
The calculated specific surface areas of the synthesized gypsum and bassanite employing eqn (12) are 24 m2 g−1 and 45 m2 g−1, respectively.
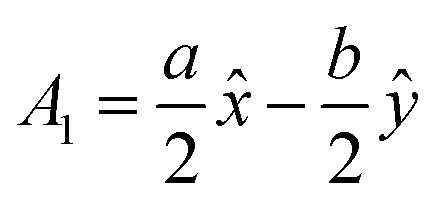
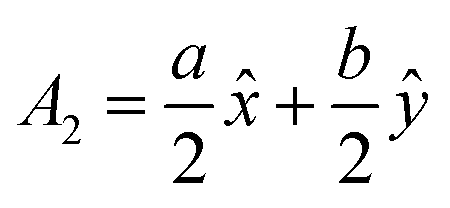
The volume of a monoclinic crystal can be estimated by following the specified equation for each type of crystal. The gypsum crystals belong to the C2/c (15) space groups. Alternatively, it can be ascribed to the based-centered monoclinic group, and the associated equation for unit cell volume calculation is expressed in eqn (13).24 The conventional unit cell parameters for based-centered monoclinic gypsum in vector form are  ;
;  ; and A3 = ccosβ
![[x with combining circumflex]](https://www.rsc.org/images/entities/i_char_0078_0302.gif) + csinβẑ.
+ csinβẑ.
The volume of the base-centered monoclinic (gypsum) unit cell is
| |
 | (13) |
In this equation, the notation carries the conventional significance of the crystallographic unit cell. The calculated volume of the unit cell of gypsum is 247 Å3.
In the case of the bassanite crystal, which is also similar to the simple monoclinic unit cell, the unit cell volume can be quantified by eqn (14).24 The simple unit cell parameters of monoclinic bassanite in vector form are A1 = a; A2 = bŷ; and A3 = ccosβ + csinβẑ.
The volume of the simple monoclinic (bassanite) unit cell is
| | |
V = abcsinβ
| (14) |
The computed crystallite size of the unit cell of bassanite is 1051 Å3, which is very close to its standard volume (1058 Å3).
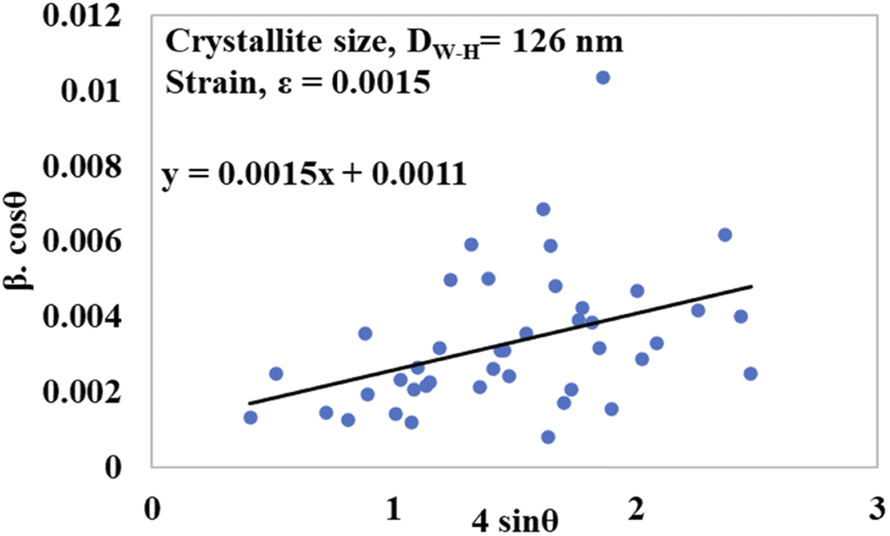
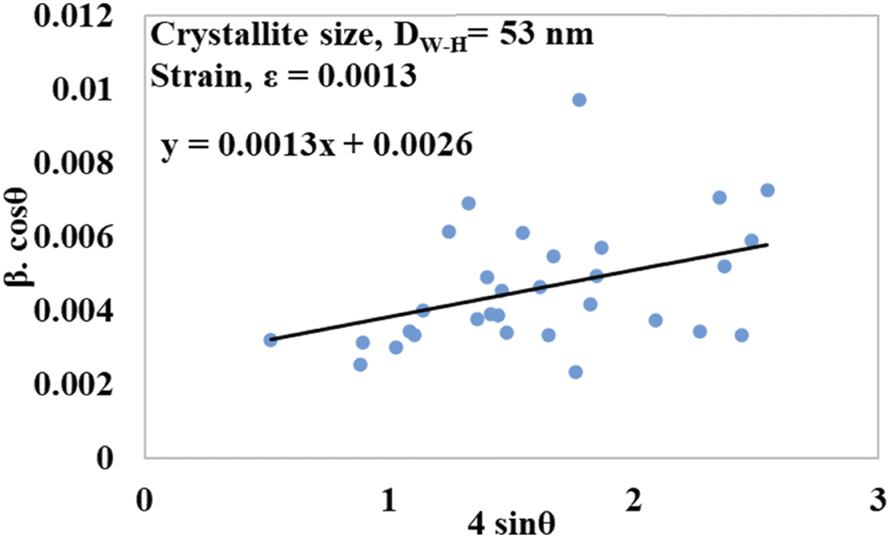
Crystallite size calculation using various models
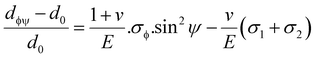
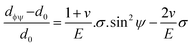
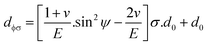
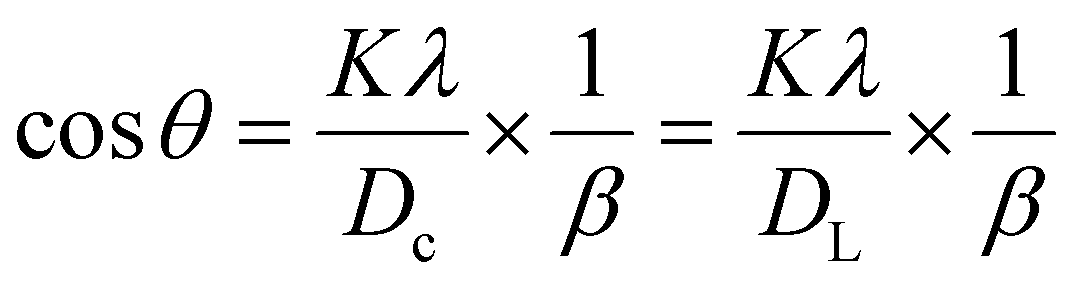
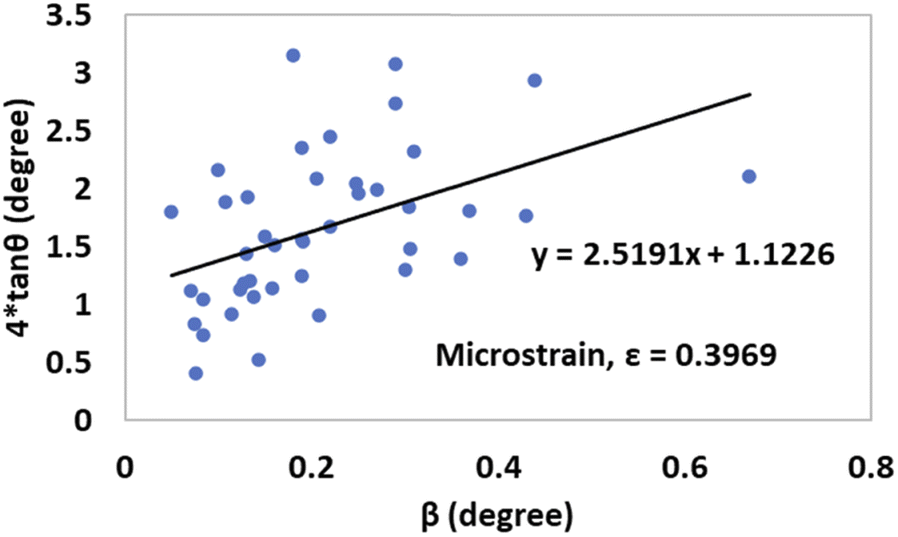
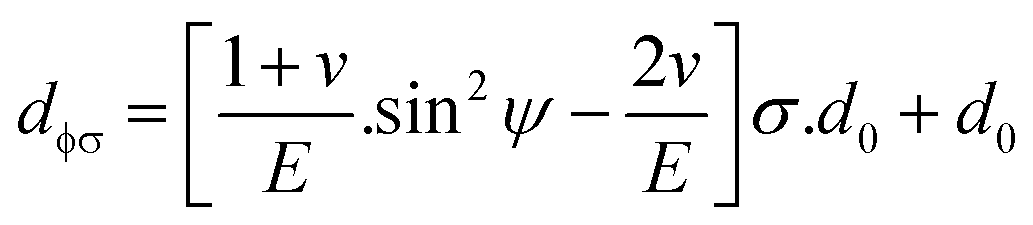
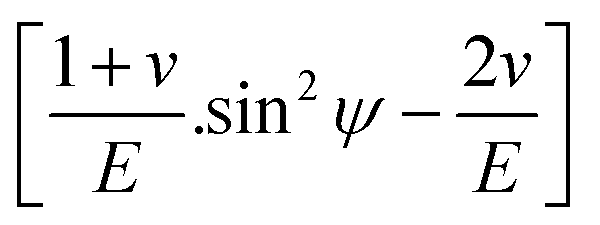
The XRD-sin2![[thin space (1/6-em)]](https://www.rsc.org/images/entities/b_char_2009.gif) Ψ technique for gypsum and bassanite. The XRD-sin2Ψ technique was employed to estimate the residual stress of gypsum and bassanite, and this method is applicable for polycrystalline solid samples. Point defects, dislocations, and impurities induce intrinsic stress or residual stress. The deviation of the lattice parameters from the standard values carried good evidence for the existence of residual stress in the crystals. Intrinsic stress and strain results in the variation of d-spacing. The sin2Ψ technique was employed to calculate the residual stress using eqn (24).33
Ψ technique for gypsum and bassanite. The XRD-sin2Ψ technique was employed to estimate the residual stress of gypsum and bassanite, and this method is applicable for polycrystalline solid samples. Point defects, dislocations, and impurities induce intrinsic stress or residual stress. The deviation of the lattice parameters from the standard values carried good evidence for the existence of residual stress in the crystals. Intrinsic stress and strain results in the variation of d-spacing. The sin2Ψ technique was employed to calculate the residual stress using eqn (24).33| |
 | (24) |
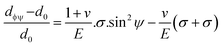
The above equation is the prime formula of stress measurement using the XRD-sin2Ψ technique. Poisson's ratio and Young's modulus are denoted by v and E, respectively, on the (hkl) plane. The other notations are d0 = stress-free d-spacing, dϕΨ = d-spacing with intrinsic stress, σϕ = in plane stress, σ1, σ2 = the two stress components, and Ψ = tilt angle = θ − Ω (glancing angle). The in-plane stress is considered to be directionless. Thus, for simplicity, it can be assumed that σϕ = σ1 = σ2 = σ and eqn (24) can be rearranged as eqn (25)–(27).20,34
| |
 | (25) |
| |
 | (26) |
| |
 | (27) |
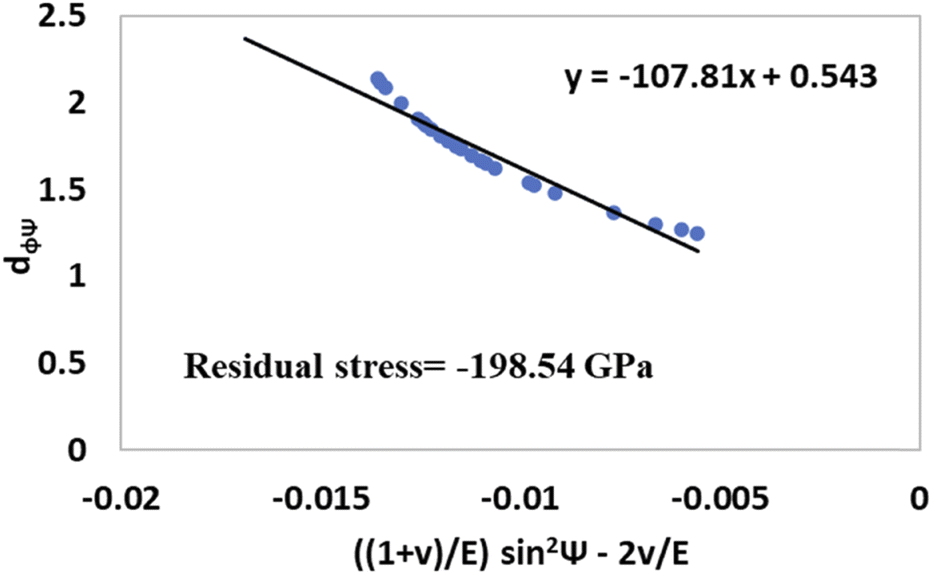
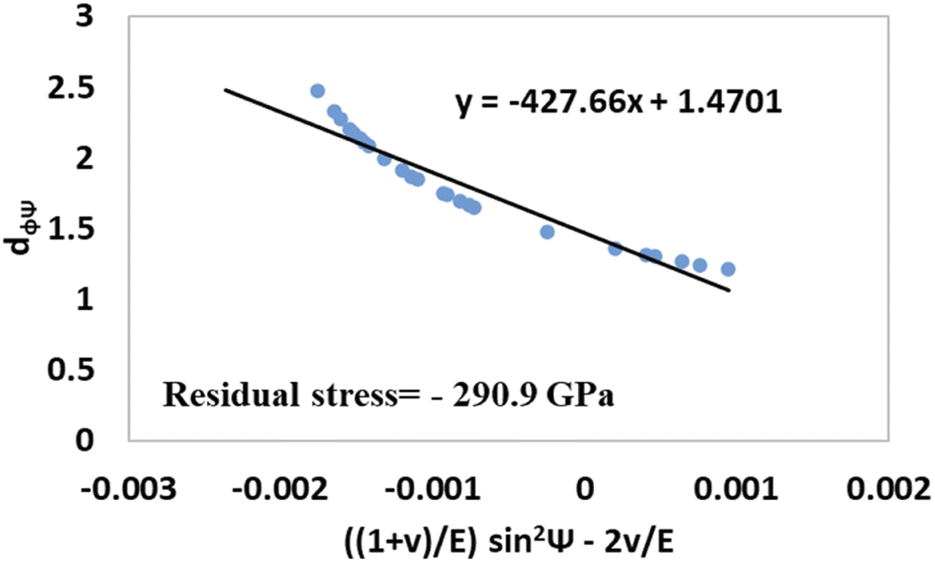
The values of 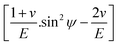 and dϕΨ were plotted on the x-axis and y-axis, respectively, to build a straight-line equation. The values of the Poisson's ratio and Young's modulus were obtained from the literature.35,36 Fig. 14 and 15 represent the corresponding graphs of the residual stress of gypsum and bassanite, respectively, with calculated values. The negative sign of the value indicates compressive stress in the crystals.
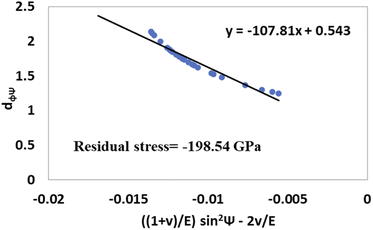 |
| | Fig. 14 Residual stress of gypsum employing the XRD-sin2Ψ technique. | |
 |
| | Fig. 15 Residual stress of bassanite employing the XRD-sin2Ψ technique. | |
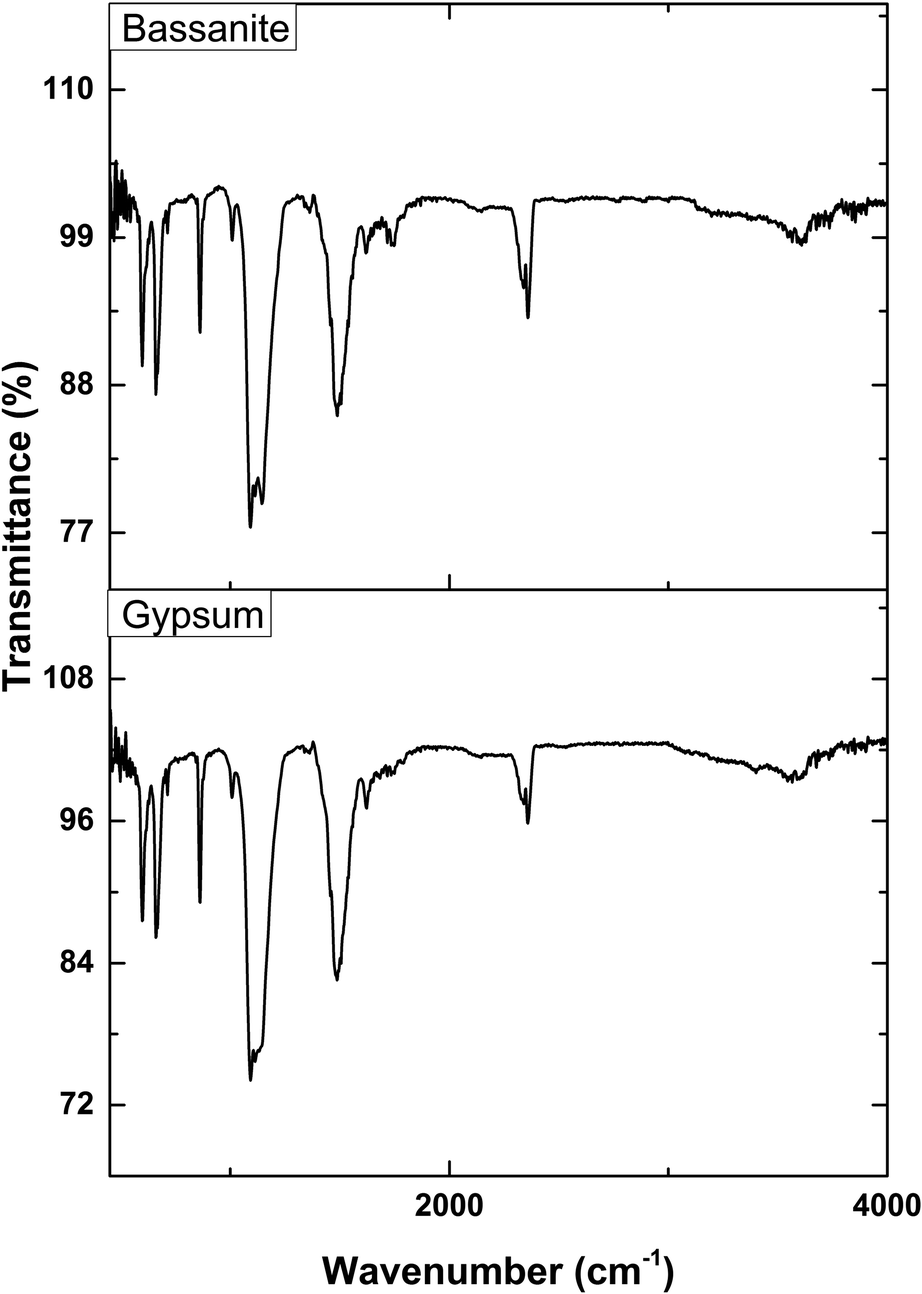
Functional group analysis. The functional groups of gypsum and bassanite were identified using FTIR and only sulphate and hydroxyl groups were present in both the samples. Fig. 16 presents the FTIR spectra of gypsum and bassanite. SO42− peaks were exhibited near 601, 660, and 1092 cm−1 for both the samples. These types of FTIR bands have been reported in a number of studies.37 The peaks near 601 and 660 cm−1 were responsible for the V4(SO4) vibrational mode, while the peaks near 1092 cm−1 arose due to the V3(SO4) vibration.38 The presence of H2O in gypsum and bassanite was confirmed by the appearance of peaks at 1625 and 3400 cm−1. The strong S–O stretching vibration generated peaks within the range of 1050–1200 cm−1, and the S–O bending vibration generated peaks in the 600–700 cm−1 spectral range. These types of stretching and bending vibrations have been previously reported.39 Gypsum and bassanite presented more or less similar spectral bands with a negligible shift.
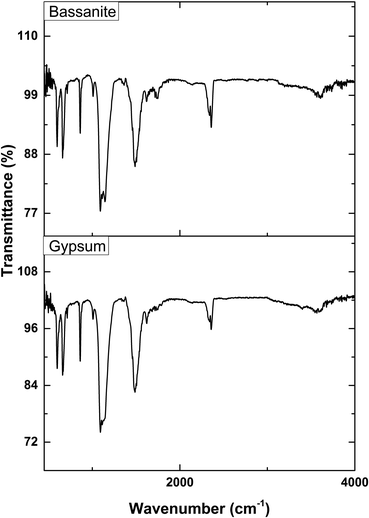 |
| | Fig. 16 FTIR of gypsum and bassanite. | |
Conclusion
Waste Pila globosa shells can be a potential source of the raw materials of gypsum and bassanite, which could minimize environmental pollution and add a new way of recycling. TGA and DSC suggest that at least 200 °C is required for the conversion of gypsum to bassanite. The XRD patterns provide good evidence for the production of gypsum and bassanite from waste Pila globosa shells. A number of crystallographic parameters investigated from the XRD data can assist researchers and industrialists in the fruitful application of these products, i.e., the nano-crystallite size was confirmed by the Scherrer equation as well as a number of model equations. Thus, it is suggested to use Pila globosa shells for the production of gypsum and bassanite.
Data availability
The raw/processed data required to reproduce these findings cannot be shared at this time due to technical or time limitations.
Author contributions
Md. Sahadat Hossain conceived of and designed the experiment, analysed the data, wrote the original manuscript and performed the experiment. Samina Ahmed supervised the overall work and assisted in writing the manuscript.
Conflicts of interest
There are no conflicts to declare.
Acknowledgements
The authors are grateful to the Bangladesh Council of Scientific and Industrial Research (BCSIR) authority for their financial support through R&D project (ref. no. 39.02.0000.011.14.134.2021/900; Date: 30.12.2021). The authors are also grateful to the Ministry of Science and Technology for approving the special allocation project (ref. no. 39.00.0000.009.14.019.21-EAS-464-1211; Date: 15.12.2021). The authors also wish to thank Strengthening Institute of Glass and Ceramics Research & Testing along with its project director Dr Shirin Akter Jahan, PSO, for sophisticated instrumental support. The authors are also grateful to Md. Farid Ahmed, Scientific Officer, for executing the TGA and DSC analysis.
References
- S. Palacio, J. Azorín, G. Montserrat-Martí and J. P. Ferrio, The crystallization water of gypsum rocks is a relevant water source for plants, Nat. Commun., 2014, 5, 1–7 CrossRef PubMed.
- Y. Langevin, F. Poulet, J.-P. Bibring and B. Gondet, Sulfates in the north polar region of Mars detected by OMEGA/Mars Express, Science, 2005, 307, 1584–1586 CrossRef CAS PubMed.
- P. Dhumgond, J. B. CR, S. Sarkar and B. Nagabovanalli, Influence of yellow gypsum on nutrient uptake and yield of groundnut in different acid soils of Southern India, Sci. Rep., 2022, 12, 1–14 CrossRef PubMed.
- S. Singh, S. Maiti, R. S. Bisht, N. B. Balam, R. Solanki, A. Chourasia and S. K. Panigrahi, Performance behaviour of agro-waste based gypsum hollow blocks for partition walls, Sci. Rep., 2022, 12, 1–16 CrossRef PubMed.
- Q. Guan, W. Sun, Y. Hu, Z. Yin and C. Guan, A facile method of transforming FGD gypsum to α-CaSO4·0.5H2O whiskers with cetyltrimethylammonium bromide (CTAB) and KCl in glycerol-water solution, Sci. Rep., 2017, 7, 1–11 CrossRef PubMed.
- X. Qi, Y. Li, L. Wei, F. Hao, X. Zhu, Y. Wei, K. Li and H. Wang, Disposal of high-arsenic waste acid by the stepwise formation of gypsum and scorodite, RSC Adv., 2020, 10, 29–42 RSC.
- O. Rahmani, M. Tyrer and R. Junin, Calcite precipitation from by-product red gypsum in aqueous carbonation process, RSC Adv., 2014, 4, 45548–45557 RSC.
- Y.-W. Wang, Y.-Y. Kim, H. K. Christenson and F. C. Meldrum, A new precipitation pathway for calcium sulfate dihydrate (gypsum) via amorphous and hemihydrate intermediates, Chem. Commun., 2012, 48, 504–506 RSC.
- K. Baolin, Z. Qin, L. Xianhai and S. Zhihui, Adsorption and solidification of cadmium by calcium sulfate dihydrate (gypsum) in an aqueous environment: a dispersion-corrected DFT and ab initio molecular dynamics study, Phys. Chem. Chem. Phys., 2022, 24, 9521–9533 RSC.
- C. E. Schrank, O. Gaede, T. Blach, K. C. M. Gioseffi, S. Mudie, N. Kirby, K. Regenauer-Lieb and A. P. Radliński, Fast in situ X-ray scattering reveals stress sensitivity of gypsum dehydration kinetics, Commun. Mater., 2021, 2, 1–6 CrossRef.
- H. Sharma and D. Prabu, Plaster of Paris: past, present and future, J. Clin. Orthop. Trauma, 2013, 4, 107–109 CrossRef PubMed.
- L. Fu, M. Pujari-Palmer, C. Öhman-Magi, H. Engqvist and W. Xia, Calcium Phosphate Cements: Structure-related Properties, The Chemistry of Inorganic Biomaterials. 2021, vol. 7, p. 99 Search PubMed.
- M. Burgos-Ruiz, G. Pelayo-Punzano, E. Ruiz-Agudo, K. Elert and C. Rodriguez-Navarro, Synthesis of high surface area CaSO4·0.5H2O nanorods using calcium ethoxide as precursor, Chem. Commun., 2021, 57, 7304–7307 RSC.
- J. Li, L. Wu, C. Jia, Q. Chen, Z. Song and B. Guan, Alpha-calcium sulfate hemihydrate used as water-soluble template for synthesis of ZnO hollow microspheres, Mater. Chem. Front., 2022, 6, 1895–1902 RSC.
- K. Elert, C. Benavides-Reyes and C. Cardell, Effect of animal glue on mineralogy, strength and weathering resistance of calcium sulfate-based composite materials, Cem. Concr. Compos., 2019, 96, 274–283 CrossRef CAS.
- G. Camarini, S. M. Pinheiro and K. Tannous, Thermal analysis of recycled gypsum from construction and demolition waste, in: Applied Mechanics and Materials, Trans Tech Publ, 2013, pp. 977–980 Search PubMed.
- K. Ghazi Wakili, E. Hugi, L. Wullschleger and T. H. Frank, Gypsum board in fire—modeling and experimental validation, J. Fire Sci., 2007, 25, 267–282 CrossRef.
- G. Bumanis, J. Zorica, A. Korjakins and D. Bajare, Processing of Gypsum Construction and Demolition Waste and Properties of Secondary Gypsum Binder, Recycling, 2022, 7, 30 CrossRef.
- M. S. Hossain, M. A. A. Shaikh, M. S. Rahaman and S. Ahmed, Modification of the crystallographic parameters in a biomaterial employing a series of gamma radiation doses, Mol. Syst. Des. Eng., 2022 10.1039/D2ME00061J.
- M. Hossain, M. Mahmud, M. B. Mobarak and S. Ahmed, Crystallographic analysis of biphasic hydroxyapatite synthesized by different methods: an appraisal between new and existing models, Chem. Pap., 2022, 76, 1593–1605 CrossRef CAS.
- S. G. Dasari, P. Nagaraju, V. Yelsani, S. Tirumala and R. R. MV, Nanostructured indium oxide thin films as a room temperature toluene sensor, ACS Omega, 2021, 6, 17442–17454 CrossRef CAS PubMed.
- M. Sharma, R. Nagar, V. K. Meena and S. Singh, Electro-deposition of bactericidal and corrosion-resistant hydroxyapatite nanoslabs, RSC Adv., 2019, 9, 11170–11178 RSC.
- K. V. Kumar, T. J. Subha, K. G. Ahila, B. Ravindran, S. W. Chang, A. H. Mahmoud, O. B. Mohammed and M. A. Rathi, Spectral characterization of hydroxyapatite extracted from Black Sumatra and Fighting cock bone samples: A comparative analysis, Saudi J. Biol. Sci., 2021, 28, 840–846 CrossRef PubMed.
- M. J. Mehl, D. Hicks, C. Toher, O. Levy, R. M. Hanson, G. Hart and S. Curtarolo, The AFLOW Library of Crystallographic Prototypes: Part 1, Comput. Mater. Sci., 2017, 136, S1–S828, DOI:10.1016/j.commatsci.2017.01.017.
- M. Rabiei, A. Palevicius, A. Monshi, S. Nasiri, A. Vilkauskas and G. Janusas, Comparing methods for calculating nano crystal size of natural hydroxyapatite using X-ray diffraction, Nanomaterials, 2020, 10, 1627 CrossRef CAS PubMed.
- S. Sahu and P. K. Samanta, Microstructural study and crystallite size analysis of chemically grown bougainvillea flower-like zinc oxide nanostructures, Mater. Today: Proc., 2022, 65, 2502–2505 CAS.
- F. Monjezi, F. Jamali-Sheini and R. Yousefi, Ultrasound-assisted electrodeposition of Cu3Se2 nanosheets and efficient solar cell performance, J. Alloys Compd., 2019, 780, 626–633 CrossRef CAS.
- M. Geravand and F. Jamali-Sheini, Al-doped Ag2S nanostructures: Ultrasonic synthesis and physical properties, Ceram. Int., 2019, 45, 6175–6182 CrossRef CAS.
- A. K. Zak, W. A. Majid, M. E. Abrishami and R. Yousefi, X-ray analysis of ZnO nanoparticles by Williamson–Hall and size–strain plot methods, Solid State Sci., 2011, 13, 251–256 CrossRef.
- I. Chérif, Y. O. Dkhil, S. Smaoui, K. Elhadef, M. Ferhi and S. Ammar, X-Ray Diffraction Analysis by Modified Scherrer, Williamson–Hall and Size–Strain Plot Methods of ZnO Nanocrystals Synthesized by Oxalate Route: A Potential Antimicrobial Candidate Against Foodborne Pathogens, J. Cluster Sci., 2022, 1–16 Search PubMed.
- J. L. Ponce-Ruiz, S. Ishizuka, Y. Todaka, Y. Yamada, A. R. Serrato and J. M. Herrera-Ramirez, Theoretical and Experimental Study of CaMgSi Thermoelectric Properties, ACS Omega, 2022, 7, 15451–15458 CrossRef CAS PubMed.
- Md. S. Hossain, M. Mahmud, M. B. Mobarak, S. Sultana, Md. A. A. Shaikh and S. Ahmed, New analytical models for precise calculation of crystallite size: application to synthetic hydroxyapatite and natural eggshell crystalline materials, Chem. Pap., 2022 DOI:10.1007/s11696-022-02377-9.
- S. Marola, S. Bosia, A. Veltro, G. Fiore, D. Manfredi, M. Lombardi, G. Amato, M. Baricco and L. Battezzati, Residual stresses in additively manufactured AlSi10Mg: Raman spectroscopy and X-ray diffraction analysis, Mater. Des., 2021, 202, 109550 CrossRef CAS.
- Q. Luo and A. H. Jones, High-precision determination of residual stress of polycrystalline coatings using optimised XRD-sin2ψ technique, Surf. Coat. Technol., 2010, 205, 1403–1408 CrossRef CAS.
- J. Sanahuja, L. Dormieux, S. Meille, C. Hellmich and A. Fritsch, Micromechanical explanation of elasticity and strength of gypsum: from elongated anisotropic crystals to isotropic porous polycrystals, J. Eng. Mech. Div., Am. Soc. Civ. Eng., 2010, 136, 239–253 CrossRef.
- J. Fu, Elastic Constants and Homogenized Moduli of Monoclinic Structures Based on Density Functional Theory, Density Functional Calculations: Recent Progresses of Theory and Application. 2018, p. 219 Search PubMed.
- R. J. Sanghavi, S. C. Upadhyay and A. Kumar, Management of solid waste marble powder: improving quality of sodium chloride obtained from sulphate-rich lake/subsoil brines with simultaneous recovery of high-purity gypsum and magnesium carbonate hydrate, Environ. Sci. Pollut. Res., 2022, 29, 40068–40078 CrossRef CAS PubMed.
- P. S. R. Prasad, V. K. Chaitanya, K. S. Prasad and D. N. Rao, Direct formation of the γ-CaSO4 phase in dehydration process of gypsum: In situ FTIR study, Am. Mineral., 2005, 90, 672–678 CrossRef CAS.
- J. S. Pozo-Antonio, E. M. Alonso-Villar and T. Rivas, Efficacy of mechanical procedures for removal of a lichen and a gypsum black crust from granite, J. Build. Eng., 2021, 44, 102986 CrossRef.
|
| This journal is © The Royal Society of Chemistry 2022 |
Click here to see how this site uses Cookies. View our privacy policy here. 
 Open Access Article
 This Open Access Article is licensed under a Creative Commons Attribution-Non Commercial 3.0 Unported Licence
 a and
Samina Ahmed
a and
Samina Ahmed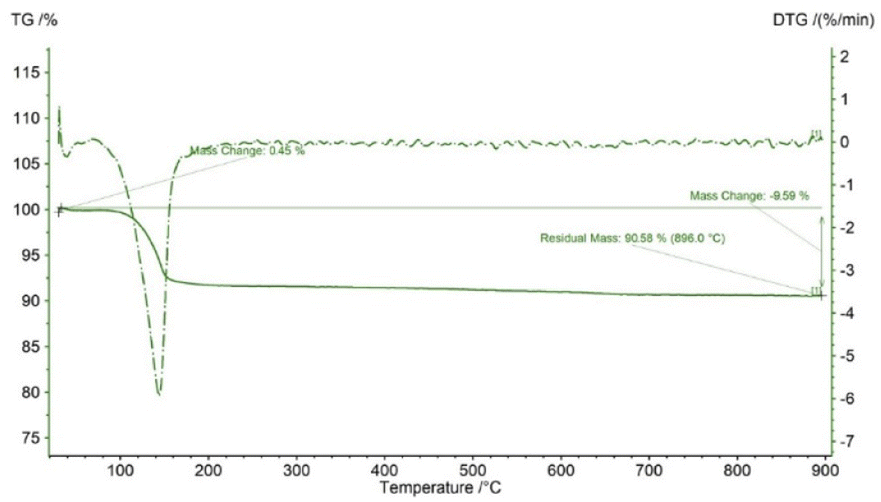


 ;
;  ; and A3 = c
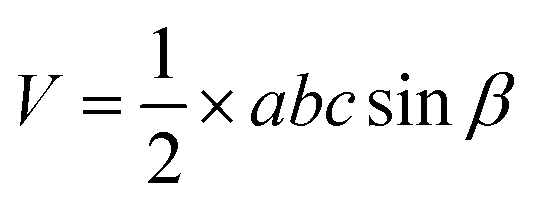
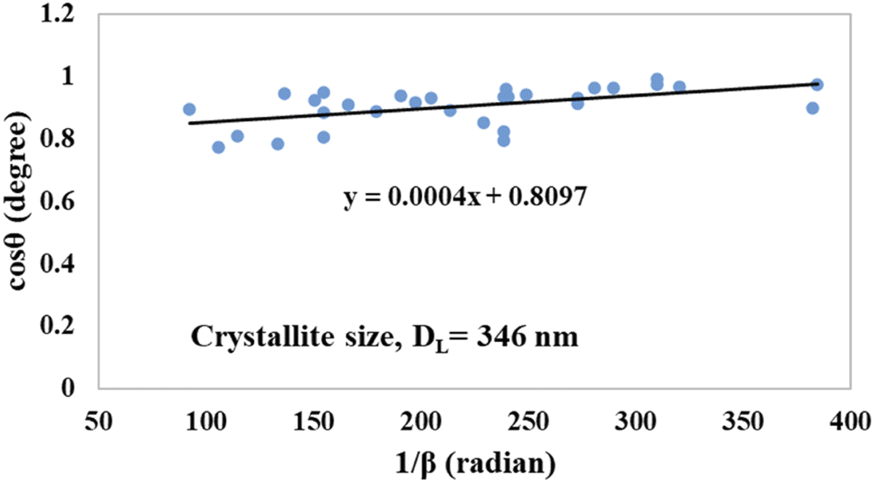
 (in radians) on the x-axis, a straight line can be drawn. The details of this method are described elsewhere.20,25 Employing this method, the generated graphs for gypsum and bassanite are pictured with the inscribed crystallite size in Fig. 4 and 5. The larger values (1386 and 346 nm) of the crystallite size made this model invalid for the gypsum and bassanite samples.
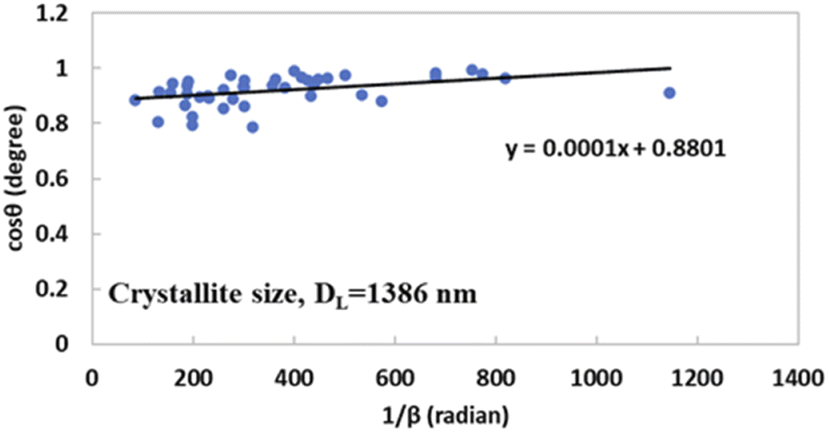
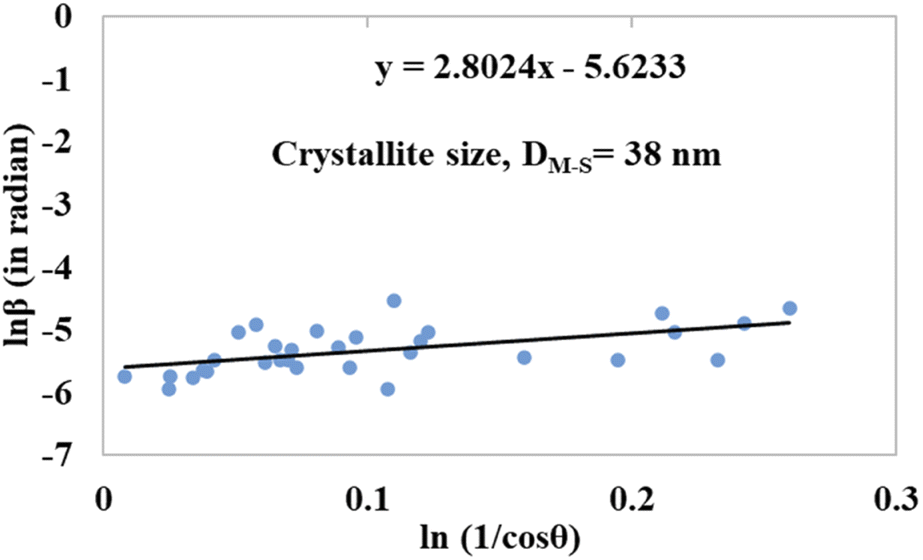
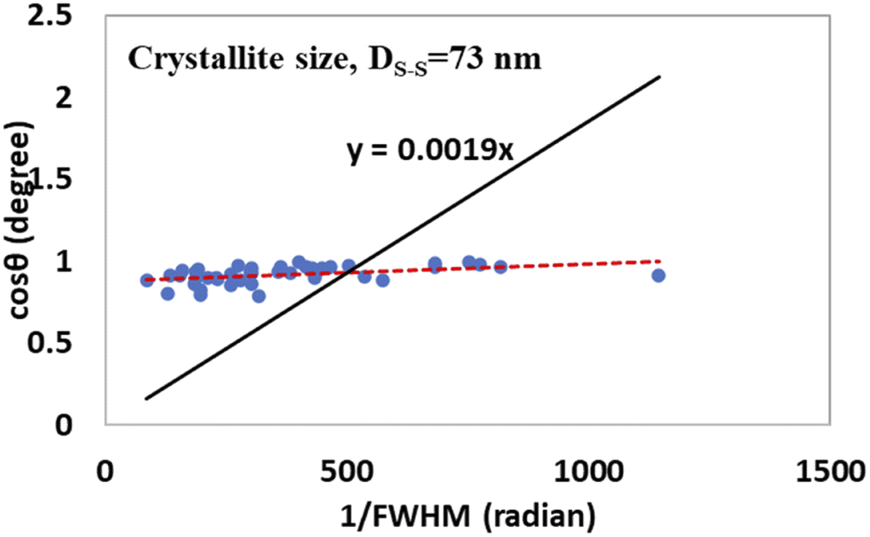
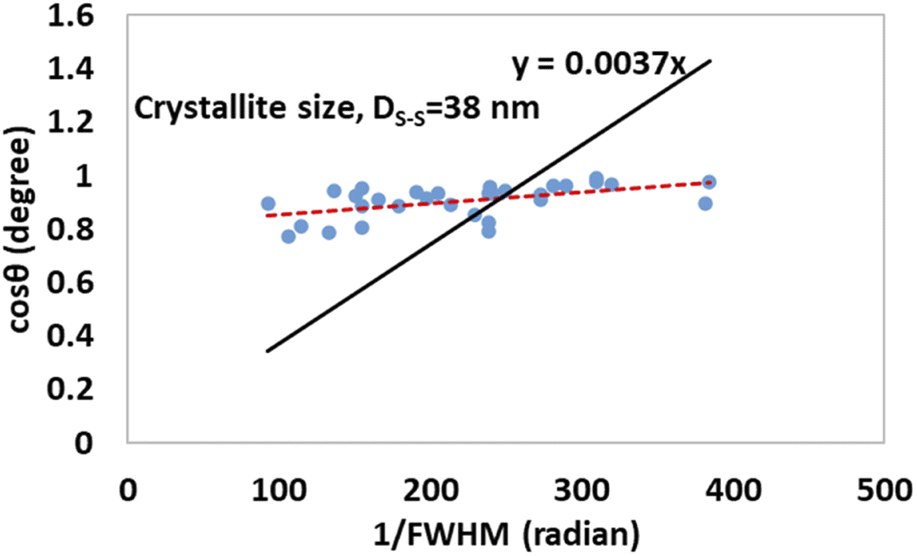
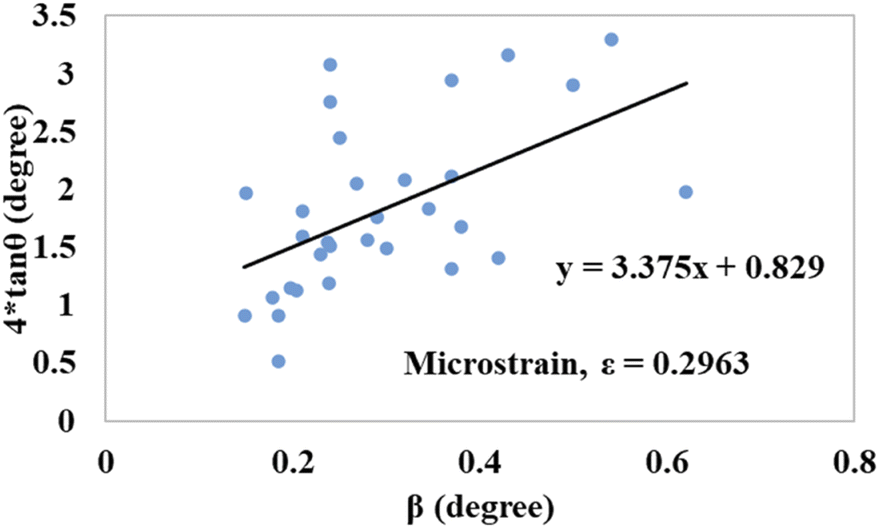
 was considered on the x-axis. The generated straight lines of gypsum and bassanite are visualized in Fig. 6 and 7. The calculated crystallite size from the Monshi–Scherrer model is displayed in the respective illustration.
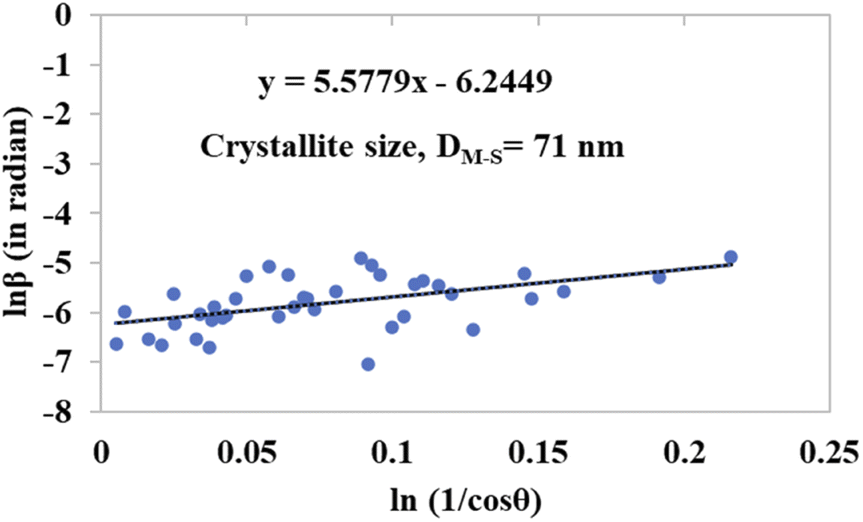
 are plotted on the y-axis and x-axis, respectively. After generating the equation of the straight line, an intercept is built (using the Excel software) that passes through the origin. From the equation of the intercept (which exactly matches with the y = mx equation), the crystallite size is estimated by comparing the generated slope with
  .
.

 and dϕΨ were plotted on the x-axis and y-axis, respectively, to build a straight-line equation. The values of the Poisson's ratio and Young's modulus were obtained from the literature.35,36 Fig. 14 and 15 represent the corresponding graphs of the residual stress of gypsum and bassanite, respectively, with calculated values. The negative sign of the value indicates compressive stress in the crystals.