 Open Access Article
Ratiometric fluorescence sensing of temperature based on perovskite nanocrystals and rhodamine B doped electrospun fibers†
Xiaohong Tana,
Heng Lua,
Yanmei Zhoua,
Shaoru Wua,
Guobin Huangc,
Xudong Wangd,
Jingbin Zenge,
Feiming Liab,
Zhixiong Caiab and
Maosheng Zhang *ab
*ab
aCollege of Chemistry, Chemical Engineering and Environment, Minnan Normal University, Zhangzhou 363000, China
bFujian Province Key Laboratory of Modern Analytical Science and Separation Technology, Minnan Normal University, Zhangzhou 363000, China
cInstitute of Food Safety and Environment Monitoring, Fuzhou University, Fuzhou 350108, China
dHuman Phenome Institute, Fudan University, Shanghai 200438, China
eCollege of Science, China University of Petroleum (East China), Qingdao 266580, China
First published on 14th September 2022
Abstract
Sensing temperature (T) has gained great attention since T is the most important parameter in daily life, scientific research and industry. A ratiometric fluorescence T sensor is fabricated by doping MAPbBr3 perovskite nanocrystals (PNCs) and rhodamine B (RhB) into a polyacrylonitrile (PAN) matrix and the composite materials are electrospun into optical fibers. The fibers show characteristic emissions at 521 and 587 nm under UV irradiation (λex = 365 nm). Both emission intensities gradually increased with elevating T, accompanied with a fluorescence color change from green to yellow. There is a linear relationship between fluorescence intensity ratio (I521/I587) and T in the range of 30–45 °C. The T response sensitivity is as high as 4.38% °C−1 at 45 °C.
1. Introduction
Temperature (T) plays a vital role in daily life, scientific research and industry. Constructing a T sensor with high sensitivity, good reliability and real-time response is highly in demand in various fields. Conventional T sensors include resistance T detectors,1 thermal sensors,2 infrared T sensors,3 mercury thermometers and so forth. However, these methods have some limitations, such as expensive equipment and low sensitivity. Fluorescence T sensors have unique properties in that they are able to measure T remotely. The fluorescent materials can be immobilized or painted on the place of interest and signals can be read out via fiber optic technology. Up to now, most fluorescence T sensors were constructed based on a single fluorophore.4–7 They tend to be strongly influenced by fluorescence background, scattered light, fluctuation of light source and optics. To overcome these problems, ratiometric fluorescence T sensors have been developed.8–11 Ratiometric sensing of T utilized two fluorescence emission peaks as signal. Salas-Juárez et al. reported a novel ratiometric fluorescence sensor for monitoring T in the range of 25–100 °C. Lanthanide complex Tb/Eu-TPTZ incorporated in polymethyl methacrylate (PMMA) matrix was used as T-response material.12 Qiu and coworkers developed a ratiometric T sensor based on the opposite thermal quenching behaviors of Cr3+ and Tb3+ in a mixture of Cr3+-doped phosphor (LiAl5O8: Cr3+) and Tb3+-doped phosphor (LuPO4: Tb3+).13Halide perovskites nanocrystals (PNCs) are promising fluorescence materials due to their outstanding characteristics, including high photoluminescence quantum yield (PLQY), narrow emission band, tunable band gap, convenient synthesis and low-cost.14–18 Methylammonium lead halide perovskites, MAPbX3 (X = Cl, Br, I) PNCs, have attracted increased attention in the fields of solar cells, light-emitting diodes, and photodetectors. However, only few reports on the fluorescence T sensing based on MAPbX3 PNCs, which can be attributed into two reasons: (1) MAPbX3 PNCs are facilitated interference during T sensing due to their poor stability in a humid environment;19 (2) pure MAPbX3 PNCs have low response sensitivity to T although fluorescence quenching often occurs with increase of T.20
Conventionally, encapsulation of halide PNCs into protecting matrices, such as SiO2,21 TiO2,22 Al2O3 (ref. 23) and polymer, are an effective route to enhance their stability. The matrices not only preserve halide PNCs from moisture, oxygen, and UV light, but also reduce the agglomeration of halide PNCs. Electrospinning fibers were used as protecting matrices of halide PNCs, which showed high stability, good surface to volume ratio, increased porosity and high flexibility. Easily accessible polymers, such as PMMA,24 poly(vinylidene fluoride) (PVDF),25 polyacrylonitrile (PAN)26 and polystyrene (PS),27 have been used as electrospinning materials to encapsulate halide PNCs. Surprisingly, encapsulating MAPbBr3 PNCs into PAN electrospinning fibers not only significantly enhance their stability, but also improve their sensitivity to T in the range of 30–45 °C. These properties make them suitable for fluorescence T sensing.
We developed here a novel ratiometric T sensor based MAPbBr3&RhB@PAN fibers by encapsulating MAPbBr3 PNCs and RhB into PAN. The fibers possess two separated fluorescence emission peaks once excited at 360 nm. With the increase of T in the range of 30–45 °C, the fluorescence intensity of MAPbBr3 PNCs increased. Meanwhile, the fluorescence intensity of RhB increased owing to fluorescence resonance energy transfer (FRET). Variation of two fluorescence intensities resulted in fluorescence color change from green to yellow. The proposed ratiometric fluorescence T sensing provided an ingenious method for monitoring T with the advantage of convenience and sensitivity.
2. Results and discussion
2.1. Characterization of PAN, RhB@PAN, MAPbBr3@PAN and MAPbBr3&RhB@PAN fibers
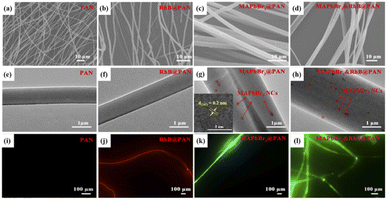
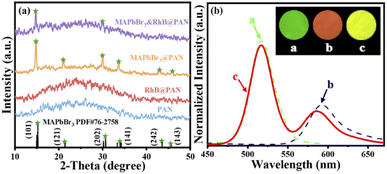
SEM images in Fig. 1a–d show all fibers are long and straight. The surface of PAN and RhB@PAN fibers is rather smooth while the surface of MAPbBr3@PAN and MAPbBr3&RhB@PAN fibers is slightly rough, which may prove the encapsulation of MAPbBr3 PNCs. Furthermore, compared to the diameter of PAN fibers (Fig. 1a, ∼1 μm) and RhB@PAN fibers (Fig. 1b, ∼1 μm), the diameter of MAPbBr3@PAN fibers (Fig. 1c, ∼2.4 μm) and MAPbBr3&RhB@PAN fibers (Fig. 1d, ∼3.3 μm) has a significant increase due to the additional MAPbBr3 PNCs. TEM images show that there are abundant nanoparticles (circled in red) dispersed in MAPbBr3@PAN fibers (Fig. 1g) and MAPbBr3&RhB@PAN fibers (Fig. 1h). The lattice fringes with intervals of 0.2 nm are observed in the HRTEM of nanoparticles (the insert image of Fig. 1g) assigned to the d-distance of (242) plane of MAPbBr3 PNCs. Confocal fluorescence microscopy is used to verify the fluorescence properties of the electrospinning fibers. It is obvious that the PAN fibers exhibit no fluorescence (Fig. 1i). On the contrary, the RhB@PAN fibers (Fig. 1j) and MAPbBr3@PAN fibers (Fig. 1k) show vivid red and green fluorescence, respectively. The MAPbBr3&RhB@PAN fibers (Fig. 1l) display yellow fluorescence which confirms the co-encapsulation of MAPbBr3 PNCs and RhB. In order to verify the MAPbBr3&RhB@PAN fibers are successfully prepared, we measured the elemental composition by EDS, as shown in Fig. S1a–d.† The result indicates the presence of C (25.29%), N (27.05%), O (15.34%), Cl (0.49%), Pb (0.80%) and Br (2.04%) in MAPbBr3&RhB@PAN fibers (Fig. S1d†). By a sharp contrast, pristine PAN fibers (Fig. S1a†) only exist C and N.The crystal structure of PAN, RhB@PAN, MAPbBr3@PAN and MAPbBr3&RhB@PAN fibers are further characterized by XRD and results are summarized in Fig. 2a. The broad diffraction peak from 15° to 40° of PAN and RhB@PAN fibers indicate they do not have obvious crystal structure. In contrast, the MAPbBr3 (PDF# 76-2758), MAPbBr3@PAN fibers diffraction peaks at 2-theta values are 15°, 21°, 30°, 33.9°, 43° and 45.5° corresponding to (101), (121), (202), (141), (242) and (143) lattice planes, respectively. Peaks at 15° and 30° are assigned to the (101) and (202) of MAPbBr3&RhB@PAN fibers, respectively. It is confirmed that MAPbBr3 PNCs are encapsulated into PAN matrixes by electrospinning fibers. Fig. 2b shows fluorescence spectra of MAPbBr3@PAN, RhB@PAN and MAPbBr3&RhB@PAN fibers. Under the excitation of 360 nm, the MAPbBr3@PAN and RhB@PAN fibers exhibit strong fluorescence emission peaks at 521 with full width at half maximum (FWHM) values of 28 nm and 590 nm with FWHM values of 45 nm, respectively. The fluorescence spectrum of MAPbBr3&RhB@PAN fibers displays dual emission peaks at 521 and 587 nm under the same excitation wavelength which indicates MAPbBr3&RhB@PAN fibers can be used as fluorescence materials of ratiometric fluorescence T sensing. The photographs of the MAPbBr3@PAN, RhB@PAN and MAPbBr3&RhB@PAN fibers under UV light show green, red, and yellow fluorescence, respectively (inset in Fig. 2b). According to these results, the MAPbBr3&RhB@PAN fibers are confirmed to be successfully synthesized.
2.2. Condition optimization for dual-emission ratiometric fluorescence sensing
In order to maximize T sensitivity, several key factors including fluorescence response time and concentration ratio of MAPbBr3 and RhB are studied in details, which has great influence on T sensing response. As shown in Fig. 3, the maximum value of (I521/I587)0 − (I521/I587) is observed when MAPbBr3 PNCs and RhB is 9% and 0.1%, respectively. Fig. S2† exhibits that the fluorescence response reaches stable in 10 min after heating in 45 °C. Therefore, 9% MAPbBr3, 0.1% RhB and response time at 10 min are selected as the optimal ratio for the following experiment.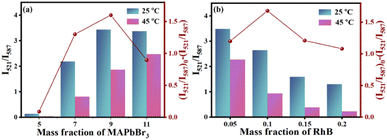 | ||
| Fig. 3 Influence of the amounts of (a) MAPbBr3 and (b) RhB at 25 °C and 45 °C of MAPbBr3&RhB@PAN fibers. | ||
2.3. Stability of MAPbBr3&RhB@PAN fibers
The stability of ratiometric fluorescence T sensor plays a vital role in the field of practical applications. Experiments under different conditions (i.e., ambient air, moisture, and UV-light irradiation) were carried out. As observed in Fig. S3a,† the I521/I587 of MAPbBr3&RhB@PAN fibers remain constant during immersing the fibers in water for 15 days. The materials have outstanding hydrophobicity, which is also supported by the fact that the water contact angle of MAPbBr3&RhB@PAN fibers is 116.51° (the insert picture of Fig. S3a†). The I521/I587 of MAPbBr3&RhB@PAN fibers nearly remains unchanged for 10 days when storing the material at ambient air (20–25 °C) and relative humidity of 60–80% (Fig. S3b†). The MAPbBr3&RhB@PAN fibers remain stable for at least 4 h under 365 nm UV-light continuous irradiation (Fig. S3c†). Based on these results, it is evident that the hydrophobic PAN can effectively reduce the contact between PNCs and the atmosphere to improve the stability of PNCs.2.4. Performance of dual-emission ratiometric fluorescence T sensing
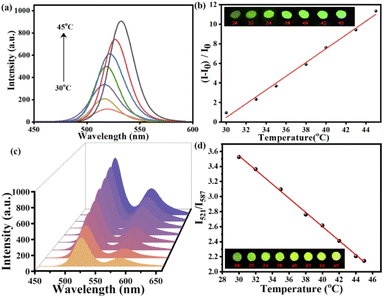
The T sensors based on MAPbBr3@PAN and MAPbBr3&RhB@PAN fibers have been constructed under optimized conditions. As shown in Fig. 4a, the fluorescence intensity at 521 nm increases with T increasing, and there is a good linear relationship (r2 = 0.9919) between intensity ratio and T in the range of 30–45 °C (Fig. 4a). The linear regression equation is (Fig. 4b):| (I − I0)/I0 = 0.702T − 20.603 | (1) |
For MAPbBr3&RhB@PAN fibers, the fluorescence intensity of 521 nm and 587 nm emission peaks all display increase in the range of 30–45 °C (Fig. 4c). Moreover, the calibration plot of I521/I587 versus T in the range of 30–45 °C displays a good linear with r2 of 0.9987 (Fig. 4d). The linear curve fit an equation:
| Δ = I521/I587 = 6.36 − 0.094T | (2) |
The dual emission can be further used for colorimetric sensing of T, in which results can be readout by bare eyes. Obviously, the monochrome color change shown in the insert picture of Fig. 4b is difficult to be distinguished by eyes. However, the MAPbBr3&RhB@PAN fibers show highly distinguishable color change from green to yellow under 365 nm UV-lamp (the insert picture of Fig. 4d).
An important parameter to compare the performance of T sensor is thermal sensitivity, which represents the response of I521/I587 with T changing. Absolute sensitivity (Sa) and relative sensitivity (Sr) can be expressed as:12
 | (3) |
 | (4) |
From eqn (3), one can see that Sa is the slope in the linear relationship (Sa = 9.4%), which relies on T changing and the material used. Sr can be used to compare the performance of different T sensors (eqn (4)). In our work, Sr value is 4.38% °C−1 at the maximum T measured (Tm = 45 °C). The Table 1 lists the maximum Sr of different ratio fluorescence T sensing materials in different T ranges. Compared with other materials, MAPbBr3&RhB@PAN fibers have a higher Sr value at lower T. And the morphological of MAPbBr3&RhB@PAN fibers shows negligible change in different T (Fig. S4†). The thermal stability of MAPbBr3&RhB@PAN fibers is evaluated by TGA curves, which can be roughly divided into three weight loss stages as shown in Fig. S5†.28,29 The fibers lose about 8% of the initial weight from 30 °C to 287 °C in the first stage, which is mainly attributed to evaporation of water molecules on the surface of fibers and low boiling temperature volatile compounds (DMF). In the range from 287 to 460 °C, there is a sudden decline (weight loss is about 45%), signifying a cyclization, dehydrogenation and thermal cross-linking process of PAN. In the third stage above 460 °C, the weight loss takes place at a relatively steady pace as for MAPbBr3&RhB@PAN fibers, which might be resulted from the partial evaporation of NH3 and HCN. From the analysis above, the novel ratiometric fluorescence T sensor could be constructed by MAPbBr3&RhB@PAN fibers, which indicates that the ratiometric fluorescence T sensor had a potential application for on-site T measurement.
| Materials | T range (°C) | Sr max (% °C−1) | Ref. |
|---|---|---|---|
| a Covalent organic framework (PP-TzDa), 2,4,6-tris(2-pyridyl)-1,3,5-triazine (TPTZ), Zn-based metal–organic framework (Zn-TCOMA), 4-(4-(dimethylamino)styryl)-1-ethylpyridinium (DMASE), biphenyl-4,4′-dicarboxylate (BPDC), adeninate (Ad). | |||
| Zn-TCOMA⊃DMASE | 20–60 | 1.8 | 10 |
| UiO-66(Zr & Eu) | −36–64 | 4.26 | 11 |
| (Tb/Eu-TPTZ)PMMA | 25–100 | 2.98 | 12 |
| Ad/Tb0.999Eu0.001/BPDC | −173–27 | 1.23 | 30 |
| PP-TzDa | 20–100 | 0.95 | 31 |
| CsPbBr3@Eu-BTC | 20–100 | 3.9 | 32 |
| MAPbBr3&RhB@PAN | 30–45 | 4.38 | This work |
2.5. Mechanism of ratiometric fluorescence T sensor MAPbBr3&RhB@PAN fibers
Generally, the fluorescence intensity of fluorescence materials decreases with increasing T due to thermal quenching. However, MAPbBr3@PAN fibers show reverse trends, whose intensity increases markedly with increasing T in the range of 30–45 °C. According to literature, the fluorescence enhancement with increasing T may be attributed to the followed reasons: (1) the aggregation degree of PNCs is lower at higher T and results in decreased concentration quenching of fluorescence. However, this phenomenon often occurs in solution system, not in polymer fibers;33 (2) delayed fluorescence can lead to the increase of fluorescence intensity with increasing T, when the fluorescence lifetime of fluorescence materials is about several milliseconds.34,35 However, in our case, the fluorescence lifetime of MAPbBr3@PAN fibers is about several nanoseconds; (3) the thermally activated passivation can also enhance by reducing the surface defects of PNCs, thus resulting in fluorescence enhancement with increasing T. For MAPbBr3@PAN fibers, the nitrile grouping (–CN) in PAN can passivate MAPbBr3 PNCs since it is easy to form strong coordination bonds with Pb2+ after thermal treatment. This result is similar to Xie's report.36 As further proof, MAPbBr3@PS, MAPbBr3@PVDF and MAPbBr3@PMMA fibers are synthesized and their T sensitive experiment are investigated. As shown in Fig. 5, except MAPbBr3@PAN fibers, fluorescence intensity of other fibers decrease with increasing T. The fluorescence spectra of RhB@PAN fibers are shown in Fig. S6.† The fluorescence intensity of RhB in RhB@PAN fibers shows negligible change after thermal treatment under 360 nm excitation (Fig. S6a†). Surprisingly, the fluorescence intensity of RhB increases with increasing T in MAPbBr3&RhB@PAN fibers (Fig. S6b†). We believe this result is directly related to the FRET from MAPbBr3 PNCs to RhB in MAPbBr3&RhB@PAN fibers.37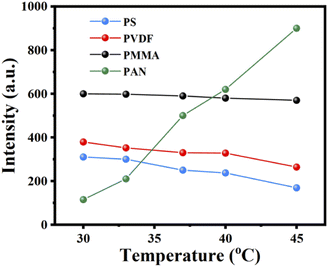 | ||
| Fig. 5 The fluorescence intensity of the MAPbBr3@PS (blue), MAPbBr3@PVDF (red), MAPbBr3@PMMA (black) and MAPbBr3@PAN (green) fibers in the range of 30–45 °C. | ||
FRET is the process of nonradiative energy transfer between fluorescent donor and light-absorbing receptor. The occurrence of FRET highly depends on the extent of spectral overlap and the distance between the donor and receptor. FRET rate can be calculated to related parameters such as Förster distance (R0), overlap integral (J(λ)) and energy transfer efficiency (E). It can be found in Fig. S7a,† the absorbance spectrum of RhB significantly overlaps the emission spectrum of MAPbBr3 PNCs. R0 should be between the range of approximately 1 to 10 nm of donor and receptor in FRET, defined as follows:38
| R0 = 8.8 × 10⁻²⁵K2n−4ψJ(λ) | (5) |
 | (6) |
 | (7) |
Thus, the proposed FRET mechanism is depicted in Fig. S7b.† Under 365 nm UV light, MAPbBr3 PNCs absorb photons and then are excited to a higher electronic energy state (excited state). MAPbBr3 PNCs in the excited state return to the ground state after transferring the energy to the RhB through the dipole interaction between MAPbBr3 PNCs and RhB, which cause the intensity of RhB increase.
3. Conclusions
In summary, a novel ratiometric fluorescence T sensor has successfully been constructed by doping MAPbBr3 PNCs and RhB into PAN fibers via electrospinning technique. The amounts of MAPbBr3 PNCs and RhB was optimized to improve T sensing sensitivity. When the T rising, both fluorescence intensities of MAPbBr3 and RhB increase due to passivation and FRET, respectively. There is apparent fluorescence color change with increasing T which can be inspected by bare eyes under 365 nm UV-lamp. There is a good linear relationship between fluorescence ratio and T in the range of 30–45 °C. The MAPbBr3&RhB@PAN fibers exhibit excellent performance with a high relative sensitivity of 4.38% °C−1. The colorimetric sensor provides a new method for on-site T measurement for its convenient synthesis and low-cost, which indicates the application prospect in T sensing.Conflicts of interest
The authors declared that they have no conflicts of interest to this work.Acknowledgements
This work was supported by the National Natural Science Foundation of China (No. 21904055, 22004055), Natural Science Foundation of Fujian Province, China (No. 2021H6033, 2020J05165, 2020J05164), Science and Technology Projects of the Education Department, Fujian Province of China (No. JK2017032).Notes and references
- L. Okte, A. Raman, B. Raj and N. Kumar, Silicon, 2021, 1–11 Search PubMed.
- P. Jin, L. Xu, T. Jiang, L. Zhang and J. Huang, Int. J. Heat Mass Transfer, 2020, 163, 120437–120446 CrossRef.
- H. Y. Chen, A. Chen and C. Chen, Sensors, 2020, 20, 2885–2902 CrossRef CAS PubMed.
- B. Li, J. Coord. Chem., 2020, 73, 429–438 CrossRef CAS.
- S. Wang, J. Cao and C. Lu, New J. Chem., 2020, 44, 4547–4553 RSC.
- A. Vysniauskas, B. Cornell, P. S. Sherin, K. Maleckaite, M. Kubankova, M. A. Izquierdo, T. T. Vu, Y. A. Volkova, E. M. Budynina, C. Molteni and M. K. Kuimova, ACS Sens., 2021, 6, 2158–2167 CrossRef CAS PubMed.
- Y. Sun, W. He, X. Sun and B. Liu, Luminescence, 2020, 35, 1416–1423 CrossRef CAS.
- Y. Yang, L. Lin, P. Lu, Z. Feng, Z. Li, J. Cai, Z. Mei, Y. Huang, W. Guo, Z. Wang and Z. Zheng, J. Lumin., 2021, 240, 118410–118418 CrossRef CAS.
- X. Sun, L. Cai, W. He, X. Cao, B. Liu and H. Wang, Spectrochim. Acta, Part A, 2022, 264, 120266–120274 CrossRef CAS PubMed.
- Y. Wan, Y. Cui, Y. Yang and G. Qian, Chin. Chem. Lett., 2021, 32, 1511–1514 CrossRef CAS.
- J. F. Feng, T. F. Liu, J. Shi, S. Y. Gao and R. Cao, ACS Appl. Mater. Interfaces, 2018, 10, 20854–20861 CrossRef CAS PubMed.
- C. J. Salas-Juárez, R. E. Navarro, A. Pérez-Rodríguez, U. Orozco-Valencia and R. Aceves, Sens. Actuators, A, 2020, 315, 112293 CrossRef.
- L. Qiu, P. Wang, X. Wei, F. Chi, Y. Chen and M. Yin, J. Alloys Compd., 2021, 879, 160461 CrossRef CAS.
- H. Si, C. Xu, Y. Ou, G. Zhang, W. Fan, Z. Xiong, A. Kausar, Q. Liao, Z. Zhang, A. Sattar, Z. Kang and Y. Zhang, Nano Energy, 2020, 68, 104320 CrossRef CAS.
- Y. Yang, D. Wu, Z. Zhang, W. Cao, X. Zhao, Y. Hao, P. Yang and J. Wang, Chem. Phys. Lett., 2020, 759, 137985–137991 CrossRef CAS.
- X. Min, Q. Xie, X. Wang and M. Chen, Surf. Interfaces, 2021, 22, 100870–100884 CrossRef CAS.
- L. Protesescu, S. Yakunin, M. I. Bodnarchuk, F. Krieg, R. Caputo, C. H. Hendon, R. X. Yang, A. Walsh and M. V. Kovalenko, Nano Lett., 2015, 15, 3692–3696 CrossRef CAS PubMed.
- Y. Zhao, J. Li, Y. Dong and J. Song, Isr. J. Chem., 2019, 59, 649–660 CrossRef CAS.
- Z. Liu, Y. Zhang, Y. Fan, Z. Chen, Z. Tang, J. Zhao, Y. Lv, J. Lin, X. Guo, J. Zhang and X. Liu, Surf. Interfaces, 2018, 10, 13053–13061 CAS.
- A. Dualeh, P. Gao, S. I. Seok, M. K. Nazeeruddin and M. Grätzel, Chem. Mater., 2014, 26, 6160–6164 CrossRef CAS.
- Q. Zhong, M. Cao, H. Hu, D. Yang, M. Chen, P. Li, L. Wu and Q. Zhang, ACS Nano, 2018, 12, 8579–8587 CrossRef CAS PubMed.
- Z. J. Li, E. Hofman, J. Li, A. H. Davis, C. H. Tung, L. Z. Wu and W. Zheng, Adv. Funct. Mater., 2017, 28, 1704288 CrossRef.
- G. Longo, A. Pertegás, L. Martínez-Sarti, M. Sessolo and H. J. Bolink, J. Mater. Chem. C, 2015, 3, 11286–11289 RSC.
- G. Jiang, C. Guhrenz, A. Kirch, L. Sonntag, C. Bauer, X. Fan, J. Wang, S. Reineke, N. Gaponik and A. Eychmuller, ACS Nano, 2019, 13, 10386–10396 CrossRef CAS PubMed.
- G. Huang, Y. Zhou, F. Li, X. Tan, Z. Cai, D. Luo, T. Chen and M. Zhang, Sens. Actuators, B, 2021, 347, 130618 CrossRef CAS.
- J. Lu, L. Zhang, C. Peng, L. Rao and M. Wan, Chem. Lett., 2016, 45, 312–314 CrossRef CAS.
- X. Liang, M. Chen, Q. Wang, S. Guo and H. Yang, Angew. Chem., Int. Ed. Engl., 2019, 58, 2799–2803 CrossRef CAS.
- X. Zhang, Y. Qi, J. Yang, S. Dong, J. Liu, J. Li and K. Shi, Polym. Degrad. Stab., 2021, 191, 109680 CrossRef CAS.
- Q. Niu, X. Zhu, Y. Tang, J. Nie and G. Ma, Mater. Sci. Eng., C, 2017, 77, 326–332 CrossRef CAS.
- X. Shen, Y. Lu and B. Yan, Eur. J. Inorg. Chem., 2015, 2015, 916–919 CrossRef CAS.
- M. Huang, J. Chong, C. Hu and Y. Yang, Inorg. Chem. Commun., 2020, 119, 108094–108099 CrossRef CAS.
- J. Liu, Y. Zhao, X. Li, J. Wu, Y. Han, X. Zhang and Y. Xu, Cryst. Growth Des., 2019, 20, 454–459 CrossRef.
- L. N. Sun, J. Yu, H. Peng, J. Z. Zhang, L. Y. Shi and O. S. Wolfbeis, J. Phys. Chem. C, 2010, 114, 12642–12648 CrossRef CAS.
- A. G. Joly, W. Chen, J. Roark and J. Z. Zhang, J. Nanosci. Nanotechnol., 2001, 1, 295–301 CrossRef CAS PubMed.
- M. Engeser, L. Fabbrizzi, M. Licchelli and D. Sacchi, Chem. Commun., 1999, 18, 1191–1192 RSC.
- J. Xie, K. Yan, H. Zhu, G. Li, H. Wang, H. Zhu, P. Hang, S. Zhao, W. Guo, D. Ye, L. Shao, X. Guan, T. Ngai, X. Yu and J. Xu, Sci. Bull., 2020, 65, 1726–1734 CrossRef CAS.
- Y. Wang, Y. Zhu, J. Huang, J. Cai, J. Zhu, X. Yang, J. Shen, H. Jiang and C. Li, J. Phys. Chem. Lett., 2016, 7, 4253–4258 CrossRef CAS PubMed.
- M. Cardoso Dos Santos, W. R. Algar, I. L. Medintz and N. Hildebrandt, TrAC, Trends Anal. Chem., 2020, 125, 115819 CrossRef CAS.
Footnote |
| † Electronic supplementary information (ESI) available: For ESI data, see https://doi.org/10.1039/d2ra03084e |
| This journal is © The Royal Society of Chemistry 2022 |

