 Open Access Article
Innovative localized surface plasmon resonance sensing technique for a green spectrofluorimetric assay of ketoprofen, paracetamol and chlorzoxazone in pharmaceutical preparations and biological fluids†
Nora A. Abdallah *,
Mona E. Fathy,
Manar M. Tolba,
Amina M. El-Brashy and
Fawzia A. Ibrahim
Department of Pharmaceutical Analytical Chemistry, Faculty of Pharmacy, Mansoura University, Mansoura 35516, Egypt. E-mail: noraabdallah91@mans.edu.eg; Fax: +20502363641; Tel: +20502246253
First published on 22nd November 2022
Abstract
A green, quick and sensitive spectrofluorimetric technique was investigated and validated for the assay of three different drugs namely, ketoprofen (KPN), paracetamol (PAR), and chlorzoxazone (CLX). The method is based on fluorescence quenching of the fluorescence probe, silver nanoparticles (SNPs). The fluorescence quenching of SNPs may be attributed to the complexation between each of the studied drugs with SNPs. The fluorescence of SNPs alone or after complexation with the studied drugs were measured at 485 nm (λex 242 nm) without the need to extract the formed complex. Chemical reduction was employed for preparing SNPs, where silver nitrate was reduced by sodium borohydride in deionized water without adding organic stabilizer. SNPs were found soluble in water, had high stability and had a narrow emission band. The studied drugs were found to decrease the fluorescence of SNPs significantly through static quenching according to Stern–Volmer equation. Factors affecting the reaction between the drugs and NPs were carefully examined and optimized. Using the optimum conditions, the difference in the fluorescence intensity of SNPs before and after complexation with the studied drugs was in a good linear relationship with the concentration of the studied drugs, where (R2 = 0.9998, 0.9998 and 0.9991) in the ranges of 0.5–5.0, 0.15–3.0 and 0.5–9.0 μg mL−1 for KPN, PAR and CLX, respectively. Validity of the proposed method was investigated according to ICH recommendations. The proposed technique was also employed for the analysis of each of the three drugs in commercial or laboratory prepared tablets and in spiked human plasma with very good recoveries as well as high level of accuracy and precision. This method was intended to the analysis of the proposed drugs in their single formulation and single drug administration. The suggested technique is considered an eco-friendly method, as it uses water as the safest and least expensive solvent. Moreover, the recommended technique does not involve solvent extraction of the formed complexes. Greenness assessment of the suggested procedure was accomplished by applying the four standard assessment tools. Consequently, the recommended method can be used in the routine quality control analysis of the cited drugs with minimum harmful effect on the environment as well as the individuals.
1. Introduction
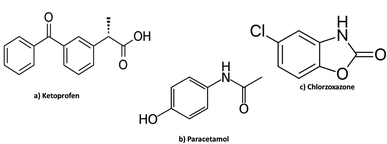
Ketoprofen (KPN), Fig. 1a, is a derivative of propionic acid and one of the non-steroidal anti-inflammatory drugs (NSAIDs). It is used in musculoskeletal joint disorders, dental pain and in peri-articular disorders. It is also used in menstrual cramps, post-operative pain and as anti-pyretic agent.1 It is official in the United States Pharmacopeia (USP),2 British Pharmacopeia (BP)3 and Japanese Pharmacopeia (JP)4 and assayed by acid–base titration in both USP and JP while in BP by RP-HPLC (reversed phase high performance liquid chromatography).Different methods were published for the determination of KPN including ion pair chromatography,5 derivative IR (infra-red) spectroscopy,6 HPLC,7 electrochemical method,8 chromatography tandem mass spectrometry9,10 and terbium sensitized luminescence method.11 However, most of these methods have some limitations, such as complicated pre-treatment, wasting of time and possible pollution of the environment. Compared to these methods, the proposed fluorescence determination of KPN is either more sensitive, simpler, faster or safer.
Recently, several research papers about fluorescence determination of KPN have been published. These reported methods include: (a) a near infrared fluorescence imprinted sensor based on polyethyleneimine passivated copper-doped CdS quantum dots and zinc oxide nanorods,12 (b) hybrid nano assemblies using different ligands that were synthesized using various thiourea derivatives13 (c) a mercaptopropionic acid-capped CdTe quantum dots,14 and (d) carbon dot core and molecularly imprinted polymer shell as sensor.15 The suggested method has the advantages of being simpler and greener than the methods cited above ref. 12–15.
Paracetamol (PAR); Fig. 1b, is a para-aminophenol derivative which has analgesic, antipyretic effect and weak anti-inflammatory activity. Paracetamol is administered for relieving mild and moderate pain and as antipyretic for short-term treatment. Usually, PAR is the chosen analgesic or antipyretic, mainly in the old patients in addition to patients who cannot take salicylates or other NSAIDs such as asthmatic patients, patients who are previously diagnosed with peptic ulcer and children. It is also the first choice of painkiller for pregnant or breastfeeding women. It is official in the USP,2 BP3 and JP4 and it was assayed by RP HPLC in both USP and BP and via spectrophotometry in JP.
Different methods including spectroscopic,16–21 chromatographic22,23 and electrochemical24,25 methods were reported for the analysis of PAR.
The reported spectrofluorimetric method16 was based on measuring the fluorescence quenching of quinine sulphate by chloride ions which were produced from oxidation reaction of PAR with potassium chlorate in acidic medium. Other reported spectrofluorimetric method for the determination of paracetamol via oxidation is presented using different oxidizing reagents as sodium hypochlorite,18 cerium(IV)19,20 and N-bromosuccinimide (NBS) to produce a highly fluorescent product.21
Chlorzoxazone (CLX); Fig. 1c, is a skeletal muscle relaxant that act centrally producing sedative properties. It acts primarily by affecting the spinal cord and subcortical areas of the brain that causes inhibition of the muscle spasm. It is considered as an adjunct therapy in relieving the painful muscle spasm coupled with musculoskeletal conditions. Chlorzoxazone is also given with analgesics in compound preparations.1 It is official in USP,2 where it was assayed by spectrophotometry.
Various techniques were stated for CLX analysis including HPLC,26,27 gas chromatography–mass spectrometry,28 spectrophotometry,29 voltammetry,30–32 fluorimetry.33 The reported fluorimetric method33 depends on measuring the native fluorescence of CLX in chloroform at 310 nm after excitation at 286 nm. Using chloroform as solvent decreases the greenness of the reported method.
Recently, the usage of luminescent metal NPs made a revolution in the analysis of drugs either in their raw form or in the pharmaceutical preparations. This is because of what NPs possess of unique and exceptional properties. Nanoparticles means the usage of nanoscale size of metals (1–100 nm).34 SNPs are noble metal nanoparticles that are widely used owing to their astonishing advantages. SNPs are characterized by their elevated chemical and thermal stability, electrical conductivity, catalytic and optical activity,35–38 in addition to surface enhanced Raman scattering for the determination of drugs.39,40 SNPs have been used either in drug delivery or analysis in both pharmaceutical dosage forms and biological fluids. Many drugs were assayed because some of them can cause quenching of SNPs fluorescence. SNPs can also cause fluorescence enhancement of some other drugs.41
In this work, preparation of SNPs was carried out in aqueous solution (deionized water) through chemical reduction of silver nitrate using sodium borohydride as a reducing agent without the addition of organic stabilizers.42,43 The prepared SNPs were used for the development of an accurate, time-saving and reliable technique for the analysis of KPN, PAR and CLX in their pharmaceutical formulations and in biological matrix (spiked human plasma). The proposed method can be used efficiently in quality control of the three drugs.
2. Laboratory investigations
2.1. Materials
All the used reagents were of analytical grade. Authentic samples of KPN, PAR and CLX with certified purities of 99.99, 100.02 and 100.01%, respectively were kindly provided by Pharco Pharmaceutical Co., Alexandria, Eva-Pharma Co., Cairo and Misr pharma Co. Cairo, Egypt, respectively. Silver nitrate with purity of 99.8% and sodium-borohydride with purity of 98% were bought from Sigma-Aldrich (Germany). Pharmaceutical preparations of (Ketofan® ampules, Bi-alcofan® tablets, Ketofan® capsules and Panadol advance® tablets) were bought from a local pharmacy in Egypt. Prepared tablets of CLX, contains 375 mg of CLX and inactive ingredients of lactose, starch, fructose, talc and glucose, were used because of the unavailability of a pharmaceutical preparation that contain CLX alone in the Egyptian market. Human plasma samples were provided by Mansoura University Hospitals (Mansoura, Egypt) and kept frozen until use after gentle thawing at room temperature. The analysis of spiked human plasma was performed after the approval of the ethical committee of the Faculty of Pharmacy, Mansoura University under code number 2022-186. Water used throughout the experiments was deionized (DI). Lactose and starch were brought from laboratory chemicals company, Cairo, Egypt, while fructose, talc and glucose were brought from El Nasr Pharmaceutical Chemicals Company, Cairo, Egypt.2.2. Apparatus
- Cary Eclipse fluorescence spectrometer was employed for all the spectrofluorimetric measurements. The device was equipped with Xenon flash lamp. Smoothing factor of 19 was applied during the method, the voltage was adjusted at 650 V.- pH-meter: consort, P-901, Belgium.
- Magnetic stirrer: product of Daihan Scientific Co, limited, S. Korea.
- Spectrophotometer: UV/vis. Shimadzu double-beam 1601 (Kyoto, Japan).
- Transmission electron microscope (TEM), JEOL, JSM -2100 (Tokyo, Japan). Sample was loaded on 200 carbon coated mesh and examined at 200 KV.
- Vortex mixer (IVM-300P, Taiwan).
- Centrifuge (2-16P, SIGMA, Germany).
2.3. Preparation of standard solutions
Standard solutions of KPN, PAR or CLX (200.0 μg mL−1) were prepared by dissolving 10.0 mg of each raw powder separately in 50 mL of ethanol. The stock solutions were diluted using the same solvent to get the suitable working solutions as required.2.4. SNPs preparation
Colloidal aqueous solution of SNPs was prepared through chemical reduction of silver nitrate using sodium borohydride.42,43 10 mL of a precursor 1 × 10⁻² M AgNO3 were added drop by drop to 60 mL of the fresh, ice-cold 2 × 10⁻² M NaBH4 solution, in an ice bath, in a ratio of 1![[thin space (1/6-em)]](https://www.rsc.org/images/entities/char_2009.gif) :
:![[thin space (1/6-em)]](https://www.rsc.org/images/entities/char_2009.gif) 6, respectively in conjunction with vigorous and continuous stirring using magnetic stirrer until yellow solution was obtained. Stirring was stopped just after the completion of addition of silver nitrate solution (not more than 2 min). The color of SNPs was brownish-dark-yellow. The prepared NPs were aged for 24 h in cool and dark place, in amber bottle in refrigerator, before the first usage. They were mono-dispersible and stable at five degrees Celsius for 3 weeks. The prepared SNPs were used as the fluorimetric probe for the analysis of the three studied drugs.
6, respectively in conjunction with vigorous and continuous stirring using magnetic stirrer until yellow solution was obtained. Stirring was stopped just after the completion of addition of silver nitrate solution (not more than 2 min). The color of SNPs was brownish-dark-yellow. The prepared NPs were aged for 24 h in cool and dark place, in amber bottle in refrigerator, before the first usage. They were mono-dispersible and stable at five degrees Celsius for 3 weeks. The prepared SNPs were used as the fluorimetric probe for the analysis of the three studied drugs.
2.5. General procedures
| Drug | Linear rangea | Slope | Intercept | r | % Found ±S.D.b | LOD, μg mL−1 | LOQ, μg mL−1 |
|---|---|---|---|---|---|---|---|
| a The concentration in μg mL−1.b Average of three determinations. | |||||||
| KPN | 0.5–5.0 | 24.815 | 97.111 | 0.9995 | 99.98 ± 0.678 | 0.127 | 0.386 |
| PAR | 0.15–3.0 | 82.899 | 109.137 | 0.9998 | 100.02 ± 0.885 | 0.045 | 0.136 |
| CLX | 0.5–9.0 | 24.732 | 139.870 | 0.9997 | 99.95 ± 0.844 | 0.164 | 0.497 |
For tablets and capsules: ten Bi-alcofan® tablets (150 mg), ten Ketofan® capsules (50 mg) or ten Panadol advance® tablets (500 mg) were finely grounded and mixed well. Accurately measured amount of each powder was transferred into 100 mL measuring flask. 60 mL ethanol were added to each flask followed by sonication for 30 min, then ethanol was added to reach the flask mark. After filtration was carried out to remove insoluble excipients, sequential concentrations were prepared as required to achieve the working ranges of KPN or PAR as shown in Table 1. Finally, the previously explained method in “2.5.1” was followed.
For the prepared CLX tablets: 325 mg of the CLX were mixed with 20 mg of talc powder and 15 mg of maize starch, lactose, glucose and fructose to form one tablet. An accurately weighed amount of the prepared tablet equivalent to 10 mg of CLX was dissolved in 60 mL of ethanol in 100 mL volumetric flask. The volumetric flask and its contents were subjected to sonication for 30 min and completed to the required volume with ethanol, then subjected to filtration. Different concentrations inside the working range of CLX were prepared and the previously explained method in “2.5.1” was followed. The content of each dosage form was calculated using the corresponding regression equation.
3. Results and discussion
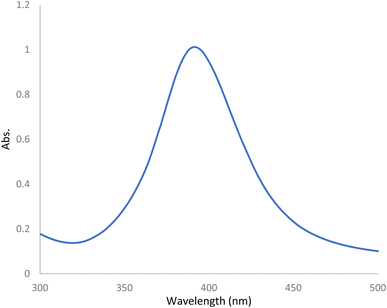
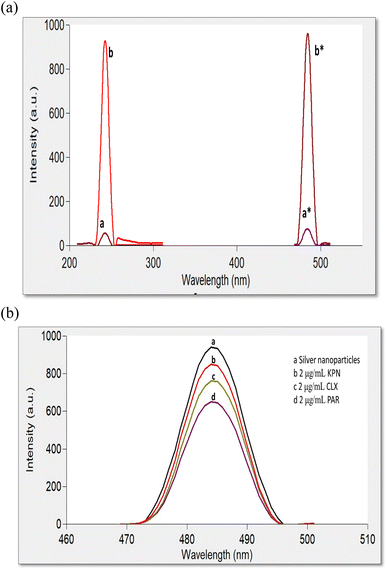
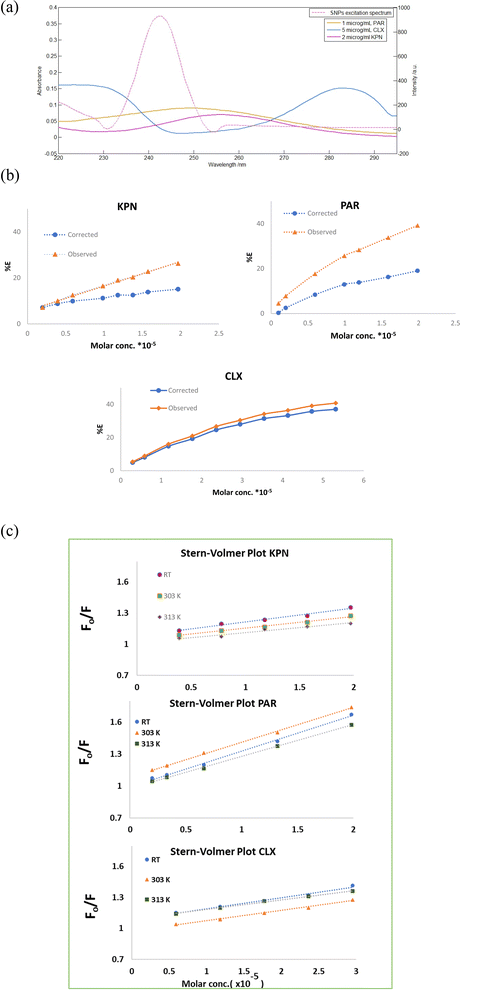
Preparation of SNPs were carried out through the reduction of AgNO3 as a precursor by sodium borohydride as a reducing agent without using organic stabilizers, as mentioned in previously reported methods.42,43 The prepared NPs were aged for 24 h in the refrigerator before the first usage and stored in the dark to avoid the daylight effect. They were found to have maximum UV absorption at 400 nm (Fig. 2) and strong fluorescence at 485 nm after excitation at 242 nm (Fig. 3a). Ethanolic solutions of KPN or PAR exhibit no native fluorescence, while an ethanolic solution of CLX exhibits native fluorescence at 280/309 nm, as demonstrated in Fig. S1.† The addition of these drugs to SNPs was found to cause quenching of the emission band of the SNPs (Fig. 3b) due to the formation of non-fluorescent complexes.3.1. UV spectral characteristics and transmission electron microscope images
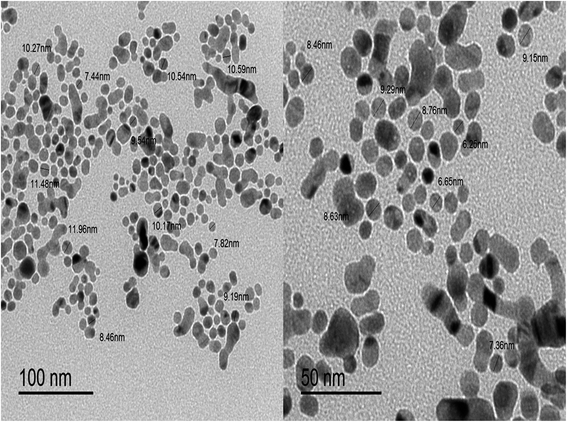
The UV spectrum of the prepared SNPs was recorded and the obtained spectrum was found to have a narrow absorption peak near 400 nm (Fig. 2) which is a characteristic of SNPs. The presence of a narrow absorption peak proves the SNPs mono-dispersity.44,45TEM image was also used to know the size and the dispersity of the prepared colloidal SNPs solution. Fig. 4 shows TEM image of SNPs which were found to be spherical in shape, dark colored and monodispersed along with nanoscale average size of 8–9 nm. It was found that the prepared NPs were smaller than NPs prepared by Darya et al.42 and Alothman et al.43 which had an average size of 23 and 18 nm, respectively.
3.2. Optimization of experimental conditions
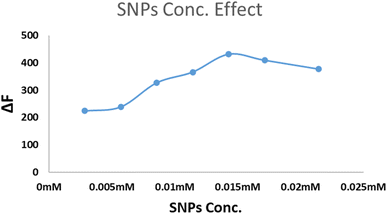
3.3. Spectral properties of SNPs
Fig. 3a shows the emission spectra of SNPs which have strong emission band at 485 nm after excitation at 242 nm. Upon the addition of each of the three studied drugs separately to SNPs, it was noticed that the FL intensity of SNPs emission spectrum was quenched without any shift (Fig. 3b).3.4. Reaction mechanism
 | (1) |
 | (2) |
Plots of % E of the observed and corrected fluorescence of KPN, PAR and CLX versus their molar concentration (Fig. 6b) inferring that the IFE participated in the fluorescence quenching by about 11%, 20% and 5% of the total suppressed efficiency for KPN, PAR and CLX, respectively. In order to further explore the main cause of the quenching mechanisms, Stern–Volmer equation47 was employed at three different temperatures to investigate the quenching reaction mechanism between the SNPs and the quenchers. A Stern–Volmer plot was obtained by plotting (F0/F) as a function of drug concentration (quencher) [Q] at three different temperatures, where; F0 is the emission intensity of SNPs without presence of quencher drug and F is the emission intensities of SNPs in presence of different concentration of quencher drug. The produced graph will have an intercept of about 1.0 and a slope called the Stern–Volmer constant (KSV). Table 2 contains the intercepts and Stern–Volmer constants at three different temperatures. The table shows that the quenching constant KSV decreased upon increasing the temperature, as shown in Fig. 6c, indicating a static quenching.46 So, it was concluded that the quenching mechanism was due to a combination of primary inner filter effect and static quenching.
| Parameter | Stern–Volmer equation (Q, mol) | Correlation coefficient r2 | KSV (L moL−1) |
|---|---|---|---|
| KPN | |||
| Room temperature | F0/F = 1.082 + 1.334 × 10⁴[Q] | 0.9819 | 1.334 × 10⁴ |
| 303 | F0/F = 1.044 + 1.124 × 10⁴[Q] | 0.9901 | 1.124 × 10⁴ |
| 313 | F0/F = 1.016 + 0.968 × 10⁴[Q] | 0.9636 | 0.968 × 10⁴ |
![[thin space (1/6-em)]](https://www.rsc.org/images/entities/char_2009.gif) |
|||
| PAR | |||
| Room temperature | F0/F = 0.994 + 3.36 × 10⁴[Q] | 0.9961 | 3.36 × 10⁴ |
| 303 | F0/F = 1.086 + 3.27 × 10⁴[Q] | 0.9985 | 3.27 × 10⁴ |
| 313 | F0/F = 0.981 + 2.98 × 10⁴[Q] | 0.9989 | 2.98 × 10⁴ |
![[thin space (1/6-em)]](https://www.rsc.org/images/entities/char_2009.gif) |
|||
| CLX | |||
| Room temperature | F0/F = 1.084 + 1.075 × 10⁴[Q] | 0.9881 | 1.075 × 10⁴ |
| 303 | F0/F = 0.989 + 0.994 × 10⁴[Q] | 0.9926 | 0.994 × 10⁴ |
| 313 | F0/F = 1.093 + 0.926 × 10⁴[Q] | 0.995 | 0.926 × 10⁴ |
log((F − F0)/F) = log![[thin space (1/6-em)]](https://www.rsc.org/images/entities/char_2009.gif) k + n k + n![[thin space (1/6-em)]](https://www.rsc.org/images/entities/char_2009.gif) log[D] log[D]
| (3) |
Estimating the number of binding sites (n) between PAR and SNPs was approximately one, as represented by the slope value (0.95). The binding constant (K was 1.92 × 10⁴), as the intercept (log![[thin space (1/6-em)]](https://www.rsc.org/images/entities/char_2009.gif) K) was 4.2845.
K) was 4.2845.
Gibb's free energy (ΔG°) was calculated by utilizing K value through eqn (4):
Gibb's free energy (ΔG°, kJ mol−1) = −RT![[thin space (1/6-em)]](https://www.rsc.org/images/entities/char_2009.gif) ln ln![[thin space (1/6-em)]](https://www.rsc.org/images/entities/char_2009.gif) K = −23.54 kJ mol−1 K = −23.54 kJ mol−1
| (4) |
3.5. Suggested technique validation
The validity of the suggested technique was evaluated according to ICH Q2R1 suggestions.50The two levels precision were applied using the recommended technique to investigate its precision. The results are shown in Table 3 and reveal a very good inter-day and intra-day precision.
| Parameter | % Recovery | % RSD |
|---|---|---|
| Volume of SNPs, (1.0 mL ± 0.02) | ||
| 0.98 | 99.61 ± 1.26 | 1.26 |
| 1.0 | 100.02 ± 0.76 | 0.76 |
| 1.02 | 100.33 ± 1.53 | 1.53 |
![[thin space (1/6-em)]](https://www.rsc.org/images/entities/char_2009.gif) |
||
| Excitation wavelength, (242 nm ± 2) | ||
| 240 | 99.07 ± 1.80 | 1.82 |
| 242 | 100.03 ± 0.58 | 0.58 |
| 244 | 98.53 ± 2.08 | 2.09 |
![[thin space (1/6-em)]](https://www.rsc.org/images/entities/char_2009.gif) 51 were examined adopting the recommended approach. No significant interferences were found from the most common additives on the recovery of the studied drug, as presented in Table 6.
51 were examined adopting the recommended approach. No significant interferences were found from the most common additives on the recovery of the studied drug, as presented in Table 6.
| Dosage forms | Drug conc. | % Found ±S.D. | t test (2.78)a | F test (19.0)a | |
|---|---|---|---|---|---|
| Proposed method | Official methods [2, 3] | ||||
| a The figures between parentheses are the tabulated t and F values at P = 0.05.50 | |||||
| Ketofan® ampoules | 100 mg ketoprofen/2 mL | 99.95 ± 0.805 | 99.69 ± 1.65 | 0.24 | 4.20 |
| Bi-alcofan® tablets | 100 mg ketoprofen/tablet | 100.15 ± 1.98 | 100.26 ± 1.48 | 0.08 | 1.97 |
| Ketofan® capsules | 50 mg ketoprofen/capsule | 100.32 ± 1.88 | 99.73 ± 1.55 | 0.42 | 1.47 |
| Panadol advance® tablets | 500 mg paracetamol/tablet | 99.98 ± 2.17 | 100.17 ± 0.79 | 0.025 | 7.52 |
| CLX prepared tablets | 325 mg chlorzoxazone/tablet | 100.38 ± 1.43 | 100.04 ± 1.66 | 0.23 | 2.23 |
| Additives 20 μg mL−1 | % Recovery |
|---|---|
| Glucose | 100.93 ± 1.82 |
| Fructose | 98.41 ± 1.37 |
| Lactose | 98.48 ± 0.96 |
| Starch | 100.33 ± 1.19 |
| Talc | 99.21 ± 0.69 |
The interference from some commonly co-administrated and/or co-formulated drugs that may be found in human plasma was studied. The tolerance limits of these compounds, namely, phenylephrine hydrochloride, tizanidine, venlafaxine, diacerein, diclofenac sodium, mefenamic acid, aceclofenac and ibuprofen were calculated. The obtained results of the tolerance limits reveal the acceptable selectivity of the proposed method (Table 7).
| Drug | Reason for interference | Drug tolerance limit (μg mL−1) |
|---|---|---|
| Phenylephrine hydrochloride | - It is used to relieve nasal discomfort caused by colds, allergies, and hay fever | 173 for KPN 234 for PAR |
| -Commonly co-administered with PAR or KPN | ||
| Tizanidine | - Muscle relaxant | 112 for KPN 164 for PAR |
| - Commonly co-administered with PAR or KPN | ||
| Venlafaxine | - An antidepressant medication | 89 for KPN 120 for PAR 125 for CLX |
| - Could be administered with any of the studied drugs | ||
| Diacerein | - Used to treat joint diseases such as osteoarthritis | 32 for KPN 40 for PAR 48 for CLX |
| - Could be administered with any of the studied drugs | ||
| Diclofenac sodium | Analgesic which is commonly prescribed with CLX | 50 for CLX |
| Mefenamic acid | Non-steroidal anti-inflammatory drug which is commonly prescribed with CLX | 7 for CLX |
| Aceclofenac | Non-steroidal anti-inflammatory drug which is commonly prescribed with CLX | 140 for CLX |
| Ibuprofen | Analgesic which is commonly prescribed with CLX | 240 for CLX |
4. Applications
4.1. Pharmaceutical and prepared dosage forms
The recommended technique was applied successfully for determining the studied drugs in commercial dosage forms including capsules, tablets and ampules as well as the prepared tablets of CLX. The results were compared statistically with those of the official methods: BP3 for KPN and USP2 for PAR and CLX using both Student's t-test and variance ratio F-test, as illustrated in Table 5. There was a perfect harmonization between the results of both proposed and official methods, which indicated high levels of accuracy and precision.4.2. Spiked human plasma
The high sensitivity of the suggested technique made it eligible to be employed successfully in determining the studied drugs in spiked human plasma. The mean peak plasma concentrations were found to be 10 mg L−1, 10–20 mg L−1 and 36.3 mg L−1 for KPN, PAR and CLX, respectively.52 The results shown in Table 8 reveals good percentage recoveries, which proved that the developed method could be effectively involved to quantify the three drugs separately in spiked human plasma.| Spiked human plasma | KPN | PAR | CLX | ||||||
|---|---|---|---|---|---|---|---|---|---|
| Conc. taken (μg mL−1) | Conc. found (μg mL−1) | % Recovery | Conc. taken (μg mL−1) | Conc. found (μg mL−1) | % Recovery | Conc. taken (μg mL−1) | Conc. found (μg mL−1) | % Recovery | |
| Spiked human plasma | 1.0 | 0.991 | 99.10 | 0.5 | 0.486 | 97.20 | 2.0 | 1.979 | 98.95 |
| 2.0 | 2.036 | 101.80 | 1.0 | 0.901 | 90.10 | 3.0 | 3.015 | 100.50 | |
| 3.0 | 2.927 | 97.57 | 1.5 | 1.571 | 104.73 | 4.0 | 4.048 | 101.20 | |
| 4.0 | 4.085 | 102.13 | 2.0 | 2.129 | 106.45 | 5.0 | 4.939 | 98.78 | |
| 5.0 | 4.964 | 99.28 | 3.0 | 2.914 | 97.13 | 6.0 | 6.018 | 100.30 | |
| Mean | 99.78 | 99.12 | 99.95 | ||||||
| ±S.D. | 1.94 | 6.59 | 1.04 | ||||||
4.3. Greenness assessment
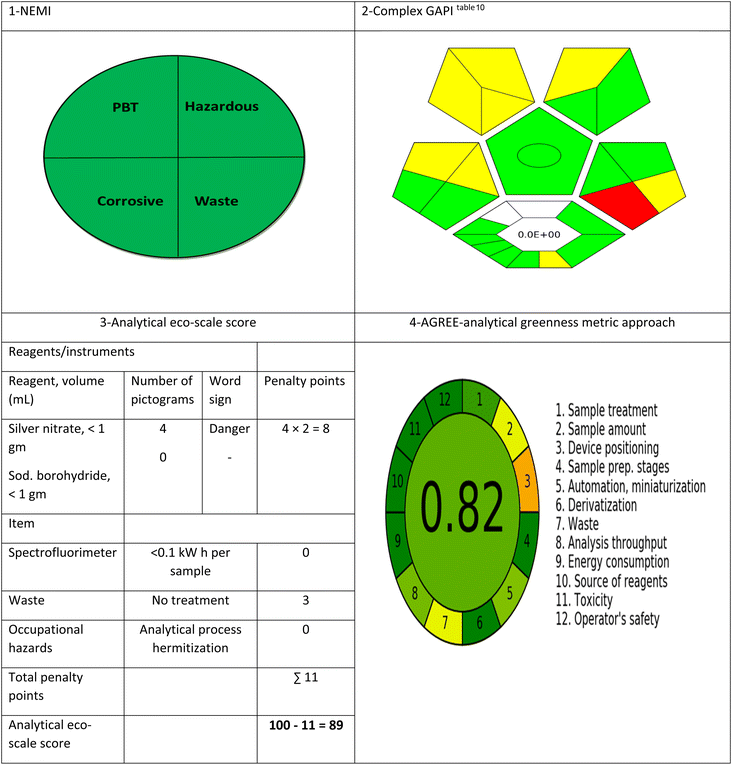
The suggested technique has been evaluated regarding its greenness using the four main assessment tools. First, National Environmental Methods Index (NEMI)53 was applied on the proposed method. The proposed approach fulfilled the four criteria of the greenness profile, as the solvents used during the analysis (water and ethanol) are not classified as either PBT or hazardous by the EPA's Toxic Release Inventory.54,55 The pH of the diluting solvent (water) is 6.5 which is not corrosive and the waste generation is less than 50 g per sample.The second applied tool is green analytical procedure index (GAPI)56 which is a good semi-quantitative tool for laboratory practice, as it gives information on the whole process including 15 parameters, beginning with sampling until the final determination. Complexed GAPI was presented by Justyna Płotka-Wasylka and Wojciech Wojnowski who provided a very helpful software to automatically generate the complexed GAPI figure depending on the inputs of each method.57 Complex GAPI pictogram for the proposed method is presented in Tables 9 and 10, which ensures its greenness. Third, analytical eco-scale58 was applied to the suggested technique, as shown in Table 9 with a score of 89 which referred to an excellent green methodology (the closer the score to 100, the greener the method). Finally, AGREE-analytical greenness metric software (AGREE),59 created by Francisco Pena-Pereira et al., was applied for assessing the suggested technique. It depends on assessing twelve parameters of green analytical aspects. Those parameters were colored with colors ranging from dark green to orange, as represented in Table 9. The resulted score was 0.82 indicating the greenness of the method, as the closer the score to 1.0, the greener the method.
| Categorya | Description |
|---|---|
| a The numbers between parentheses are the numbers in the GAPI pictogram (on the right).b The circle inside the central pentagram represent the quantification property of the method. | |
| Sample preparation | |
| Collection (1) | Off-line |
| Preservation (2) | None |
| Transport (3) | None |
| Storage (4) | Normal condition |
| Type of method: direct or indirect (5) | Direct |
| Scale of extraction (6) | Micro-extraction |
| Solvents/reagents used (7) | Green solvents/reagents used |
| Additional treatments (8) | Simple treatments (clean up, solvent removal, etc.) |
![[thin space (1/6-em)]](https://www.rsc.org/images/entities/char_2009.gif) |
|
| Reagent and solvents | |
| Amount (9) | <10 mL |
| Health hazard (10) | AgNO3 = 3 Sod. borohydride = 3 |
| Safety hazard (11) | AgNO3 = 0 Sod. borohydride = 1 |
![[thin space (1/6-em)]](https://www.rsc.org/images/entities/char_2009.gif) |
|
| Instrumentation | |
| Energy (12) | ≤1.0 kW h per sample |
| Occupational hazard (13) | Hermetic sealing of the analytical process |
| Waste (14) | 1–10 mL |
| Waste treatment (15) | No treatment |
| Quantificationb | Yes |
5. Conclusion
This suggested method discussed the possibility of using simply prepared SNPs as fluorimetric probe for the analysis of three drugs (KPN, PAR and CLX) by FL quenching technique. The suggested technique is characterized by being green, straightforward, fast and sensitive. It is neither time-consuming nor requires any sophisticated pretreatment. The suggested method is also considered environmentally friendly, as water – which is the greenest solvent – is the main solvent used during the analysis while volatile solvents are excluded. To ensure the greenness of the suggested method, four assessment tools were used. Furthermore, the suggested technique was validated and applied to determine the studied drugs in pharmaceutical dosage forms, prepared tablets and human plasma. This method was intended to the analysis of the proposed drugs in their single formulation and single drug administration. From economic and environmental point of view, this technique was found to have a great potential for the analysis of the studied drugs separately either in pharmaceutical dosage forms or spiked human plasma with high levels of accuracy and precision.Ethical statement
This article does not include any studies on human participants or animals carried out by any of the authors.Conflicts of interest
The authors declare that they have no conflict of interest.References
- A. Brayfield, Martindale : the complete drug reference, Pharmaceutical Press, London, 2017 Search PubMed.
- The United States Pharmacopeia, (USP 40), The National Formulary (NF 35), Online version., [01.06.2022], available from, 2017, https://www.uspnf.com Search PubMed.
- The British Pharmacopoeia, Electronic version [CD-ROM], 2013 Search PubMed.
- The Japanese Pharmacopoeia (17th edition), Ministry of Health, Labour and Welfare, 2016 Search PubMed.
- N. Muhammad, W. Li, Q. Subhani, F. Wang, Y. G. Zhao and Y. Zhu, New J. Chem., 2017, 41(17), 9321–9329 RSC.
- A. M. Azeez and N. A. Fakhre, Egypt. J. Chem., 2021, 65(1), 1–2 Search PubMed.
- X. Zheng, Y. Zhou and P. Liu, Zhongguo Yaofang, 2017, 28(18), 2579–2581 Search PubMed.
- Z. Cebula, P. Niedziałkowski and T. Ossowski, J. Appl. Biosci., 2018, 1(3), 7–8 Search PubMed.
- T. H. Eichhold, R. E. Bailey, S. L. Tanguay and S. H. Hoke, J. Mass Spectrom., 2000, 35(4), 504–511 CrossRef CAS.
- A. Azzouz, B. Jurado-Sánchez, B. Souhail and E. Ballesteros, J. Agric. Food Chem., 2011, 59(9), 5125–5132 CrossRef CAS PubMed.
- S. M. Al-Kindy, Z. Al-Harasi, F. E. O. Suliman, A. Al-Hamadi and A. Pillay, Terbium sensitized luminescence for the determination of ketoprofen in pharmaceutical formulations, J. Fluoresc., 2009, 19(2), 249–255 CrossRef CAS PubMed.
- S. Chen, S. Zhou, J. Fu, S. Tang, X. Wu, P. Zhao and Z. Zhang, Anal. Methods, 2021, 13(25), 2836–2846 RSC.
- A. Saini, M. Kaur, A. Kuwar, N. Kaur and N. Singh, Mol. Syst. Des. Eng., 2020, 5(8), 1428–1436 RSC.
- L. Molina-García, J. L. Santos, A. Ruiz-Medina and E. J. Llorent-Martínez, J. Food Drug Anal., 2013, 21(4), 426–431 CrossRef.
- S. Bhogal, K. Kaur, S. Maheshwari and A. K. Malik, J. Fluoresc., 2019, 29(1), 145–154 CrossRef CAS PubMed.
- G. W. Perera, M. D. de Costa and K. R Mahanama, J. Photochem. Photobiol., A, 2019, 368, 248–253 CrossRef CAS.
- J. Zhang and X. S. Zhang, Guang Pu Xue Yu Guang Pu Fen Xi, 2002, 22(4), 665–666 CAS.
- J. L. Vilchez, R. Blanc, R. Avidad and A. Navalón, J. Pharm. Biomed. Anal., 1995, 13(9), 1119–1125, DOI:10.1016/0731-7085(95)01537-u.
- T. Hossein and H. Yahya, Asian J. Biochem. Pharm. Res., 2011, 2(1), 684–689 Search PubMed.
- A. M. Jamaluddin, Pak. J. Anal. Environ. Chem., 2019, 20(1), 17–31 CrossRef.
- H. M. Abdel-Wadood, N. A. Mohamed and F. A. Mohamed, J. AOAC Int., 2005, 88(6), 1626–1630 CrossRef CAS PubMed.
- N. S. Abdelwahab, M. M. Abdelrahman, J. M. Boshra and A. A. Taha, Biomed. Chromatogr., 2019, 33(9), 4598 CrossRef PubMed.
- M. A. Mohamed, J. AOAC Int., 2022, 105(3), 703–716 CrossRef PubMed.
- S. Gürsoy and F. Kuralay, Colloids Surf., A, 2022, 633, 127846 CrossRef.
- J. Sripirom, W. C. Sim, P. Khunkaewla, W. Suginta and A. Schulte, Anal. Chem., 2018, 90(17), 10105–10110 CrossRef CAS PubMed.
- K. Rajnarayana, S. R. Mada, J. Vidyasagar, P. Kishore and D. R. Krishna, Pharmazie, 2002, 57(12), 811–813 CAS.
- J. K. Mbinze, P. Lebrun, B. Debrus, A. Dispas, N. Kalenda, J. M. Mbay, T. Schofield, B. Boulanger, E. Rozet, P. Hubert and R. D. Marini, J. Chromatogr. A, 2012, 1263, 113–124 CrossRef CAS PubMed.
- C. B. Eap, C. Schnyder and L. Savary, J. Chromatogr. B: Biomed. Sci. Appl., 1998, 705(1), 139–144 CrossRef CAS.
- C. S. Sastry, R. Chintalapati, B. S. Sastry and C. S. Lakshmi, Anal. Lett., 2000, 33(12), 2501–2513 CrossRef CAS.
- S. I. Zayed and Y. M. Issa, Acta Chim. Slov., 2020, 67(4), 1053–1060 CrossRef CAS PubMed.
- J. C. Abbar and S. T. Nandibewoor, Ind. Eng. Chem. Res., 2012, 51(1), 111–118 CrossRef CAS.
- J. Abbar and S. Nandibewoor, Crit. Rev. Anal. Chem., 2012, 42(3), 272–281 CrossRef CAS.
- J. T. Stewart and C. W. Chan, J. Pharm. Sci., 1979, 68(7), 910–912 CrossRef CAS PubMed.
- F. K. Alanazi, A. A. Radwan and I. A. Alsarra, Saudi Pharm. J., 2010, 18(4), 179–193 CrossRef CAS PubMed.
- Y. Shiraishi and N. Toshima, J. Mol. Catal. A: Chem., 1999, 141(1–3), 187–192 CrossRef CAS.
- H. Tada, K. Teranishi, Y. I. Inubushi and S. Ito, Langmuir, 2000, 16(7), 3304–3309 CrossRef CAS.
- A. Sclafani, M. N. Mozzanega and P. PichatJ, Photochem. Photobiol., 1991, 59(2), 181–189 CrossRef CAS.
- K. Alaqad and T. A. Saleh, J. Environ. Anal. Toxicol, 2016, 6(4), 525–2161 Search PubMed.
- N. Shirtcliffe, U. Nickel and S. Schneider, J. Colloid Interface Sci., 1999, 211(1), 122–129 CrossRef CAS PubMed.
- R. M. Bright, M. D. Musick and M. J. Natan, Langmuir, 1998, 14(20), 5695–5701 CrossRef CAS.
- A. Jouyban and E. Rahimpour, Talanta, 2020, 217, 121071 CrossRef CAS PubMed.
- D. Radziuk, D. G. Shchukin, A. Skirtach, H. Möhwald and G. Sukhorukov, Langmuir, 2007, 23(8), 4612–4617 CrossRef CAS PubMed.
- Z. A. Alothman, N. Bukhari, S. Haider, S. M. Wabaidur and A. A. Alwarthan, Arabian J. Chem., 2010, 3(4), 251–255 CrossRef CAS.
- M. D. Malinsky, K. L. Kelly, G. C. Schatz and R. P. Van Duyne, J. Am. Chem. Soc., 2001, 123(7), 1471–1482 CrossRef CAS.
- J. C. Riboh, A. J. Haes, A. D. McFarland, C. Ranjit Yonzon and R. P. Van Duyne, J. Phys. Chem. B, 2003, 107(8), 1772–1780 CrossRef CAS.
- J. R. Lakowicz, Principles of fluorescence spectroscopy, Springer US, Boston, MA, 2006 Search PubMed.
- J. Xu and Z. Wang, Fluorimetric Analysis Method, Science Press, Beijing, 3rd edn, 2006 Search PubMed.
- S. Bi, L. Ding, Y. Tian, D. Song, X. Zhou, X. Liu and H. Zhang, J. Mol. Struct., 2004, 703(1–3), 37–45 CrossRef CAS.
- F. Paul, T. Klaus, L. Richard, F. Stephen and R. William, Chemistry 2e, Rice University, 2019, OpenStax Search PubMed.
- ICH Harmonised Tripartite Guidelines, Validation of analytical procedures: text and methodology Q2 (R1), https://www.ich.org/products/guidelines/quality/article/quality-guidelines.html, accessed, March, 2022 Search PubMed.
- S. M. Derayeaa, M. A. Omara, M. A. Hammada and Y. F. Hassanb, J. Appl. Pharm. Sci., 2017, 7(2), 016–024 Search PubMed.
- A. C. Moffat , M. D. Osselton , B. Widdop and J. Watts, Clarke's Analysis of Drugs and Poisons, Pharmaceutical Press, London, fourth edn, 2011 Search PubMed.
- L. H. Keith, L. U. Gron and J. L. Young, Chem. Rev., 2007, 107(6), 2695–2708 CrossRef CAS PubMed.
- M. de La Guardia and J. Ruzicka, Analyst, 1995, 120(2), 17N RSC.
- M. de La Guardia, K. D. Khalaf, V. Carbonell and A. Morales-Rubio, Anal. Chim. Acta, 1995, 308(1–3), 462–468 CrossRef CAS.
- J. Płotka-Wasylka, Talanta, 2018, 181, 204–209 CrossRef PubMed.
- F. Pena-Pereira, W. Wojnowski and M. Tobiszewski, Anal. Chem., 2020, 92(14), 10076–10082 CrossRef CAS PubMed.
- A. Gałuszka, Z. M. Migaszewski, P. Konieczka and J. Namieśnik, TrAC, Trends Anal. Chem., 2012, 37, 61–72 CrossRef.
- J. N. Miller and J. C. Miller, Statistics and Chemometrics for Analytical Chemistry, Prentic Hall, Hariow, England, fifth edn, 2005 Search PubMed.
Footnote |
| † Electronic supplementary information (ESI) available. See DOI: https://doi.org/10.1039/d2ra04725j |
| This journal is © The Royal Society of Chemistry 2022 |

