
 Open Access Article
 This Open Access Article is licensed under a Creative Commons Attribution-Non Commercial 3.0 Unported Licence
Au@bovine serum albumin nanoparticle-based acid-resistant nanozyme quartz crystal microbalance sensing of urine glucose†
Dengfeng Zhou ab,
Wenyao Songab,
Shuangbin Zhangab,
Lan Chen*a and
Guanglu Ge*a
ab,
Wenyao Songab,
Shuangbin Zhangab,
Lan Chen*a and
Guanglu Ge*a
aCAS Key Laboratory of Standardization and Measurement for Nanotechnology, CAS Center for Excellence in Nanoscience, National Center for Nanoscience and Technology, No. 11 Zhongguancun Beiyitiao, Beijing 100190, PR China. E-mail: chenlan@nanoctr.cn; gegl@nanoctr.cn
bUniversity of Chinese Academy of Sciences, Beijing 100049, PR China
First published on 17th October 2022
Abstract
A robust, efficient and sensitive quartz crystal microbalance (QCM) for glucose detection has been constructed using Au@bovine serum albumin (Au@BSA) nanoparticles as an active layer. The nanoparticles serve as tandem nanozymes and their stability over natural enzymes enable the sensor to show a wider linear dynamic range between 0.05 and 15 mM, a higher acid-resistance (pH 2.0–8.0) and heat-resistance (35–60 °C) than conventional glucose oxidase (GOx)-based sensors. The sensor has been further applied to measure glucose content in artificial urine directly without dilution, where the recovery of 99.6–105.2% and the relative standard deviations (RSDs) below 0.88% confirm a good reproducibility for the measurement results. In addition, the developed Au@BSA QCM sensor can retain 95% of its initial activity after 40 days of storage. Overall, the Au@BSA sensor shows better comprehensive performance than the commercial sensor strips for urine glucose analysis and provides a promising approach in a more precise and robust manner.
Introduction
As the main energy source and metabolic intermediate in mammal bodies, glucose is an important carbohydrate molecule,1–3 where its concentration is usually maintained between 3 and 8 mM. But high levels of glucose in the body may lead to diseases such as diabetes.4 Currently, diagnosis technology developments allow people to monitor their blood glucose levels in real time at home using convenient test kits, e.g. glucose test strips,5 however, this method is not suitable for frequent collecting and monitoring blood glucose samples.6,7 In some cases, high blood glucose levels doesn't mean high glucose levels as found in renal diabetes,8 where misdiagnosis may occur if only relying on the blood glucose measurement. Therefore, developing more direct urine glucose measurement technology is highly desirable, which is convenient for non-invasive urine glucose sampling and monitoring.9In terms of sensing techniques, more and more enzyme-based electrochemical sensors have been developed and commercialized in recent years for glucose detection. This provided high sensitivity and facile manufacturing for the sensors, more sophisticated design such as the combination of two natural enzymes have been utilized.10 This sensor device may suffer from test unresponsiveness, and large measurement deviations and multiple calibrations for the long-term use.11 In addition, immobilizing the enzyme can lead to the deterioration of its long-term stability for glucose detection. It is well known that the activity of nature enzymes can be greatly inhibited under harsh conditions such as strong acidic solution, organic solvents and high operation temperatures, say nothing about the time-consuming and expensive preparation and purification of these enzymes. Therefore, it is desirable to develop a more facile, robust and non-enzymatic glucose biosensor to target the above problems.
In 2007, Gao et al.12 found that the Fe3O4 nanomaterial have peroxidase-like properties and from then on, more and more nanoparticles with enzymatic activities (so-called nanozymes) have been discovered. Nanozymes usually have only a single catalytic effect under certain conditions and, therefore, multiple nanozymes can be used to reach a combination effect, if interference or inactivation of the two nanozymes can be avoided.13,14 Li et al.15 found that Au@BSA NPs can simultaneously exhibit both GOx and horseradish peroxidase (HRP) dual-enzyme activities at broad pH range, to achieve rapid, enzyme-free, and one-step glucose detection. In addition, sandwich-type photoelectrochemical immunosensor has also been developed by making use of the precipitation amplification effect caused by the tandem catalytic of Au@BSA NPs,16 thereby greatly improves its detection sensitivity as the immunosensor. At present, enzyme-based glucose determination mainly relies on UV spectrophotometry and electrochemical methods,17–19 which is easy to be interfered by the purity and color of the sample or the external environment to cause measurement errors and signal drift, particular in higher glucose concentration. Therefore, a new technology, quartz crystal microbalances has been gradually developed to monitor reactions in real time in a label-free and convenient manner.20 QCM has been reported to be good for high concentration measurement but limitedly used for macromolecule detection like protein due to its low response sensitivity and it is, therefore, necessary to improve its detection sensitivity to amplify the response signal.21 Petr Skládal et al.22 have developed a multi-step modification method using two natural enzymes on QCM sensor, a sensitive electrochemical and QCM biosensor based on biocatalytic precipitation, for one-step successful detection of glucose. However, the sensor is limited to use due to the high complexity on the fabrication procedure. Therefore, it is necessary to optimize the preparation scheme in a more facile manner, e.g. one-step fabricating nanomaterials-based tandem enzyme on substrates for fast and easy detection of glucose in urine.
In this work, we combine QCM detection and Au@BSA NP nanozyme to explore new approach for real-time detection of glucose in weak acid and neutral urine,23 where nanozymes accelerate both the oxidization of glucose to H2O2 and the subsequent conversion from soluble 4-CN to the insoluble 4-CD, which is accumulated on the surface of the QCM sensor for signal amplification. Through this strategy, the linear dynamic detection range for glucose can be widened to 0.05–15 mM. In addition, the ex situ detection should be carried out under harsher conditions e.g. in a more acidic solution (urine) or at an elevated temperature. Its detection capability in acidic condition (pH 2.0–8.0) and at high temperature (35 to 60 °C) where our sensor works more efficiently compared with other natural enzyme-based glucose sensors (pH 5.0–8.0 and ∼37 °C). This method is further applied to detect glucose in artificial urine at high concentration. Compared with commercial urine glucose test strips, the method developed here shows better recovery between 98.1% and 105.2% and higher repeatable measurement precision (RSDs) between 0.38% and 0.88% demonstrating its ability to precisely quantify the glucose concentration in urine.
Experimental
Materials
HAuCl4·3H2O, NaBH4, NaCl, KCl, MgCl2, Na2S, sodium oxalate, monosodium citrate and urea were purchased from Shanghai Sinopharm Chemical Reagent Co., Ltd. BSA (66 kDa), TMB and HRP were purchased from Sigma-Aldrich (St. Louis, USA), and GOx was purchased from Macklin. All reagents were of analytical grade and used without further purification. The distilled water was purchased from Wahaha Group (Hangzhou, China). Artificial urine and Phosphate Buffer Solution (PBS) (pH 2.0–11.0) were purchased from Regen Technologies.Characterization
Scanning electron microscopy (Hitachi S4800) and transmission electron microscopy (Tecnai G2 20) were used for morphology analysis. The QCM chips before and after the catalytic oxidation reaction were air dried at room temperature for SEM analysis. A few drops of diluted Au@BSA NPs solution were placed on copper grids coated with carbon film and dried in air at room temperature for TEM analysis. The XRD and XPS spectra of Au@BSA NPs were obtained by Rigaku Ultima IV, Japan and Thermo Scientific K-Alpha, USA, respectively. Fourier transform infrared (FTIR) spectra were used to determine the changes in functional groups of BSA before and after coating using a Thermo Fisher Scientific (Nicolet iS50) spectrometer at the wavenumber range of 650–4000 cm−1. Thermogravimetric analysis (TGA8000) was used to determine the gold content in Au@BSA NPs at 0 to 800 °C with a heating rate of 15 °C min−1 under air flow. UV-vis absorbance was performed on a UV spectrophotometer Cary 60 (Agilent Technologies). Precipitation detection assays were performed using Au@BSA NPs-coated quartz crystal microbalance sensor (Biolin Q-Sense E1, Sweden). Urine glucose test strips (URIT 1VG) were purchased from Guilin Unitech Medical Electronics Co., Ltd.Synthesis of Au@BSA-n NPs
Au@BSA-n nanoparticles were synthesized according to previous literature.25 Specifically, we denote Au@BSA-n nanoparticles as being prepared by mixing 4 mL of BSA ligand at different concentrations (n = 1, 5, 10, 20 μM) with 1% HAuCl4·3H2O (1 mL) and stirred at 600 rpm under dark conditions for 5 min, then 100 μL of NaBH4 (1 mg mL−1) was rapidly added. Finally, the mixture was stirred at room temperature for 30 min and centrifuged to obtain the final product.Fabrication of Au@BSA-n NPs nanozyme on QCM sensor
The scheme for the preparation of the Au@BSA-n NPs and their deposition on QCM sensor is shown in Scheme 1. Firstly, the unmodified QCM electrodes were soaked in piranha solution (30% H2O2![[thin space (1/6-em)]](https://www.rsc.org/images/entities/char_2009.gif) :90% H2SO4, 1:3 v/v) for 10 min and washed with ultra-pure water and ethanol, respectively.
:90% H2SO4, 1:3 v/v) for 10 min and washed with ultra-pure water and ethanol, respectively.
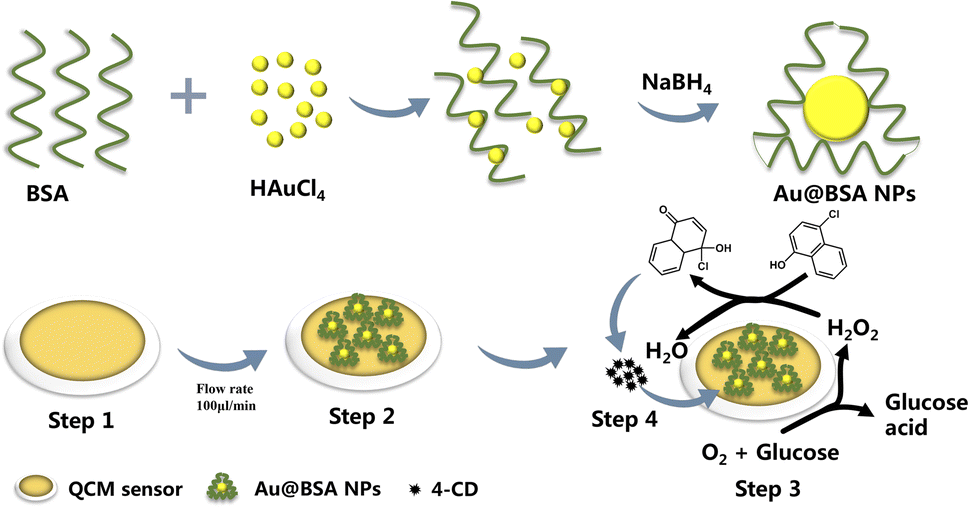 | ||
| Scheme 1 Fabrication process of the QCM-based glucose sensor and the corresponding catalytic conversion of 4-CN to 4-CD. | ||
Then, Au@BSA-n NPs was coated on the surface of QCM electrodes by direct deposition. The sensor was mounted into the QCM chamber after drying by nitrogen purge.
Fabrication of HRP + GOx enzyme on QCM sensor
For comparison, a dual natural enzyme modified sensor was also prepared and the detailed preparation process can be found in the ESI.†Glucose measurement based on QCM sensor
QCM frequency is initially recorded as f0 (f0 is the fundamental frequency of the QCM, ESI†) after the frequency is stabilized in air and then 10 mg mL−1 of Au@BSA-n NPs suspension flows at a rate of 100 μL min−1, resulting in the formation of Au@BSA-n NPs nanozyme on QCM sensor as the frequency is stabilized. And same procedure for the HRP + GOx dual natural enzyme formed on QCM sensor. Different concentration of glucose was introduced into the sensor chamber and incubated for 10 min to ensure sufficient contact with the sensor, where the precipitated product 4-CN, is accumulated on the QCM sensor to gain significant signals even for trace glucose.The sensors were run in PBS buffer with pH 2.0–10.0 at temperature 25–60 °C and storage conditions at pH 7.0 and 4 °C in PBS buffer. 25 mM PBS buffer with different pH was used to adjust the pH value of the catalytic reaction. For the reaction temperature, the variable temperature control system built in QCM was used to control the temperature before and after the reaction.
Results and discussion
Fabrication of QCM sensor for glucose detection
In order to optimize the catalytic activity, the Au@BSA NPs with different size have been prepared from reducing 1% HAuCl4·3H2O by NaBH4 in the presence of different concentration of BSA ligands, e.g., 1, 5, 10, 20 μM. The diameter of the AuNPs obtained from the above preparations is 10, 6, 4 and 2 nm, respectively as seen in Fig. 1(a–d) corresponding to 1, 5, 10 and 20 μM BSA, respectively.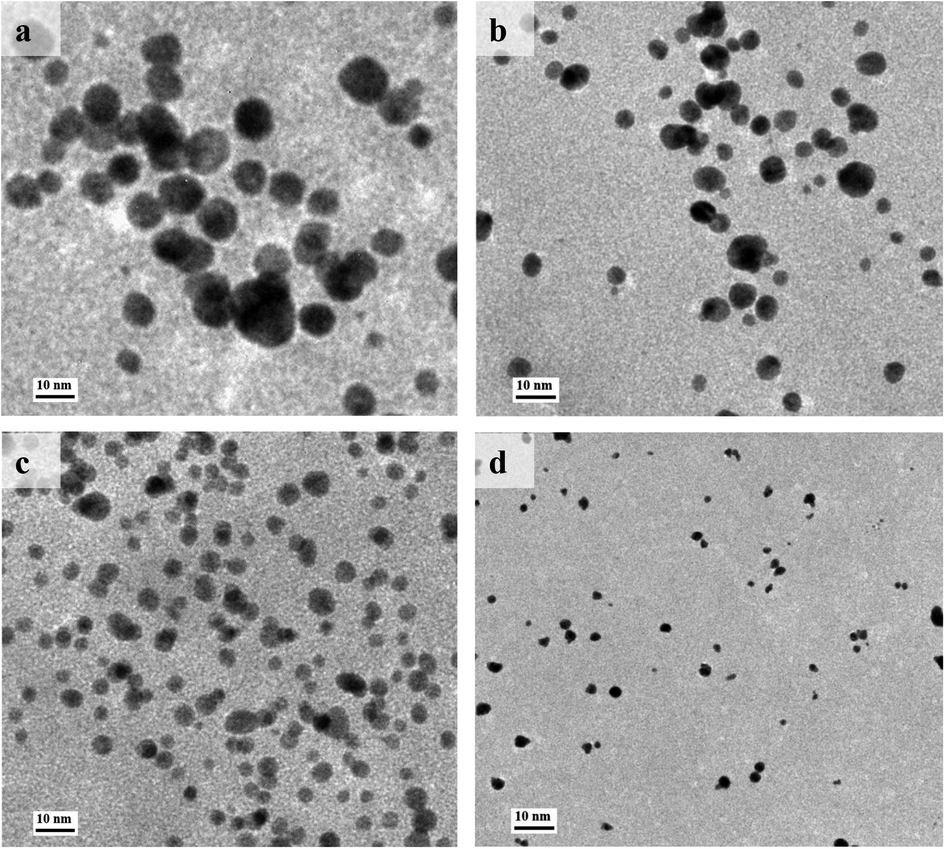 | ||
| Fig. 1 TEM images of Au@BSA NPs synthesized in the presence of (a) 1 μM, (b) 5 μM, (c) 10 μM and (d) 20 μM of BSA. | ||
The reduction of gold ions (AuCl4−) can be determined by UV-vis spectroscopy as shown in Fig. 2(a), where a distinct Au absorption peak appears at 500–600 nm indicating the formation of Au nanoparticles compared with the absorption peak at λ = 280 nm as the evidence for the presence of tyrosine and tryptophan groups in BSA Fig. 2(b).24 Accordingly, the color of the mixed solution changed from colorless to purple. Furthermore, the results of ICP-MS and TGA show that the Au mass fraction is about 24% in Au@BSA-10 NPs. (Fig. S1†). As seen in Fig. 2(c), the stretching vibration peak of the protein corona on Au NPs is basically same as that of the free BSA protein, such as O–H/N–H, C–H and COOH vibrations at 3420, 2955 and 1640 cm−1, respectively.25 The peak set for amide I ranging from 1500 to 1600 cm−1 represents a typical secondary alpha spiral structure of protein. The amide II peak at 1380 cm−1 mainly indicates the bend vibration of the N–H single bond and the stretch vibration of the C–N single bond. The position of amide I shifts from 1530 to 1517 cm−1 while the amide II peak shifts from 1380 to 1389 cm−1, with a significantly lower intensity demonstrates the formation of Au@BSA NPs complexes and the change of its secondary protein structure.26 According to XRD patterns (Fig. 2(d)), BSA alone (in red) presents peak at 2θ = 19.5°.27 In the XRD pattern of Au@BSA the peak of BSA are disappeared respectively and these peaks can be attributed to the formation of a highly crystalline monometallic phase Au (JCPDS 04-0784) on BSA with typical Au diffraction plane of (111), (200), (220) and (311).28 XPS spectra in Fig. 2(e) confirms the presence of C, O, N and Au elements, where the Au4f spectra can be further divided into four peaks at 83.74–87.16 eV and 84.55–88.05 eV, respectively, representing Au (0) and Au(I) as shown in Fig. 2(f).29
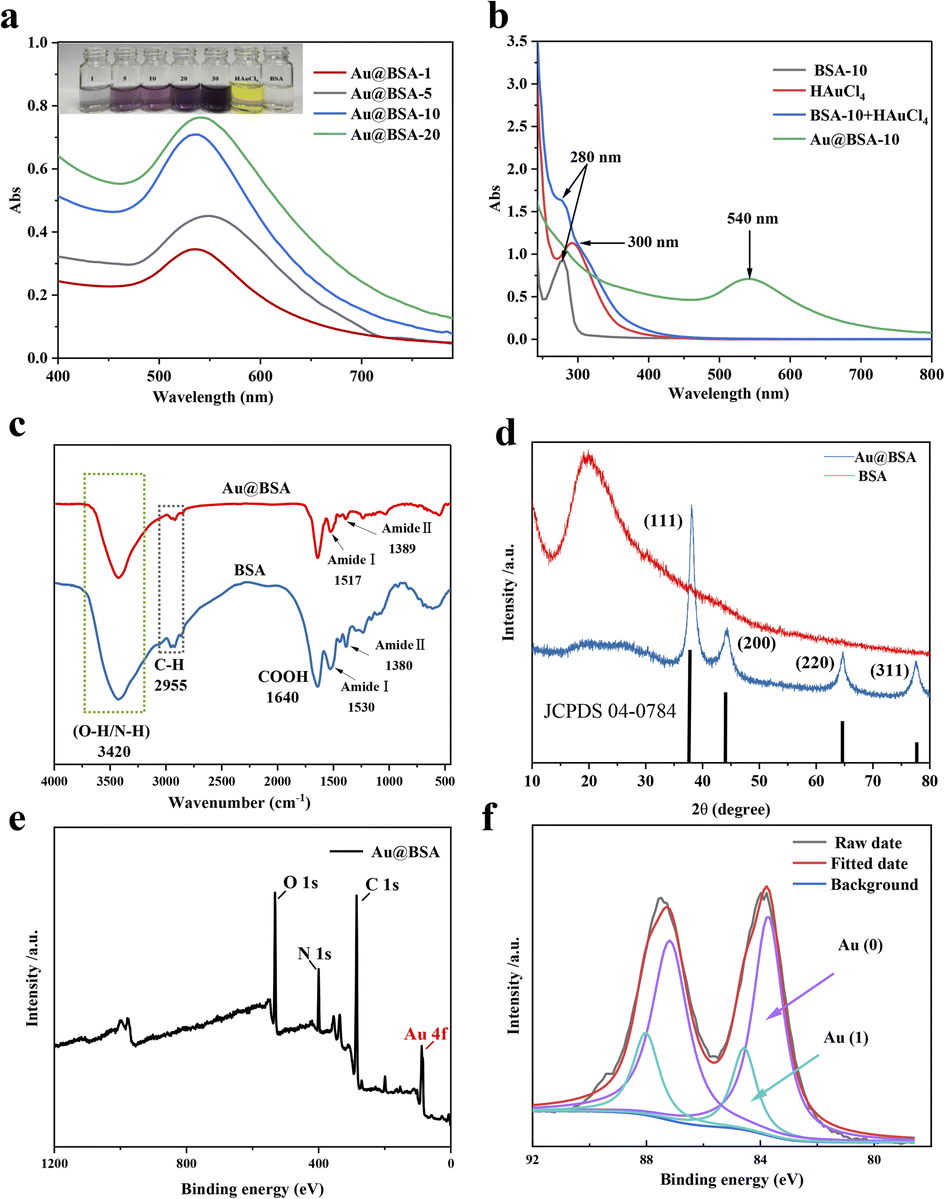 | ||
| Fig. 2 (a) UV-vis spectra of nanoparticles prepared with different concentrations of BSA, the illustration was the corresponding photo of Au@BSA-n (n = 1, 5, 10, 20), and (b) Au@BSA-10, BSA (10 μM), HAuCl4 (1%) and BSA (10 μM) + HAuCl4 (1%), (c) FT-IR spectra of BSA and Au@BSA, (d) XRD patterns of Au@BSA, (e) XPS survey spectra and (f) XPS profile of Au 4f in Au@BSA NPs. | ||
Furthermore, UV-vis spectrophotometer was used to examine different types of enzyme catalytic effects (HRP + GOx) assisted by QCM as shown in Fig. S2.† The content of the glucose can be determined by the amount of the insoluble 4-CD produced from the reaction between 4-CN and H2O2 which is the product of the glucose oxidization. Fig. 3(a) shows the QCM frequency response in different stage with the reaction process of the target molecule 4-CN over the Au NPs.30 The introduction of the nanozyme, 10 mg mL−1 Au@BSA NPs causes the QCM frequency dropped sharply and stable after several min, corresponding to self-assembly of Au@BSA NPs on gold sensor surface. The magnitude of the frequency change (Δf) decreases with time and reaches to steady-state after 35 min, indicating the full coverage of the Au@BSA NPs on gold sensor. 5 mM glucose solution has gone through the sensor chamber for 10 min without causing frequency change (<5 Hz) prior to the introduction of 1 mM 4-CN when a sharp frequency drop of about 100 Hz can be observed and indicates the formation of the insoluble product, 4-CD. The frequency drops slowly with the reaction time and becomes stable after 12 min. Since the insoluble 4-CD is accumulated little by little on the QCM sensor, the frequency decrease is proportional to the accumulative amount of the product formed on the sensor and, therefore, represents the ability of the Au@BSA NPs to oxidize the glucose in solution.
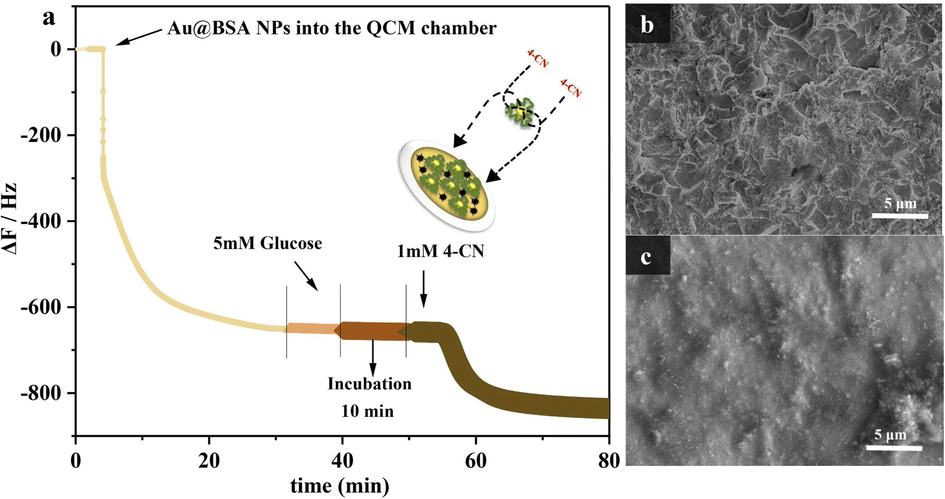 | ||
| Fig. 3 (a) Based on the QCM detection process, from sensor preparation to glucose response. SEM images of Au@BSA NPs coated gold electrodes before (b) and after (c) the formation of Au@BSA NPs nanozyme-catalyzed precipitate. | ||
SEM shows the morphology on sensor before (Fig. 3(b)) and after reaction (Fig. 3(c)), where a large amount of 4-CD is formed and deposited on the electrode surface during the reaction and consistent with the results measured by other methods,31 which again confirms that the QCM sensor can work effectively for the enzymatic catalysis with mass variance.
Quantitative analysis and measurement optimization
The nanozyme of Au@BSA NPs formed around the Au NPs with different size have different catalytic activity and, therefore, corresponding to the different frequency shift for the QCM sensor,32 which is prepared by changing the ratio of BSA to Au. As seen in Fig. S3,† the frequency shifts increases with the decrease of the Au NPs size in nanozyme, corresponding to the change of their catalytic activity. However, the catalytic activity for 2 nm Au NPs decreases due to the instability of the Au@BSA NPs complex system.33As seen in Fig. 4, the Au@BSA NPs glucose sensor can work under a wider and more acidic pH range with excellent thermal stability and storage stability compared with the conventional enzyme HRP + GOx sensor. For the performance comparison in terms of pH, temperature and period of storage between native enzymes and nanozymes, each experiment has been performed 3 times. It can be observed in Fig. 4(a) that the Au@BSA NPs sensor exhibits higher relative activity over pH range of 2.0–8.0, where the highest activity achieved at pH 6.0 is considered as 100%, and maintain above 80% of the relative activity in a pH range of 3.0–7.0. In contrast, the HRP + GOx dual-enzyme sensor is active only in a narrower pH range of 5.0–7.0 (Fig. 4(b)) indicating that the nanozyme sensor is more active and robust compared with the natural enzymes. Interestingly, it can be found in Fig. 4(c) that the activity of the Au@BSA NPs glucose nanozyme increases with the increase of the incubation temperature up to 60 °C. However, the activity of the natural enzyme decreases dramatically above 45 °C (Fig. 4(d)). In addition, this Au@BSA NPs nanozyme sensor can be stored for up to 40 days without significant deterioration on its catalytic activity compared the natural enzyme as shown in Fig. 4(e) and (f), and nearly 95% of its activity remains for the nanozyme after 40 days of storage in Fig. 4(e). In contrast, the activity of the native enzyme decreases significantly over storage time and only 34% of its activity remains after 40 days of storage under the same conditions as seen in Fig. 4(f). Therefore, the nanozyme sensor developed in this work has much stronger environmental tolerance and much longer activity-maintaining storage time and higher stability, which is more applicable for the use in household glucose detection.
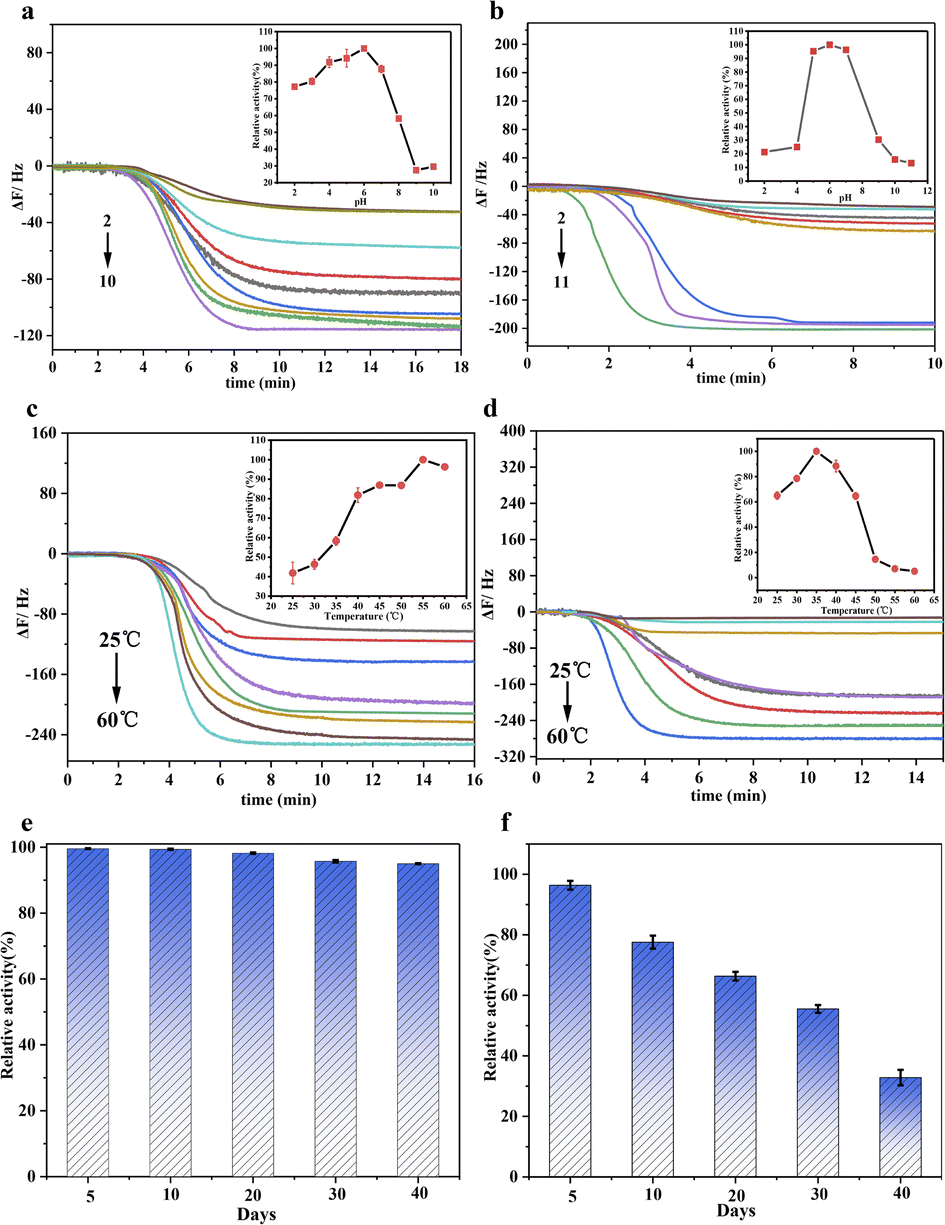 | ||
| Fig. 4 pH-dependent catalytic activity of (a) Au@BSA NPs and (b) HRP + GOx QCM sensor, temperature-dependent catalytic activity of (c) Au@BSA NPs and (d) HRP + GOx QCM sensors (inset denotes the change of QCM frequency), and comparison of the catalytic activity of (e) Au@BSA NPs and (f) HRP + GOx QCM sensors after different period of storage. | ||
Dual-purpose enzyme based on Au@BSA NPs with tandem catalytic activity acts either as GOx to catalyze glucose to form glucose acid and H2O2, which or works as HRP to convert 4-CN to 4-CD, where trace 4-CD precipitate is formed on the sensor surface to indicate the oxidization extent of the glucose as monitored by QCM. As it can be seen in Fig. 5(a), the addition of 1.0 mM of 4-CN causes obvious frequency drop up to 230 Hz. The experimental results show the frequency shift is linearly correlated to the glucose concentration in the range of 0.05 to 15 mM as seen in Fig. 5(b). The dose–response curves are determined by the frequency shifts before and after the addition of 4-CN, where f = fn − f0, fn and f0 are the frequency of the QCM sensor in the presence and absence of 4-CN, respectively, and the repeated times, n = 3 used in this work. The linear regression obtains an equation expressed as ΔF (Hz) = 8.74 + 14.18 × C [glucose] (mM) (R2 = 0.997). As glucose concentration > 15 mM, the dose–response is over-saturated since the binding sites on the nanozyme surface are significant less than the number of the glucose molecules.34,35 However, the normal glucose level in human serum is between 3.3 and 6.1 mM, so the measurement range of Au@BSA nanozyme can well meet the need for both blood and urine glucose analysis and detection.36
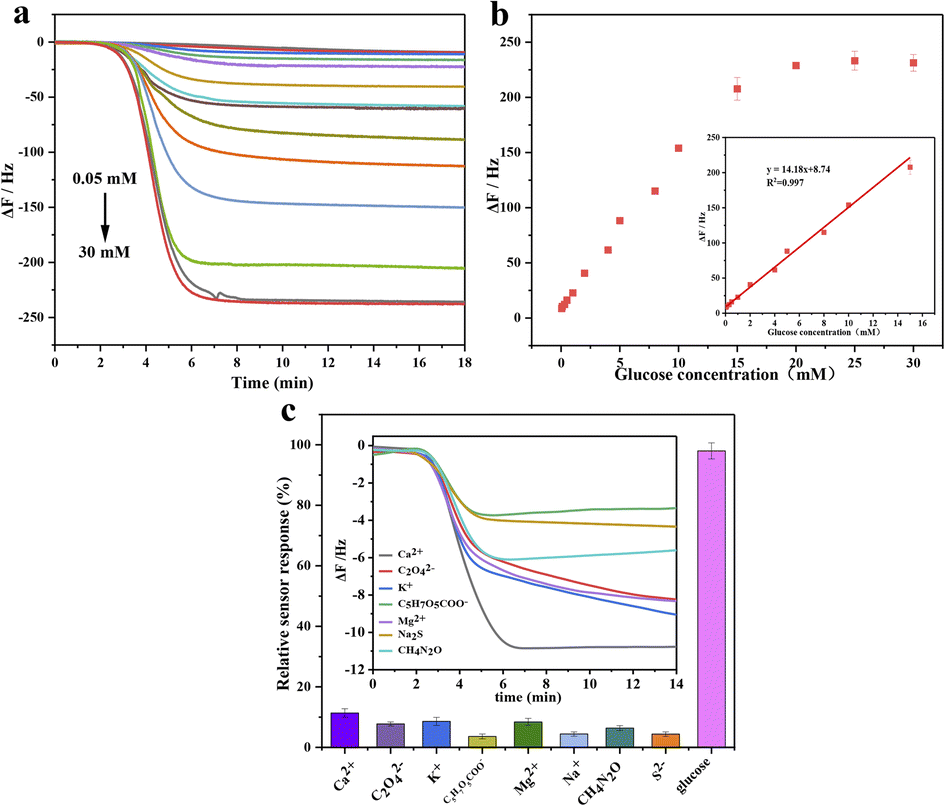 | ||
| Fig. 5 (a) QCM responses of the sensor to different concentrations of glucose standards (frequency vs. time), (b) standard curve of glucose concentration vs. frequency (inset is a linear fit relationship) and (c) the repeated ion selectivity test for the components in urine-like mixture. | ||
As we know, urine contains lots of components such as Ca2+, C2O42−, K+, C5H7O5COO−, Mg2+, Na+, CH4N2O, S2−, glucose and water etc., where the frequency change caused by these components is significantly lower than glucose as seen in Fig. 5(c) indicating its excellent selectivity for glucose detection in urine-like mixture.
Glucose detection in artificial urine
Timely monitoring the glucose level in the urine is crucial for diabetic patients as the glucose concentration in the urine increases significantly with the increase of the glucose level up to the renal threshold (10 mM), leading to hyperglycemia.37 In order to verify the practical applicability of the Au@BSA nanozyme sensor for urine glucose detection, the Au@BSA nanozyme sensor is measured at different concentration of glucose, e.g., 5, 10, and 15 mM, respectively, in artificial urine. For comparison, the same sample has also been analyzed by commercial urine glucose test strips. As summarized in Table 1, the recovery by Au@BSA nanozyme ranges from 98.1% to 105.2% which is similar to that of the commercial strip, and the RSD% ranges from 0.38% to 0.88% which is much lower than that of the commercial one and indicates that the Au@BSA nanozyme sensor has better detection precision for urine glucose than commercial urine test strip.| Sample | Glucose (mM) | Urine glucose test strips | Au@BSA nanozyme glucose sensor | ||||
|---|---|---|---|---|---|---|---|
| Ave. glucose conc. (mM) | RSD%a N = 3 | Recovery (%)b | Ave. glucose conc. (mM) | RSD%a N = 3 | Recovery (%)b | ||
a Relative standard deviation (RSD%) = (standard deviation (SD)/arithmetic mean (![[x with combining low line]](https://www.rsc.org/images/entities/i_char_0078_0332.gif) ) of the calculation results) × 100.b Recovery calculated using (measured value/glucose value) × 100. ) of the calculation results) × 100.b Recovery calculated using (measured value/glucose value) × 100. |
|||||||
| 1 | 5 | 4.33 | 18.48 | 80.0–111.0 | 5.24 | 0.38 | 104.4–105.2 |
| 2 | 10 | 9.67 | 9.75 | 90.0–111.0 | 10.35 | 0.88 | 102.8–104.5 |
| 3 | 15 | 10.00 | 16.33 | 53.33–80.0 | 14.84 | 0.75 | 98.1–99.6 |
As seen in Table 2, the QCM Au@BSA nanozyme technology developed in this work can measure the urine glucose directly without the need of sample dilution.3 However, in contrast to other nanozyme technology, the QCM Au@BSA nanozyme technology uses an in situ one-pot assay that does not require the sample transfer. In addition, our Au@BSA nanozyme technology can achieve tandem catalysis effect for the two-step reaction through a single enzyme system and simplify the sensor fabrication besides its broad dynamic detection range and excellent robustness.
| Catalyst | Detection method | Line range (mM) | Steps | Dilution | Reference |
|---|---|---|---|---|---|
| Rh NPs | UV-vis | 0.005–0.125 | 2 | Required | 38 |
| NiFe2O4 NPs | UV-vis | 9.4 × 10⁻⁴–0.025 | 2 | Required | 39 |
| Free-standing Cu nanozyme | UV-vis | 0.5–15 | 2 | No | 40 |
| Fe–Pd/rGO | UV-vis | 0.001–0.2 | 2 | No | 41 |
| CuO-IL/rGO | CV | 0.03–7.0 | 1 | Required | 42 |
| Au/GO | CV | 0.5–9.0 | 1 | No | 43 |
| Au NPs@DNA hydrogel | UV-vis | 0–20 | 1 | Not mentioned | 44 |
| Au@BSA NPs | QCM | 0.05–15 | 1 | No | This work |
Conclusion
In summary, this study provides a sensitive and robust approach to detect glucose with broad dynamic concentration range in artificial urine using Au@BSA NPs nanocomposite based on QCM sensor. The QCM sensor was coated with Au@BSA NPs by a simple one-step method, which can work as dual-purpose enzyme in the presence of glucose and catalyzes glucose into glucose acid and H2O2 as GOx does and then the formed H2O2 further oxidizes 4-CN to produce insoluble 4-CD as HRP does. The experimental results show that the Au@BSA nanozyme sensor can real-time monitor the oxidation of 4-CN in the linear dynamic glucose range of 0.05–15 mM in urine with good sensitivity and precision. In addition, Au@BSA nanozyme shows better robustness over broad working temperature and pH range than that of the conventional enzyme system and ultra-long storage period compared to natural enzymes, which can maintain excellent biological activity up to 40 days. Therefore, the Au@BSA NPs nanozyme QCM sensor is considered to be a promising technology for the detection of high concentration of glucose in complex system.Author contributions
Dengfeng Zhou: software, validation, writing – original draft. Wenyao Song: software, methodology. Shuangbin Zhang: software, visualization, investigation. Lan Chen: methodology, project administration, resources, formal analysis. Guanglu Ge: supervision, funding acquisition, project administration, resources writing – review & editing.Conflicts of interest
There are no conflicts to declare.Acknowledgements
This work was supported by the National Key Research and Development Program of China (No. 2021YFA1202804), and the Strategic Priority Research Program of Chinese Academy of Sciences (Grant No. XDB36000000).References
- D. Geiger, Pfluegers Arch., 2020, 472, 1111–1128 CrossRef CAS PubMed.
- Z. F. Gao, E. E. Sann, X. Lou, R. Liu, J. Dai, X. Zuo, F. Xia and L. Jiang, NPG Asia Mater., 2018, 10, 177–189 CrossRef CAS.
- S. Sunoqrot, A. Al-Hadid, A. Manasrah, R. Khnouf and L. H. Ibrahim, RSC Adv., 2021, 11, 39582–39592 RSC.
- J. Hippisley-Cox and C. Coupland, BMJ, 2016, 352 Search PubMed.
- L. Tang, S. J. Chang, C.-J. Chen and J.-T. Liu, Sensors, 2020, 20, 6925 CrossRef CAS PubMed.
- P. Rossetti, J. Bondia, J. Vehí and C. G. Fanelli, Sensors, 2010, 10, 10936–10952 CrossRef CAS PubMed.
- L. Zhang, C. Gu, H. Ma, L. Zhu, J. Wen, H. Xu, H. Liu and L. Li, Anal. Bioanal. Chem., 2019, 411, 21–36 CrossRef CAS PubMed.
- I. Shitanda, Y. Fujimura, S. Nohara, Y. Hoshi, M. Itagaki and S. Tsujimura, J. Electrochem. Soc., 2019, 166, B1063 CrossRef CAS.
- M. N. Karim, S. R. Anderson, S. Singh, R. Ramanathan and V. Bansal, Biosens. Bioelectron., 2018, 110, 8–15 CrossRef CAS PubMed.
- E. Koushki, F. M. Mohammadabadi, J. Baedi and A. Ghasedi, Photodiagn. Photodyn. Ther., 2020, 30, 101771 CrossRef CAS PubMed.
- G. Yan, Y. Zhang and W. Di, Analyst, 2018, 143, 2915–2922 RSC.
- L. Gao, J. Zhuang, L. Nie, J. Zhang, Y. Zhang, N. Gu, T. Wang, J. Feng, D. Yang and S. Perrett, Nat. Nanotechnol., 2007, 2, 577–583 CrossRef CAS PubMed.
- C. Jiang, T. He, Q. Tang, J. He, Q. Ren, D.-Y. Zhang, B. Gurram, N. T. Blum, Y. Chen, P. Huang and J. Lin, Appl. Mater. Today, 2022, 26, 101357 CrossRef.
- S. Gao, H. Lin, H. Zhang, H. Yao, Y. Chen and J. Shi, Adv. Sci., 2019, 6, 1801733 CrossRef PubMed.
- H. Zhang, X. Liang, L. Han and F. Li, Small, 2018, 14, 1803256 CrossRef PubMed.
- Y. Qian, Y. Du, J. Feng, R. Xu, X. Ren, D. Fan, Q. Wei and H. Ju, Sens. Actuators, B, 2021, 334, 129608 CrossRef CAS.
- Q. Yang, L. Li, L. Sun, Z. Ye, Y. Wang and X. Guo, J. Polym. Sci., 2021, 59, 2201–2211 CrossRef CAS.
- P. A. Raymundo-Pereira, F. M. Shimizu, D. Coelho, M. H. Piazzeta, A. L. Gobbi, S. A. Machado and O. N. Oliveira Jr, Biosens. Bioelectron., 2016, 86, 369–376 CrossRef CAS PubMed.
- W. Lu, X. Qin, A. M. Asiri, A. O. Al-Youbi and X. Sun, Analyst, 2013, 138, 417–420 RSC.
- Z. Liu, H. Liu, L. Wang and X. Su, Anal. Chim. Acta, 2016, 932, 88–97 CrossRef CAS PubMed.
- Y. Tang, D. Tang, J. Zhang and D. Tang, Anal. Chim. Acta, 2018, 1031, 161–168 CrossRef CAS PubMed.
- T. Juřík and P. Skládal, Chem. Pap., 2015, 69, 167–175 Search PubMed.
- S. Yoshida, T. Miyake, S. Yamamoto, S. Furukawa, T. Niiya, H. Senba, S. Kanzaki, O. Yoshida, T. Ishihara, M. Koizumi, M. Hirooka, T. Kumagi, M. Abe, K. Kitai, B. Matsuura and Y. Hiasa, J. Diabetes Invest., 2018, 9, 769–775 CrossRef CAS PubMed.
- H. A. Alhazmi, M. Al Bratty, A. M. Meraya, A. Najmi, M. S. Alam, S. A. Javed and W. Ahsan, Acta Biochim. Pol., 2021, 68, 99–107 CAS.
- S. Govindaraju, S. R. Ankireddy, B. Viswanath, J. Kim and K. Yun, Sci. Rep., 2017, 7, 40298 CrossRef CAS PubMed.
- K. Zhong, C. Hao, H. Liu, H. Yang and R. Sun, J. Photochem. Photobiol., A, 2021, 408, 113100 CrossRef CAS.
- L. Li, W. Feng and P. Ji, AIChE J., 2011, 57, 3507–3513 CrossRef CAS.
- T. Rahmani, A. Hajian, A. Afkhami and H. Bagheri, New J. Chem., 2018, 42, 7213–7222 RSC.
- W. Li, B. Chen, H. Zhang, Y. Sun, J. Wang, J. Zhang and Y. Fu, Biosens. Bioelectron., 2015, 66, 251–258 CrossRef CAS PubMed.
- X. Deng, M. Chen, Q. Fu, N. M. Smeets, F. Xu, Z. Zhang, C. D. Filipe and T. Hoare, ACS Appl. Mater. Interfaces, 2016, 8, 1893–1902 CrossRef CAS PubMed.
- L. Chi, C. Xu, S. Li, X. Wang, D. Tang and F. Xue, Analyst, 2020, 145, 6111–6118 RSC.
- M. Sharifi, K. Faryabi, A. J. Talaei, M. S. Shekha, M. Ale-Ebrahim, A. Salihi, N. M. Q. Nanakali, F. M. Aziz, B. Rasti and A. Hasan, J. Mol. Liq., 2020, 297, 112004 CrossRef CAS.
- Z. Li, N. Young, M. Di Vece, S. Palomba, R. Palmer, A. Bleloch, B. Curley, R. Johnston, J. Jiang and J. Yuan, Nature, 2008, 451, 46–48 CrossRef CAS PubMed.
- A. Sharma, S. Tiwari and J. L. Marty, Nanozymes: Advances and Applications, 2021, p. 75 Search PubMed.
- Y. Chong, Q. Liu and C. C. Ge, Nano Today, 2021, 37, 101076 CrossRef CAS.
- P. J. Martins, M. Haas and S. Obici, Diabetes, 2010, 59, 2418–2425 CrossRef CAS PubMed.
- A. E. Kitabchi, G. E. Umpierrez, M. B. Murphy, E. J. Barrett, R. A. Kreisberg, J. I. Malone and B. M. Wall, Diabetes Care, 2001, 24, 131–153 CrossRef CAS PubMed.
- T. G. Choleva, V. A. Gatselou, G. Z. Tsogas and D. L. Giokas, Microchim. Acta, 2018, 185, 1–9 CrossRef CAS PubMed.
- L. Su, W. Qin, H. Zhang, Z. U. Rahman, C. Ren, S. Ma and X. Chen, Biosens. Bioelectron., 2015, 63, 384–391 CrossRef CAS PubMed.
- S. Naveen Prasad, P. Weerathunge, M. Karim, S. Anderson, S. Hashmi, P. D. Mariathomas, V. Bansal and R. Ramanathan, Anal. Bioanal. Chem., 2021, 413, 1279–1291 CrossRef CAS PubMed.
- C. Yang, W. Feng, Y. Li, X. Tian, Z. Zhou, L. Lu and Y. Nie, Dyes Pigm., 2019, 164, 20–26 CrossRef CAS.
- N. Janmee, P. Preechakasedkit, N. Rodthongkum, O. Chailapakul, P. Potiyaraj and N. Ruecha, Anal. Methods, 2021, 13, 2796–2803 RSC.
- A. S. Shamsabadi, H. Tavanai, M. Ranjbar, A. Farnood and M. Bazarganipour, Mater. Today Commun., 2020, 24, 100963 CrossRef CAS.
- Y. Ma, Y. Mao, Y. An, T. Tian, H. Zhang, J. Yan, Z. Zhu and C. J. Yang, Analyst, 2018, 143, 1679–1684 RSC.
Footnote |
| † Electronic supplementary information (ESI) available. See DOI: https://doi.org/10.1039/d2ra04707a |
| This journal is © The Royal Society of Chemistry 2022 |