DOI:
10.1039/D2RA04230D
(Paper)
RSC Adv., 2022,
12, 29734-29756
Study of molar properties of GO after doping with transition metals for photodegradation of fluorescent dyes†
Received
8th July 2022
, Accepted 23rd August 2022
First published on 18th October 2022
Abstract
We synthesized graphene oxide (GO) doped with transition metal ions and characterized it using XPS, FT-IR, TGA/DTG, XRD, SEM, AFM, ICP-OES, UV/vis, and Raman spectroscopy. An intrinsic viscosity [η] of 0.002–0.012 g% @ 0.002 aq-GO was determined for viscosity average molecular weight (Mv) of GO at 288.15, 298.15, and 308.15 K. Mark–Houwink (M–H) constants k (cm3 g−1) and a (cm3 mol g−2) were calculated for 5–15 mg/100 mL polyvinylpyrrolidone (PVP), using 29, 40, 55 kg mol−1 as markers for calculating Mv by fitting the [η] to the Mark–Houwink–Sakurada equation (MHSE). We obtained 48![[thin space (1/6-em)]](https://www.rsc.org/images/entities/char_2009.gif) 134.19 g mol−1 Mv at 298.15 K, and the apparent molar (Vϕm, cm3 mol−1), limiting molar volumes (V0GO)G
134.19 g mol−1 Mv at 298.15 K, and the apparent molar (Vϕm, cm3 mol−1), limiting molar volumes (V0GO)G![[O with combining right harpoon above (vector)]](https://www.rsc.org/images/entities/char_004f_20d1.gif) 0, enthalpy (ΔHm, J mol−1), entropy (ΔSm, J mol−1 K−1), viscosity (ηm, mPa s mol−1), surface tension (γm, mN m−1 mol−1), friccohesity (σm, scm−1 mol−1), fractional volume (ϕm, cm3 mol−1), isentropic compressibility (Ksϕ,m, 10−4 cm s2 g−1 mol), infer GO molar consistency throughout the chemical processes. Molar properties (MPs) infer a GO monodispersion producing negative electrons (e−) and positive holes (h+) under sunlight. The transition metal ions (Fe2+, Mn2+, Ni2+, Cr3+, TMI) doped onto GO (TMI-GO), can photodegrade methylene blue (MB) in 60 min compared with 120 min using GO alone. The 4011 C atoms, 688 hexagonal sheets, 222 π-conjugations, and 4011 FE were calculated from the 48
0, enthalpy (ΔHm, J mol−1), entropy (ΔSm, J mol−1 K−1), viscosity (ηm, mPa s mol−1), surface tension (γm, mN m−1 mol−1), friccohesity (σm, scm−1 mol−1), fractional volume (ϕm, cm3 mol−1), isentropic compressibility (Ksϕ,m, 10−4 cm s2 g−1 mol), infer GO molar consistency throughout the chemical processes. Molar properties (MPs) infer a GO monodispersion producing negative electrons (e−) and positive holes (h+) under sunlight. The transition metal ions (Fe2+, Mn2+, Ni2+, Cr3+, TMI) doped onto GO (TMI-GO), can photodegrade methylene blue (MB) in 60 min compared with 120 min using GO alone. The 4011 C atoms, 688 hexagonal sheets, 222 π-conjugations, and 4011 FE were calculated from the 48![[thin space (1/6-em)]](https://www.rsc.org/images/entities/char_2009.gif) 134.19 g mol−1. The functional edges are the negative and positive holes generating centres of the GO 2D sheets.
134.19 g mol−1. The functional edges are the negative and positive holes generating centres of the GO 2D sheets.
Introduction
The Mv molar property of stoichiometric transition metal-doped 2D graphene oxide (TMI-GO) is a potential measure for the photocatalytic properties of fluorescent dyes. GO is widely used in the design of energy storage, telecommunication network, and solar energy functional materials.1 However, to date no GO molar ratio driven approach has been adopted. TMI-GO works as a photocatalyst by capturing photons (ℏν) from sunlight to generate electrons (e−) and holes (h+) resonating with the same frequency as a dye, to which they transfer energy, this photonic energy – mobile electrons – reduces the dye. Molar activities are not applicable unless Mv is determined, so the activities of GO with unknown Mv cannot widen applications on a molar scale.
GO could efficiently photodegrade polluting effluents in energy storage systems, if the TMI-GO e− and h+ energy corresponds. The size and surface charge of GO and TMI-GO affect wavefunction (ψ), so Mv needs to be a single mole of GO in a 2D sheet which remains fairly stable. The Mv depicts the alignment of holes to generate redox cycles. TMI-GO interfaces are recyclable photocatalysts with robust redox cycles as TMI and GO have close electronic clouds which retain their intrinsic activity.2 The GO molar activities have never been focused on for molar photodegradation efficiency, so Mv is needed. Monodispersed GO is a viable route for balancing the cohesive and adhesive forces (cohad) without restricting orientations. Fluid and static dynamic activities of GO have been interfaced to determine the Mv using a survismeter at normal temperature and pressure (NTP).3 GO sheets of different sizes were streamlined on capillary flow; as orientations may be faster or slower. So, a viscous flow time was averaged to determine [η]. The values of [η] consider a contribution of a certain sheet size, as the ultrasensitive GO sheets at boiling point for Mv determination, could damage the photocatalytic ability. Thus, Mv could help in the design of efficient solar cells, light emitting diodes, piezoelectric sensors and oscillatory sensors.4,5
Solid exfoliated photocatalyst GO sheets are efficient but are still limited to h+ and e− generation compared to higher surface areas with infinite redox cycles. Molar GO could be doped with heterocyclic compounds and transitional metal sulfide nanoparticles to study molar interfacial activities.4,5 The photocatalytic activities of TMI-GO are high for the degradation of methylene blue (MB), and could be used to disintegrate this polymeric waste material into smaller alkyl chains to synthesize petrol and diesel.6
TMI-GO resonating holes in the same phase offer a new dimension of photocatalytic chemistry. The molar activities advance dispersion, surface area, and surface charges based on Mv for energy storage per mole, contrary to per gram. Large 2D laminar sheets as per Mv, affect quantum yield (Φ) of TMI-GO unlike a packed sheet with stronger van der Waals forces. The Mv of GO determines adsorption per mole of heavy metals, colourants, cancerous biodegradable wastes for in situ photodegradation and adsorption.6 The Mv could revolutionize size dependent design of single, double and multiwalled carbon nanotubes.2 Cannon–Brookfield–Ubbelohde viscometers measure the viscosity of aq-GO sensitive aq-solution without pressure equilibrium. A pressure equilibrium with a flow of 2D-GO nanothin laminar sheets may get partially folded by the cohesive forces. The survismeter with a dual force mechanism can measure the [η] by considering cohesive as well as adhesive forces for Mv. Utracki et al. determined k and a constants from [η] of 6 to 6000 kg mol−1 polystyrene in cyclohexane by mol. wt. of the macromolecule.7 Dohmen et al.8 determined the [η] for 200 to 1000 g mol−1 polyethylene glycol in a homologous series of primary alcohols – acetone, and toluene at 298.2 to 323.2 K. Sadeghi et al.9 reported the smallest effect of temperature on mol. wt., but GO is electronically sensitive and robustly responds to temperature variation. This mechanism has never been investigated as no Mv for GO has been reported. The k and a from [η] values of aq-polyvinylpyrrolidone (PVP) for 10 kg mol−1 are reported for a mol. wt. of small-size macromolecules, but the Mv of GO has never been reported at 298.15 K.10,11 No markers for k and a have been reported yet for desirable levels of aq-PVP; the [η] is temperature dependent so k and a values vary at each temperature. Currently, g% is used to calculate molar properties (MPs) which could not provide information on molecular size vs. photocatalytic activity. Restrictions surrounding g% have obstructed the study of MPs despite high reproducibility and accuracy (Table 1).
Table 1 Molar properties of GO in the literature
| Molar properties |
Comparison |
| Our studies |
Ref. |
Mol. wt. |
| Surface tension |
Yes |
27–33 |
No |
| Viscosity |
Yes |
28,32–40 |
No |
| Intrinsic viscosity |
Yes |
No |
— |
| Friccohesity |
Yes |
38 |
No |
| Isentropic compressibility |
Yes |
No |
No |
| Fractional volume |
Yes |
34–36,41 |
No |
| Entropy |
Yes |
4,25 |
No |
| Enthalpy |
Yes |
4,25,42,43 |
No |
| Gibbs free energy |
Yes |
4,25,42,43 |
No |
| Mol. wt. of GO |
Yes |
No |
— |
| Apparent molar volume |
Yes |
No |
— |
Here, the molar size and surface area are used to design and develop wider GO applications. The Mv analyses of GO molar activities could be used for electrolyte, dendrimer, or ionic liquids for quality products and energy storage. Now Mv, vis-á-vis the stoichiometry of oxidizing mixtures and corresponding steps to synthesize GO of specific size, could be a new standard. This paper is a novel study on the chemistry of GO as a photocatalyst, including number of carbon atoms, pi conjugation, and number of functional edges, by determining the molar mass of GO. These studies are reported for the first time and are supported with physicochemical properties to evidence molar consistency during the chemical processes.
Experimental section
Materials and method
Graphite (Gt) flakes, H2SO4 (98%), H3PO4 (85%), H2O2 (30%) AgNO3, MB, CrCl3, MnCl2, FeCl2, NiCl2, and PVP (29, 40, 55 kg mol−1) were procured from Sigma-Aldrich; KMnO4, NaCl, and HCl (36%) from Rankem; petroleum ether (40–60) from SRL; absolute alcohol from Scvuksmandli Ltd India. The chemicals were used as received and the solutions were prepared in Milli-Q water of 0.5 × 10⁻⁷ scm−1 conductance.
Synthesis of GO from Gt
GO was synthesized with a mixture of H2SO4 and H3PO4 in an 8.5![[thin space (1/6-em)]](https://www.rsc.org/images/entities/char_2009.gif) :
:![[thin space (1/6-em)]](https://www.rsc.org/images/entities/char_2009.gif) 1.5 ratio, this mixture was poured dropwise into 500 mL RB flask containing Gt and KMnO4 in 1
1.5 ratio, this mixture was poured dropwise into 500 mL RB flask containing Gt and KMnO4 in 1![[thin space (1/6-em)]](https://www.rsc.org/images/entities/char_2009.gif) :
:![[thin space (1/6-em)]](https://www.rsc.org/images/entities/char_2009.gif) 6 ratio (9 g) kept on an ice bath. The suspension was kept for 30 min at room temperature (RT) and was refluxed for 12 h at 650 rpm at 55 °C. Ice-cold water and 3 mL H2O2 were mixed in a reaction mixture to cease the reaction.4 The resultant product was centrifuged at 8000 rpm for 10 min and was washed with water and (5%) HCl alternately until the supernatant attained pH 7. The final washing was done with absolute alcohol. AgNO3 and BaCl2 tests ensured the complete removal of NaCl and Na2SO4 after washing. A cake-like brownish sediment was coagulated with petroleum ether and extracted in a Petri dish and dried at 60 °C for 24 h. GtO was exfoliated with minimum water by sonicating @ 28 kHz for 3 h to disrupt ABAB sheet stacking so a brownish GO was obtained (Fig. 1).
6 ratio (9 g) kept on an ice bath. The suspension was kept for 30 min at room temperature (RT) and was refluxed for 12 h at 650 rpm at 55 °C. Ice-cold water and 3 mL H2O2 were mixed in a reaction mixture to cease the reaction.4 The resultant product was centrifuged at 8000 rpm for 10 min and was washed with water and (5%) HCl alternately until the supernatant attained pH 7. The final washing was done with absolute alcohol. AgNO3 and BaCl2 tests ensured the complete removal of NaCl and Na2SO4 after washing. A cake-like brownish sediment was coagulated with petroleum ether and extracted in a Petri dish and dried at 60 °C for 24 h. GtO was exfoliated with minimum water by sonicating @ 28 kHz for 3 h to disrupt ABAB sheet stacking so a brownish GO was obtained (Fig. 1).
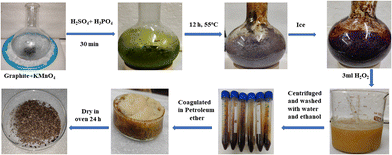 |
| | Fig. 1 GO preparation in the continuous process. | |
GO doped with TMI via photonic energy in sunlight
Transition metal salts (CrCl3, MnCl2, FeCl2 and NiCl2) were mixed with GO in a 1![[thin space (1/6-em)]](https://www.rsc.org/images/entities/char_2009.gif) :
:![[thin space (1/6-em)]](https://www.rsc.org/images/entities/char_2009.gif) 4 ratio in a glass tube kept in sunlight for 90 min. The resultant material is noted as the TMI-GO template which settled at the bottom. The template was washed with water 2–3 times to remove unused TMI and GO. The AgNO3 test ensured the complete removal of Cl− ions. The TMI-GO was dried in a vacuum oven for 3 h at 50 °C to produce the powder form for use in the MB photodegradation.
4 ratio in a glass tube kept in sunlight for 90 min. The resultant material is noted as the TMI-GO template which settled at the bottom. The template was washed with water 2–3 times to remove unused TMI and GO. The AgNO3 test ensured the complete removal of Cl− ions. The TMI-GO was dried in a vacuum oven for 3 h at 50 °C to produce the powder form for use in the MB photodegradation.
Characterization
UV/vis spectra were recorded with Shimadzu UV1800 double beam spectrophotometer. X-ray diffraction (XRD) spectra were recorded on a Bruker Advance-D8 diffractometer with CuKα radiation (λ = 0.15406 nm, 40 kV, 40 mA). Thermal stability was determined using thermogravimetric analysis (TGA) in a N2 environment on a EXSTAR TG/DTA 7300 analyzer. Functional groups were analyzed with an FT-IR spectrometer (PerkinElmer, Spectrum 65). Morphology and size were recorded using scanning electron microscopy (Zeiss Sigma 300) and atomic force microscopy (AFM5100 N). X-ray photoelectron spectroscopy (XPS) was performed at RT at ∼10−9 mbar with the help of hemispherical electron energy analyser (Phoibos 100 from Specs GmbH) and a non-monochromatic AlKα (1486.6 eV) laboratory X-ray source. The molar properties were measured using a Mansingh survismeter (Cal. 06070582/1.01/C − 0395, NPL, GOI).
Results and discussion
X-ray diffraction of GO and Gt
XRD elucidates the lattice of GO at 2θ = 6° with a broad peak at an intensity of 2735 cps, and 2θ = 8.85° with a sharp peak at an intensity 6900 cps (Fig. 2, black line). The mean free path is decreased at 2θ = 6° as electron–electron repulsion occurs with a lower intensity, but upon sheet aligning at 0.997 nm it is increased.
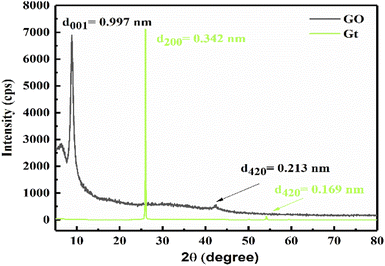 |
| | Fig. 2 XRD of GO and Gt with intersheet distance. | |
A separate sheet supports unhindered hole generation for better photocatalysis. The nascent O atom with two lone pairs of electrons intercalates with the Gt layer to form GO. XRD of Gt is depicted at 2θ = 26° with d200 = 0.342 nm intersheet distance with a mild lattice (Fig. 2, green line), supported by TGA at 193 °C.
Thermogravimetric analysis (TGA) and differential thermogravimetric (DTG) analysis
Stacking of GO sheets compared to strongly packed Gt with strong binding forces, have specific latent heat which can be studied using wt loss. Fig. 3 depicts GO decomposition in two steps: as a rapid wt loss >RT with 18% at 136 °C and a major 82% wt loss at 193 °C due to the removal of thermally labile oxygen containing functional groups (–O–, –CHO, ![[double bond splayed left]](https://www.rsc.org/images/entities/char_e009.gif) CO, –COOH, –OH). These have almost the same heat capacity generating the ψ in a similar phase to that adsorbed by TMI. The 82% of GO decomposed sharply at 193 °C, unlike the broader curve at 136 °C on removal of adsorbed atmospheric gases and water: the oscillatory activities with similar ψ weaken the covalent bonding of the carbon skeleton. The sharper transitions infer crystalline exfoliated GO sheets with almost the same functional edges, unlike the 18% wt loss from 50 to 136 °C, due to expulsion of the attached water molecules. These water molecules develop a unique rheology without damaging the sheet during fluid dynamics or friccofluidics acting as a shock absorber in regard to a ‘lacey’ GO sheet.
CO, –COOH, –OH). These have almost the same heat capacity generating the ψ in a similar phase to that adsorbed by TMI. The 82% of GO decomposed sharply at 193 °C, unlike the broader curve at 136 °C on removal of adsorbed atmospheric gases and water: the oscillatory activities with similar ψ weaken the covalent bonding of the carbon skeleton. The sharper transitions infer crystalline exfoliated GO sheets with almost the same functional edges, unlike the 18% wt loss from 50 to 136 °C, due to expulsion of the attached water molecules. These water molecules develop a unique rheology without damaging the sheet during fluid dynamics or friccofluidics acting as a shock absorber in regard to a ‘lacey’ GO sheet.
Such interstitial linkages of water protect the GO sheets during the fluid dynamic experiments using a survismeter, unlike with BP, LC-MS, and MALDI TOF. The interaction between electrostatic dipoles (ED) with FE of GO as GO-FE-ED-H2O template bind the water dipoles strongly. The water does not obtain adequate energy to escape, unlike the O atoms of the functional groups upon a regular heating, where the sheet–sheet van der Waals forces are zero. The aqueous solutions of GO and TMI-GO remain stable and have reproduced the viscosity, surface tension and density primary data over 3 months. The reproduced primary data infer the structural stability. The GO and TMI-GO in solid states are fairly stable as studied using wt losses. The major wt losses of 82, 29, 45, 60 and 71% are at 193, 750, 345, 342 and 356 °C for GO, Cr-GO, Mn-GO, Fe-GO, and Ni-GO, respectively. These substances are non-hydroscopic and non-oxidizable with atmospheric air. The aqueous solutions of GO and TMI-GO were individually prepared at NTP, which remained monodispersed without coagulation or nanoclustering. These features inferred their stability even in aqueous solutions. Their stability in aqueous solutions was verified using aqueous solutions to photocatalyze MB in sunlight (SL), their molecular structures interacted with photons for photocatalysis. Thus, the photocatalytic reduction (PCR) and adsorption of the dyes authenticate their stability.
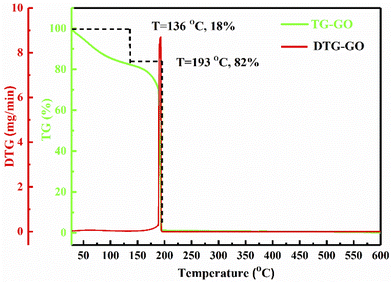 |
| | Fig. 3 TGA and DTG of GO with a prominent transition at 193 °C. | |
A sharper decomposition infers a single crystal lattice with accurate Mv following a Newtonian liquid. The functional edges of GO orient with different energies and stronger optimization at 193 °C (Fig. 3). GO and TMI-GO both respond to photons of sunlight as their functional edges are electronically sensitive with UV/vis, light. The sharper λmax infers the holes interact while the C-skeleton with h+ and e− excite the electrons of O to oscillate. The electrons of O and the holes with induce a maximum electron–electron repulsion resulting in mild collisions as the wavefunction of the electrons harmonize.
UV/vis analysis
The broad UV peak with GO and O bonding at 312 nm infers a uniform O symmetric C-skeleton. The π → π* transition of the hexagonal GO sheet oscillates at 8.718 × 10⁻¹⁹ J compared to 6.371 × 10⁻¹⁹ J for the n → π* of the O atom. These infer an effective response of photons where GO interacts with sunlight (ESI, Fig. 3.5†). The π → π* of GO and n → π*of the O atom of (–COOH, ![[double bond splayed left]](https://www.rsc.org/images/entities/char_e009.gif) CO, –CHO, –OH, –O–) oscillate in the same phase. The active sites contribute to disperse water on GO for accurate Mv (Fig. 4).
CO, –CHO, –OH, –O–) oscillate in the same phase. The active sites contribute to disperse water on GO for accurate Mv (Fig. 4).
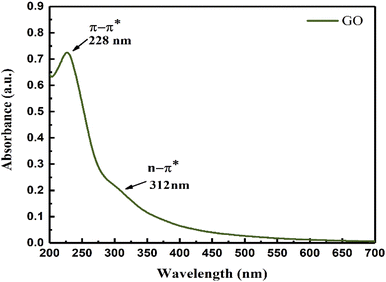 |
| | Fig. 4 UV/vis spectra of GO. | |
Scanning electron microscopy (SEM)
The lacey GO 2D sheet holding various functional groups is realigned to stack that gained a thickness. The different stacking patterns are analysed with SEM micrographs, for its analysis, the sample uniformly was spreaded on carbon tape and mounted on the stub stuck of the equipment. Inside the coating chamber, plasma sputtering was directed on a stub, targeting Au and Pd in a 80![[thin space (1/6-em)]](https://www.rsc.org/images/entities/char_2009.gif) :
:![[thin space (1/6-em)]](https://www.rsc.org/images/entities/char_2009.gif) 20 ratio for coating. After coating, a 7 kV beam stimulated the secondary electrons from the GO surface. GO morphology is rough, furrowed multiple layers or ripples with the stronger H-bonding between the multiple successive layers of GO. Fig. 5 shows the pattern of monodispersed lacey GO sheets with a higher surface area. The GO sheets are stacked, however, they seem to be of equal size and dimension, optimized with functional groups at specific stretching frequencies.
20 ratio for coating. After coating, a 7 kV beam stimulated the secondary electrons from the GO surface. GO morphology is rough, furrowed multiple layers or ripples with the stronger H-bonding between the multiple successive layers of GO. Fig. 5 shows the pattern of monodispersed lacey GO sheets with a higher surface area. The GO sheets are stacked, however, they seem to be of equal size and dimension, optimized with functional groups at specific stretching frequencies.
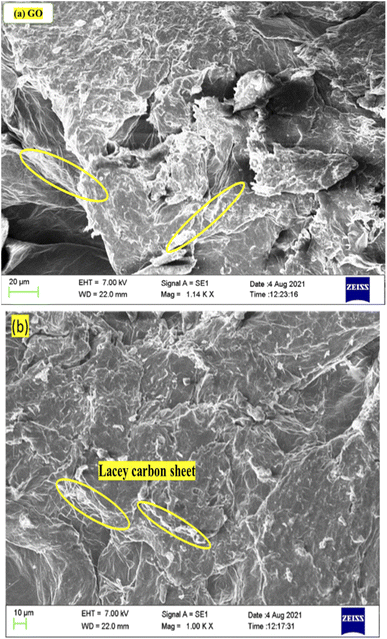 |
| | Fig. 5 SEM of GO (a) 20 μm and (b) 10 μm, infer laminar sheets of lacey carbon. | |
FT-IR analysis
FT-IR stretching frequencies via Fourier transform at similar frequencies depict the specific spatial alignment at a close interface. The spatial arrangements are optimized but the stretching intensity causes the internal morphology to optimize as sheets, as the density of –O–, –CHO, ![[double bond splayed left]](https://www.rsc.org/images/entities/char_e009.gif) CO, –COOH, –OH increases (Fig. 5). The stretching frequencies of –COOH,
CO, –COOH, –OH increases (Fig. 5). The stretching frequencies of –COOH, ![[double bond splayed left]](https://www.rsc.org/images/entities/char_e009.gif) CO, –CHO, –OH, –O– at wavenumber (
CO, –CHO, –OH, –O– at wavenumber (![[small nu, Greek, macron]](https://www.rsc.org/images/entities/i_char_e0ce.gif) )6,12 and their transmittance bands, infer bond energies.13 The broad peak at 3351 cm−1 is due to the –OH of water bonding on the GO surface. The –O–, –CHO,
)6,12 and their transmittance bands, infer bond energies.13 The broad peak at 3351 cm−1 is due to the –OH of water bonding on the GO surface. The –O–, –CHO, ![[double bond splayed left]](https://www.rsc.org/images/entities/char_e009.gif) CO, –COOH, –OH give IR bands at 1071, 1400, 1250, 1750, 1626 cm−1, respectively (Fig. 6).12,14 The symmetric stretching alignment with stable dipoles and higher polarizability which stack to develop the topographic surface, are illustrated with Raman spectroscopy and AFM.
CO, –COOH, –OH give IR bands at 1071, 1400, 1250, 1750, 1626 cm−1, respectively (Fig. 6).12,14 The symmetric stretching alignment with stable dipoles and higher polarizability which stack to develop the topographic surface, are illustrated with Raman spectroscopy and AFM.
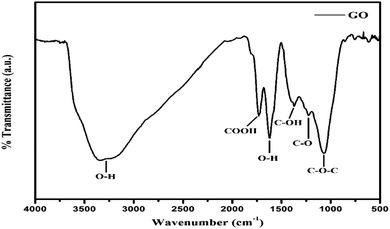 |
| | Fig. 6 FT-IR spectra of GO containing oxygenated functional groups. | |
Atomic force microscopy (AFM)
AFM was carried out on a 1 × 1 cm thin film of GO on silica wafer using a non-contact mode for capturing the surface morphology and thickness. AFM shows the topography of ∼1.05 nm thick single layer and complete GO exfoliation, in agreement with the literature.15–17 AFM infers topography with ∼1.05 nm thick single layer individual GO sheets, in agreement with the literature.15–17 The soft GO sheet has wrinkles and overlaps that are optimized by the sheet density of state. The number of sheets in a specific area infer their stacking as a single layer of ∼1.05 nm thickness, whereas the remaining sheets correspond to multilayer GO stacks (Fig. 7a–c). The standard preparation protocol enabled the exfoliation of individual GO sheet stacking, harmonized along the z-axis with multiple restricted splits (Scheme 1).
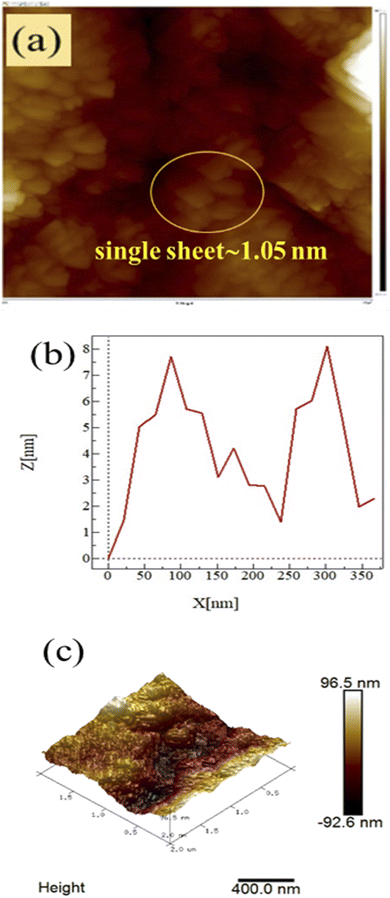 |
| | Fig. 7 (a) Inferred surface morphology, (b) z-axis, and (c) 3D image, of GO. | |
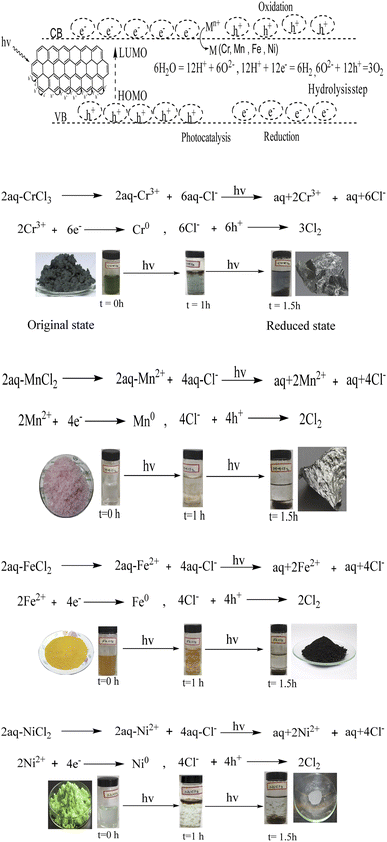 |
| | Scheme 1 GO doped with TMI. | |
The 2D GO nanosheets have been stacked next to each other due to weak van der Waals forces as the sheets have (–COOH, CO, –CHO, −OH, –O–) functional groups, along with the active functional edges. These chemical species have active surface charges that interact and lead to the stacking of the GO sheets along the z-axis. This stacking is not compact, and is rather loosely bound and develops adequate h+ and e− holes. Hence, these functional moieties of the 2D GO sheets align the individual sheet via stacking. The furrows and ridges are seen in the topography of the GO sheets which infer the equal distribution of the stacked sheets with weak cohesive and adhesive forces. These activities are properly explained by the friccohesity data (Tables 16–18). Photons can easily enter the stacks or furrows (Fig. 7). The furrows are almost equally distributed as the z-thickness of the adjacent furrows is almost equal. Hence these are synchronised and integrated as a single unit of 96.5 nm height within 400 nm. These data further evidence the porosity of the GO sheets needed for PCR (Fig. 24).
Raman spectroscopy analysis
Raman analyses ID/IG = 0.91 < 1 of D (deformed) and G (symmetric) bands with intensities of 3800 and 4200 cps, as G > D shows symmetric deformation on the GO sheet. The intensities at specific shifts provide information on the defects, crystalline structures, and alignments on GO.18 The D, G and 2D peaks at 1355, 1599 and 2924 cm−1, respectively, correspond to sp2–sp3 C–C stretching, and the (ID/IG) intensity ratio shows the disorder of a sheet.19
The Raman spectra infer 1st order scattering of the E2g phonon from sp2 C atoms causing a G band at 1599 cm−1 and a k-point breaking of the A1g symmetry. The reduced 2D intensity infers modulated bumps due to minor reorientation, which is a competing mechanism where the defects increase with intensity of the G band. The number of defects controlled by ultrasonication time induced the D band at 1355 cm−1, where ID/IG < 1 infers fewer defects6,20 and 2D layer formation (Fig. 8). The split shows that there are deep furrows and upward ridges with almost symmetric surface topography, which allows weaker van der Waals forces to receive photons for hole generation. The stretching of the O atom bonds of the functional groups differ from those of the C atoms of GO (Fig. 6). The 0.002 g% aq-GO was boiled for 45 min compared to 25 min for the same amount of water with similar heating. The 0.002 g% aq-GO was cooled to RT and kept for 24 h, the thin GO sheet and gold-colour photoluminescent nanoclusters were grown and scintillated under visible light with a sharper reflection (Fig. 9). The boiling separated the rGO fragments out of the aggregated nanocluster at RT. GO sheets surrounded by H2O molecules restrict the GO–GO alignment in the z-axis, as hydrogen bonded water inhibits GO downward movement, and air pressure restricts upward growth. The surface of structured water acts as a sliding surface for GO–GO growth in the xy plane. The 2D sheet has a z-axis at least, while agglomerated 3D nanoclusters initiate secondary transitions as phosphorescence. The water dipoles within an intersheet could have kinetic and potential energies as per the Schrödinger equation.
| |
 | (1.0) |
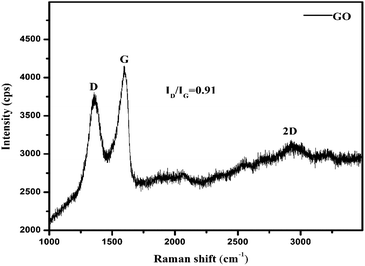 |
| | Fig. 8 Raman spectra of GO. | |
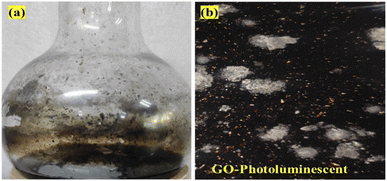 |
| | Fig. 9 (a) Formation of GO thin sheet and (b) photoluminescent-GO nanoclusters. | |
Kinetic energy (p2/2m = 0) at NTP does not generate holes within the valence and conduction bands, so there are zero changes in wavefunction as no change in eigenvalue E and eigenfunctions ψ occurs in the photocatalysis timeframe. The dipoles of water oscillate beyond the potential energy, and the functional edges with h+ and e− charges interlink the water and GO together. Thus, the surface energy explains these energy linkages.
Calculations and sample preparation for the molar properties of GO
Calibration of PVP marker to determine M–H constants. The Mv is calculated using calibration constants with 0.005–0.015 g% @ 0.005 g% of 29, 40, and 55 kg mol−1 PVP marker to determine viscosity. The viscosity of 0.002–0.012 g% aq-GO @ 0.002 g% were measured in the dark at 288.15, 298.15, and 308.15 K (Fig. 10). The H2O adhering to GO influenced the viscous flow time on reorientation, forming pendant-like drop out due to the cohesive and frictional forces. The functional edges deformed irreversibly, so a survismeter for measuring viscous flow time and pendant drop number was used. Samples were lifted from the reservoir bulb to the buffer bulb of the capillary under reduced pressure avoided mechanical shocks. The sample equilibrated in the buffer bulb for 3 min and was allowed to backward flow, a CPU (controlled pressure unit) facilitates a hassle-free capillary flow (Cal. 06070582/1.01/C − 0395, NPL, GOI).21 The M–H constants infer size and PVP interactions with specific rheology at a constant temperature with ±0.01 °C and ±0.1 × 10⁻⁵ g analytical balance (Table 2). The GO was added to an RB flask with Millipore water and equilibrated for unhindered fluid flow. The survismeter was calibrated with aq-NaCl, and closely agrees with the literature (Fig. 11 and ESI Tables 4.1–4.3 and 5.3–5.5†).
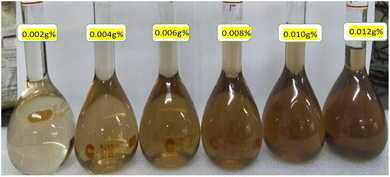 |
| | Fig. 10 GO solutions at different viscosity to investigate molar properties. | |
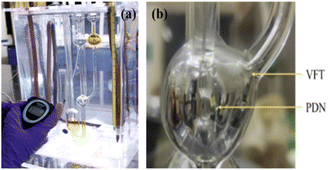 |
| | Fig. 11 (a) Sample inserted in survismeter, (b) GO solutions orientation in the capillary.24 | |
Table 2 Mark–Houwink constants
| T (K) |
k (cm3 g−1) |
a (cm3 mol g−2) |
| 288.15 |
2.611 × 10⁻¹⁰ |
2.1534 |
| 298.15 |
6.500 × 10⁸ |
−1.7264 |
| 308.15 |
4.7953 × 10⁻⁴ |
0.8465 |
Viscosity (η, mPa s). η was calcu!--lated using eqn (1.1)| |
 | (1.1) |
From the density (ρ) of aq-GO and the η0 and ρo of water, relative viscosity (ηr) is derived as:
| |
 | (1.2) |
and
| |
 | (1.3) |
The ηr is fitted using eqn (1.3) for [η] (Fig. 12(a and b), Tables 16–18 and ESI, Table 5.2†).
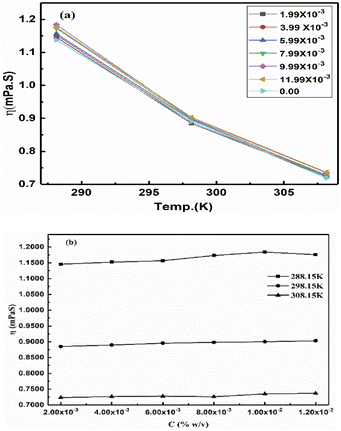 |
| | Fig. 12 (a) Viscosity vs. temperature, (b) viscosity vs. concentration. | |
Surface tension (γ, mN m−1). The γ was calculated using eqn (1.4)| |
 | (1.4) |
where γo, no, ρo and γ, n, ρ are surface tension, pendant drop numbers (pdn) and density, of water and sample, respectively (Tables 16–18, and ESI, Table 5.2, Fig. 1.0†).
Friccohesity (σ, cm S−1). The σ was calculated using eqn (1.5)| |
 | (1.5) |
The σ and σo are friccohesity of solution and water, respectively; ±B/t kinetic and ±0.0012(1 − ρ) buoyancy corrections of 1 × 10⁻⁷ order are omitted; parameters for solvents are common and rationalized with the Mansingh constant (Mc).
| |
 | (1.6) |
Friccohesity infers a homogenized aq-GO by mutually exchanging the cohad forces that lower ΔE and show solvent adherence to GO. The quantum mechanically stabilized GO acts like quantum dots with zero conductivity, unlike aq-TMI-GO. The GO with functional edges resonates to transfer energy without a change in relaxation time or mean free path by avoiding aggregation (Tables 13–15). From these quantum controls we calculated the relative (σr), specific ((σr − 1)/c), and intrinsic [σ]c→0 friccohesity (Tables 16–18, and ESI, Fig. 3.1, 3.3†). The Ea acquired from the medium reorients the functional edges vs. electrostatic dipoles, allowing energy equipartitioning that avoids spontaneous aggregation.
| |
 | (1.7) |
Where
η,
η0,
g, and
T are viscosity of solution, viscosity of solvent, degeneracy in the energy level, and temperature.
Surface excess concentration (τ, mol cm−2) and surface area (1/τ = cm2 mol−1). The τ and 1/τ both infer an excess of GO gathered at the aq-GO surface as a continuous thin layer, calculated from the slope of dγ vs. log![[thin space (1/6-em)]](https://www.rsc.org/images/entities/char_2009.gif) c with eqn (2.1),
c with eqn (2.1),| |
 | (2.1) |
where R is the gas constant and T is the temperature (see Fig. 19 below and 15 above, Table 6, and ESI, Table 5.0†).
Table 6 Molar parameters of GO at three temperaturesa
| T (K) |
Mv |
1/τ (10−6) |
Eam (10−5) |
ΔGm (10−3) |
ΔHm (103) |
ΔSm |
| Symbol: Mv = viscometric mol. wt. (g mol−1), τ = surface area (m2 mol−1), Eam = molar activation energy (J mol−1), ΔGm = molar Gibb’s free energy (J mol−1) ΔHm = molar enthalpy (J mol−1), ΔSm = molar entropy (J mol−1 K−1). |
| 288.15 |
46![[thin space (1/6-em)]](https://www.rsc.org/images/entities/char_2009.gif) 886.03 886.03 |
−2.75862 |
−1.723242 |
−4.69086 |
−5.5172489 |
−19.147125 |
| 298.15 |
48![[thin space (1/6-em)]](https://www.rsc.org/images/entities/char_2009.gif) 134.19 134.19 |
−2.85436 |
−1.723242 |
−4.75818 |
−5.7087204 |
−19.147126 |
| 308.15 |
42![[thin space (1/6-em)]](https://www.rsc.org/images/entities/char_2009.gif) 845.25 845.25 |
−2.95010 |
−1.723242 |
−4.84116 |
−5.9001917 |
−19.147126 |
Molar Gibbs free energy (ΔGm). The ΔHm and ΔSm are calculated from ηm, R, T, and Eam (molar activation energy), to determine the disorder created per mole.| |
 | (2.2) |
ΔGm, ΔHm, ΔSm, are listed in Table 6 and ESI Table 5.0†.
Molar fractional volume (ϕm) and isentropic compressibility (Ksϕm). The ϕm and Ksϕm both infer GO binding with H2O molecules and are calculated as| |
 | (2.3) |
and| |
 | (2.4) |
where ηr, u, ρ, and m are the relative viscosity, sound velocity, density, and molality (Tables 16–18, ESI, Fig. 1.8 and 2.1†).
Hydrodynamic volume (HDV). Molar radius (Rm) infers the number of the water molecules adhered to GO during viscous flow that create the HDV, calculated using [η]:and| |
 | (2.6) |
The ϕ, NA, and m, values are listed in Table 13 and ESI Table 5.6 and 4.8.† The pressure was reduced in the capillary using a piston to transfer a sample to the respective unit. On opening a pressure limb, liquid in the reservoir bulb prevents air entry and abrupt jerking. Under reduced pressure, the streamlined GO has minimal relaxation time for high accuracy in Mv. The 102 and 103 °C boiling points of 0.006 and 0.008 g% aq-GO, respectively, compared to water at 100 °C infer water is binding to GO (Fig. 9). At 288.15 K, the GO acquired energy from the medium causing a drastic change in its reorientation from 0.006 to 0.008 g%, unlike 0.012 g% GO that gets saturated upon sonication @ 28 kHz, increasing viscous flows. The lower viscosity for aq-NaCl at 298.15 K compared to 288.15 and 308.15 K, infer ion dipole interactions (Table 7). The NaCl disrupts water, unlike aq-GO and aq-PVP but similar to exfoliated GO sheets.22,23
Table 7 Internal parameters of GO sheets
| Mv |
# C-atom |
# Hexagonal sheets |
# π-conjugation |
# FE |
48![[thin space (1/6-em)]](https://www.rsc.org/images/entities/char_2009.gif) 134.19 g mol−1 134.19 g mol−1 |
4011 |
668 |
222 |
4011 |
The Mv vs. photons studies that vary the GO molar concentration were attained and focus on photons per mole of GO at various pH and temperature. The molar photocatalyzing activities were explored to reduce the dyes and transitional metal salts (Table 8). The functional edges and electrostatic dipoles streamlined the aq-GO viscous flow in a uniform capillary.25,26
Table 8 The parameters related to Φ for the reduction of MB through TMI-GOa
| TMI-GO-MB |
λabs (nm) |
λem (nm) |
Eabs (10−19) J |
Eem (10−19) J |
na (1014) s−1 |
ne (1014) s−1 |
Adsorption (%) |
Φ (%) |
| Absorbed wavelength (λabs), emitted wavelength (λem), absorbed energy (Eabs), emitted energy (Eem), number of absorbed photons (na), number of emitted photons (ne) and quantum yield (Φ). |
| Cr (4s13d5) |
663 |
668 |
2.9982 |
2.9757 |
4.52488 |
4.49102 |
85.67 |
99.25 |
| Mn (4s23d5) |
661 |
665 |
3.0073 |
2.9892 |
4.53858 |
4.51128 |
98.67 |
99.40 |
| Fe (4s23d6) |
665 |
668 |
2.9892 |
2.9757 |
4.51128 |
4.49102 |
98 |
99.55 |
| Ni (4s23d8) |
664 |
675 |
2.9937 |
2.9448 |
4.51807 |
4.44444 |
98.35 |
98.37 |
Monolayer water adhesion around GO spins are controlled by temperature as,
| |
 | (2.7) |
where
E overall energy (kinetic energy and potential energy),
EF Fermi energy,
fi occupancy of Fermi energy level,
T = 0 gives
E =
EF unlike
E ≠
EF for 298.15 K. The aligned wavefunction coordinate PCR activities as,
| |
 | (2.8) |
Where T = 0, the E = kt = P2/2m = ℏc/λ = 0 at T > 0, so the wavefunction is robust. The GO molecule being larger in size holds many functional groups with different electronic configurations holding different energies at the surfaces of the GO. The different surface energies oscillate with the different wavefunctions which generate the different orders of the energy. These are the disordered surfaces with different sets of entropies at a topography. The different entropies at the surface than the bulk states cause energies to be exchanged between the surface and the bulk states. This is described by the tentropy which becomes significant during the molecular interactions and photocatalysis. The kbT (1.38 × 10⁻²³ m2 kg s−2 K−1 × 298.15) = 411.64 m2 kg s−2 oscillates at 298.15 K with a gradient on its topographical entropy or tentropy. aq-GO has an enhanced equilibrium of cohesive vs. adhesive forces,
| |
 | (2.9) |
Eqn (2.9) infers hydrogen bonding (HB) disruption to adhere to GO upon increasing η and decreasing γ, as the HB are released by weakening cohesive force and can adhere to the GO surface. Hence, a weaker cohesive force with lower γ allows adherence to the GO surface increasing shear stress (Fig. 17). M–H constants k and a, derive from ln[η] vs. ln![[thin space (1/6-em)]](https://www.rsc.org/images/entities/char_2009.gif) M, the higher viscosity values at 298.15 K decrease with Mv unlike at 288.15 and 308.15 K. The viscosity values for aq-PVP at higher concentration are the same with almost a similar response at each temperature, this infers the presence of similar adhesive forces (Fig. 18 and Table 9). The GO has weakened the cohesive forces and strengthened the adhesive forces of H2O as shown in the ηsp/C vs. temperature plots at 288.15 and 308.15 K (ESI Fig. 3.9†), which are close but differ at 298.15 K for 0.002–0.004 g%: the concentrations used produced closely placed [η] values at 288.15 and 308.15 K, unlike 298.15 K due to a thermal alignment.
M, the higher viscosity values at 298.15 K decrease with Mv unlike at 288.15 and 308.15 K. The viscosity values for aq-PVP at higher concentration are the same with almost a similar response at each temperature, this infers the presence of similar adhesive forces (Fig. 18 and Table 9). The GO has weakened the cohesive forces and strengthened the adhesive forces of H2O as shown in the ηsp/C vs. temperature plots at 288.15 and 308.15 K (ESI Fig. 3.9†), which are close but differ at 298.15 K for 0.002–0.004 g%: the concentrations used produced closely placed [η] values at 288.15 and 308.15 K, unlike 298.15 K due to a thermal alignment.
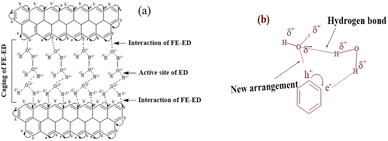 |
| | Fig. 17 (a) Interface of functional edges and electrostatic dipoles via monolayer hydration of the GO sheet, (b) sheet array with water influencing the fluid dynamics. | |
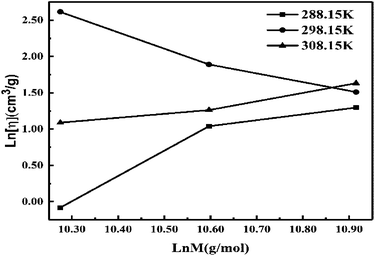 |
| | Fig. 18 ln[η] vs. ln![[thin space (1/6-em)]](https://www.rsc.org/images/entities/char_2009.gif) M for M–H constants of aq-PVP. M for M–H constants of aq-PVP. | |
| T (K) |
Intercept, k (cm3 g−1) |
Slope, a (cm3 mol g−2) |
| 288.15 |
−22.066 |
2.1534 |
| 298.15 |
20.296 |
−1.7264 |
| 308.15 |
−7.6427 |
0.8465 |
The ηsp/C values at 308.15 K, infer reorientation of the oppositely charged functional edges and electrostatic dipoles with GO–GO interactions at higher thermal energy by weakening their interactions. From 0.002 to 0.004 g% at 298.15 K increasing concentration weakens the interaction of the edges and dipoles with a stronger temperature effect (ESI Fig. 3.9†). The  infers a molar shift in interaction of edges and dipoles as a sensitive PCR vs. concentration dependence of the PCR sensor. The oscillatory arrays at 298.15 K equilibrate the interaction of the functional edges and electrostatic dipole monomer H2O via cohad ↔ cohesive ± adhesive (ESI Fig. 3.9†). The γ values decrease on increasing concentration and temperature, both weakening the cohesive forces unlike the 0.012 g% at 288.15 and 308.15 K (ESI Fig. 1.0a and b†). Results from lower density at 308.15 K compared to 288.15 and 298.15 K, infer the weaker interaction of the edges and dipolar oscillation unlike a lower thermal energy. The closely placed density values infer the GO-FE-ED-H2O template, as the interaction of edges and dipoles maintain similar adhesive forces on increasing temperature. The reproducibility of density values show the stability without clustering, due to the interaction of functional edges and electrostatic dipoles. The wavefunction of functional edges and electrostatic dipoles behave as a simple harmonic oscillator by transferring the energy at three temperatures (ESI Fig. 1.1†).
The γ at 298.15 K produced a vibrating surface energy unlike the optimized states at 288.15 and 308.15 K (Fig. 19, Table 10). The 298.15 K induces a transition state as the increasing GO concentration creates stronger edges and dipoles with nonlinear interacting activities. The H2O monomers cement the GO in GO-H2O-H2O-GO, with cohesive forces between the newly oriented H2O dipoles (Fig. 17). On increasing GO concentration, the dipoles detach and develop interfaces of functional edges and H2O of smaller size, lowering the γ.
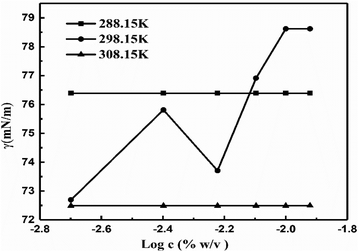 |
| | Fig. 19 The γ vs. log![[thin space (1/6-em)]](https://www.rsc.org/images/entities/char_2009.gif) c for the surface excess concentration and surface area of aq-GO. c for the surface excess concentration and surface area of aq-GO. | |
| Regression constants |
| T (K) |
Intercept (mN m−1) |
Slope (mN cm3 m−1 g−1) |
| 288.15 |
76.42 |
0.03 |
| 298.15 |
127.91 |
38.42 |
| 308.15 |
72.52 |
0.02 |
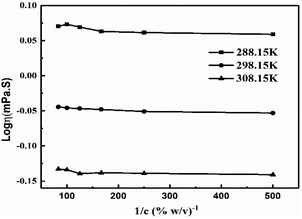
The intercept and slope values for log![[thin space (1/6-em)]](https://www.rsc.org/images/entities/char_2009.gif) η vs. 1/c decrease on decreasing GO concentration due to the stronger activity (Fig. 13, Table 3). However, on decreasing the GO concentration, the slope values decreased due to a mild effect on the surface energy.
η vs. 1/c decrease on decreasing GO concentration due to the stronger activity (Fig. 13, Table 3). However, on decreasing the GO concentration, the slope values decreased due to a mild effect on the surface energy.
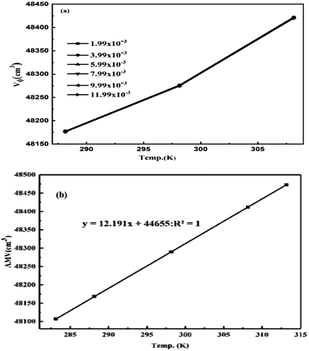
The rising temperature increased the V0GO on expansion of the core hydration sphere via interactions of the edges and dipoles vs. secondary interactions of the functional edges and electrostatic dipoles.
| |
 | (3.0) |
The
V0GO infers an infinitesimal change with the secondary activities with a minor shift in activity with 10
−7 order of isentropic compressibility. The different
V0GO values with the same GO concentrations at different temperatures, show the temperature sensitivity of the functional edges and electrostatic dipoles. The
Vϕ is calculated from the density and
Mv with their regression values (
Vϕ = 44
![[thin space (1/6-em)]](https://www.rsc.org/images/entities/char_2009.gif)
655 + 12.191
T), closely agreeing with the experimental values. The
V0GO is theoretically calculated using the values of the regression constants at 283.15 and 313.15 K which have the same order as experimental results (
Fig. 16 and
Table 5).
For 0.002–0.012 g%, there is no abrupt shift in V0GO as GO had polarized sheets with negligible changes on increasing concentration and temperature, as supported by the Raman spectra (Fig. 8). The polarized GO photodegraded the dyes efficiently and could be doped with TMI. On increasing temperature, the hydration sphere oscillates as the GO volume expands, avoiding the undesired structural defects of GO. The viscosity vs. GO concentration closely agrees with the literature values (Fig. 17b).35 The ions of NaCl are reoriented by the GO charge distribution with the respective charged centre (Fig. 7). ESI Fig. 1.2a and b† infer the PCR at 298.15 K as no amount of energy induces a transition, and the GO-FE ≈ ED-H2O uniformly responds to increasing GO moles. The viscosity and surface tension both infer the localised activities with a nonlinear trend on increasing GO concentration with a moderate shift within GO-H2O. The interactions of the functional edges and electrostatic dipoles tune the alignment, unlike spherical aq-Na+ and aq-Cl− in bulk with a residual force. The values of shear stress from 25 °C and 35 °C have a gap the same as literature values from 25 °C to 65 °C at 10 °C intervals.44 The values on increasing temperature reduce the gap negligibly in the reported values (Fig. 17a and ESI, Table 3.1†).
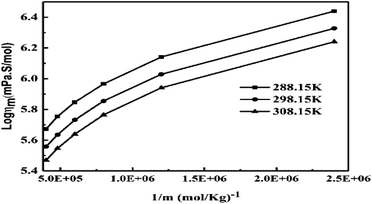
The slopes infer activities that are almost the same from 298.15 to 308.15 K, due to polarity. Hence PCR under sunlight is temperature independent. The higher GO concentration engages almost all the H2O dipoles, so a further increase in GO concentration fades out as stronger GO–GO interactions are created. The log![[thin space (1/6-em)]](https://www.rsc.org/images/entities/char_2009.gif) ηm vs. 1/m allows the calculation of Ea from the slope, and we can see the log
ηm vs. 1/m allows the calculation of Ea from the slope, and we can see the log![[thin space (1/6-em)]](https://www.rsc.org/images/entities/char_2009.gif) ηm value decreases with increasing GO moles (Fig. 14, Table 4). The γm vs. log
ηm value decreases with increasing GO moles (Fig. 14, Table 4). The γm vs. log![[thin space (1/6-em)]](https://www.rsc.org/images/entities/char_2009.gif) m allows the determination of surface area from the slope value (Fig. 15, Table 6). The [η] infers interaction of the edges and dipoles of monodisperse GO during the redox cycles (Fig. 17).
m allows the determination of surface area from the slope value (Fig. 15, Table 6). The [η] infers interaction of the edges and dipoles of monodisperse GO during the redox cycles (Fig. 17).
The k and a determine @GO interacting activities of edges and electrostatic dipoles. The log[σ] vs. cohad forces align the GO, so its wavefunction effects laminar flow causing a velocity gradient that influences ψe− ψh+ or ψh+ ψδ−−O and (ψh+ ψδ−−O) − ψ+h through the partitioning of their energies with a maximum probability. The maximum probability could develop a steady state coordinating each hole with an intrinsic friccohesity in place of [η]. The monodispersed GO sheets had determined viscosity for Mv from the UV/vis, that connect functionality with molar activity (Fig. 4). The increasing GO moles with maximum number of functional edges capture maximum photons with their 1st order absorbing ability. The absorbance vs. molality of GO generated is given by eqn (3.1)
| | |
AbsGO = −0.0482 + 1 × 10⁶x.
| (3.1) |
The 1 × 10⁶ slope infers stronger photon absorption with hole generating ability to overcome the quantum energy barrier (QEB), while extrapolation to CGO → 0 concentration gives lower Abs than the solvent. TMI-GO with a single ℏν generates phonons behaving as upconversion nanoparticles (UCNP).45
Aq-GO absorbs UV light linearly at λmax = 228 nm within 200–600 nm on increasing concentration (Fig. 20b). The 13C NMR produced a straight line along the x-axis with no sharp peak due to a GO single lattice, as the external magnetic field did not influence the functional groups bonded with the C–C skeleton of GO.46 No effect of an external magnetic field on the electronic cloud of the C atom in a hexagonal GO sheet, shows that shielding in GO and TMI-GO could allow use as a sensor for a catalysis process in high magnetic fields. For a lower concentration, the higher gap infers the availability of functional edges as temperature disrupts the alignment of GO (Fig. 21a). The molar properties are sensitive to % concentration values, so a molar scale would predict accurate concentration effects (Table 6). The ρm decreased and Vϕm increased upon increasing GO moles as the GO sheet expands with the stronger interactions, while the stronger interactions decreased the Vϕm and ρm with weaker alignment (Fig. 21). The GO-H2O interactions sandwich the H2O between the GO sheets which expands from both sides to attract the H2O (Fig. 17).
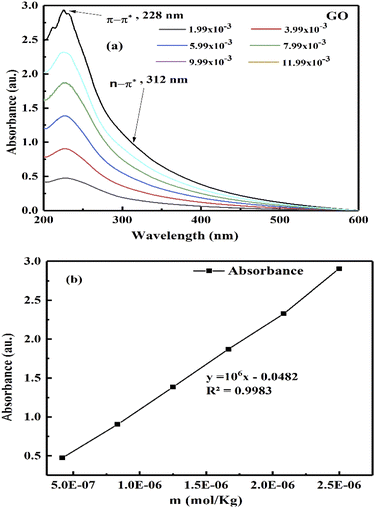 |
| | Fig. 20 (a and b) UV/vis absorbance vs. GO molality. | |
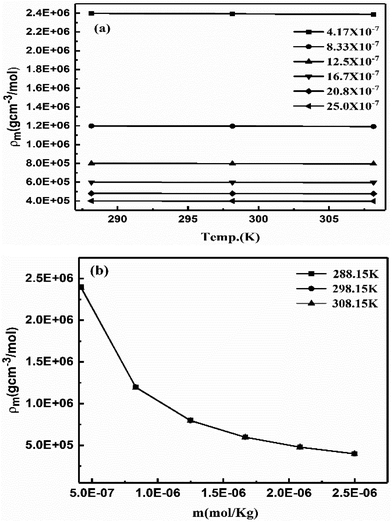 |
| | Fig. 21 Molar density vs. (a) temperature and (b) molality of aq-GO. | |
Lower GO moles have stronger electrostatic interactions restricting alignment, so the molar activities account for the contribution of each GO constituent. The aq-GO developed single walled carbon nanoparticles on its surface as a slippery sheet. The H2O molecules adhere to the GO sheets despite acquiring an energy with a lower γ with a higher ϕm. On increasing the GO moles, the ϕm increased to 16.7 × 10⁻⁷ and then became constant at 298.15 K while at 308.15 and 288.15 K, the ϕm decreased to 12.5 × 10⁻⁷ and then increased (ESI, Fig. 1.8a and b†). The ηm vs. m polynomial trends show decreasing ΔG values with increasing GO moles (Fig. 22b, ESI Fig. 1.9†). Considering dissolving GO moles, the constant ΔG is used irrespective of the ηm vs. m trend. The shift in ηm from lower to higher molality was adhered to in a 1![[thin space (1/6-em)]](https://www.rsc.org/images/entities/char_2009.gif) :
:![[thin space (1/6-em)]](https://www.rsc.org/images/entities/char_2009.gif) 1 ratio affecting aq-GO fluid dynamics (eqn (3.2)).
1 ratio affecting aq-GO fluid dynamics (eqn (3.2)).
| |
 | (3.2) |
Aq-GO is a Newtonian liquid, so the Δ
G vs. m linear trend infers nanoclustering (ESI, Fig. 1.9a and b
†). The polynomial
ηm vs. m with lower GO mole interaction should have compensated for the Δ
G vs. m with the water–GO interaction, unlike with GO–GO alignment, it did compensate at higher GO moles. The HB and GO–GO interactions might have utilised the Δ
G on increasing molality. The HB disruption forms H
2O–GO–H
2O = GO(H
2O)
n at lower concentrations,
| ΔGHB disruption in aq-GO = ΔGHB disruption in GO–GO |
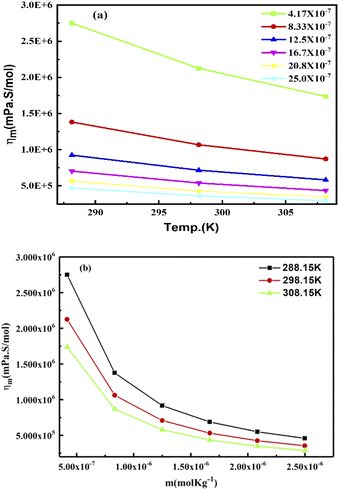 |
| | Fig. 22 (a) Molar viscosity vs. temperature and (b) molar viscosity vs. molality of aq-GO. | |
The oscillations saturate between 298.15 to 308.15 K, the Rm needs an almost equal ΔEam at 298.15 and 308.15 K,
| |
 | (3.3) |
The ΔG values decrease on increasing GO moles reducing QEB, at 3T (ESI, Fig. 1.9a and b†). The GO sheets are fragmented at the freezing and boiling points, and under electrophoresis, so the Mv could not be measured. For MALDI-TOF, the GO was mixed with matrixes of 20 to 60 kDa (kilodalton) to fragment it, but the covalent C–C skeleton was not disrupted. A MALDI-TOF intensity from −500 to 1500 (a.u.) vs. 40![[thin space (1/6-em)]](https://www.rsc.org/images/entities/char_2009.gif) 000 to 54
000 to 54![[thin space (1/6-em)]](https://www.rsc.org/images/entities/char_2009.gif) 000 g mol−1, could not distinguish a decisive distribution and so failed to produce a mol. wt. (ESI, Fig. 3.6†). LC-MS also failed as unfragmented GO did not respond to a quadrupolar magnet, the GO sheet reoriented, so a survismeter method was used to determine Mv. The wavefunction increases on rising temperature, but at m → 0, the sheets are separated. The wavefunction infers the H2O acts as a sheath between the GO sheets. The electrostatic stabilisation of the H2O as a barrier could not pass the oscillating motions from one GO sheet to another despite 2D spreading. These deviations in volume depict the lowest distance between the functional edges and electrostatic dipoles. The ions were activated but the Hδ+ were covalently bonded with the H2O, and it was difficult to disrupt the covalent bonds compared to counterbalancing the ions. The salts dissociated, where the Hδ+ activated the GO for the redox cycle without acquiring much activation energy. The studies are prerequisites to explain Φ. The coefficient [η]/[V0]m→0 infers alignment of the functional edges and electrostatic dipoles to functionalize the GO with TMI and to photodegrade the dyes depending on concentration. The aq-GO sheet with functional edges and electrostatic dipoles interacting, has a higher relaxation time within a capillary unlike the pendant drop method that has free area available for cohad forces: so no relaxation time is required for the pendant drop number. The GO develops the 1
000 g mol−1, could not distinguish a decisive distribution and so failed to produce a mol. wt. (ESI, Fig. 3.6†). LC-MS also failed as unfragmented GO did not respond to a quadrupolar magnet, the GO sheet reoriented, so a survismeter method was used to determine Mv. The wavefunction increases on rising temperature, but at m → 0, the sheets are separated. The wavefunction infers the H2O acts as a sheath between the GO sheets. The electrostatic stabilisation of the H2O as a barrier could not pass the oscillating motions from one GO sheet to another despite 2D spreading. These deviations in volume depict the lowest distance between the functional edges and electrostatic dipoles. The ions were activated but the Hδ+ were covalently bonded with the H2O, and it was difficult to disrupt the covalent bonds compared to counterbalancing the ions. The salts dissociated, where the Hδ+ activated the GO for the redox cycle without acquiring much activation energy. The studies are prerequisites to explain Φ. The coefficient [η]/[V0]m→0 infers alignment of the functional edges and electrostatic dipoles to functionalize the GO with TMI and to photodegrade the dyes depending on concentration. The aq-GO sheet with functional edges and electrostatic dipoles interacting, has a higher relaxation time within a capillary unlike the pendant drop method that has free area available for cohad forces: so no relaxation time is required for the pendant drop number. The GO develops the 1![[thin space (1/6-em)]](https://www.rsc.org/images/entities/char_2009.gif) :
:![[thin space (1/6-em)]](https://www.rsc.org/images/entities/char_2009.gif) 1 redox cycles, despite being restricted to the original state of C atoms in GO, and its size multiplying the holes. So a NaCl → Na+ + Cl (1
1 redox cycles, despite being restricted to the original state of C atoms in GO, and its size multiplying the holes. So a NaCl → Na+ + Cl (1![[thin space (1/6-em)]](https://www.rsc.org/images/entities/char_2009.gif) :
:![[thin space (1/6-em)]](https://www.rsc.org/images/entities/char_2009.gif) 1) electrolyte was chosen vis-á-vis GO laminar sheet arrays.
1) electrolyte was chosen vis-á-vis GO laminar sheet arrays.
A basic difference in GO and NaCl is dislocation of the spatial position to develop unhindered interactions between nanohydration spheres (NHS–NHS) with opposite charge. The GO has the lowest Ea so the photon did a more PCR, unlike for aq-NaCl that acquired energy from the H2O. The NaCl dissociates into Na+ and Cl− as fully independent positive and negative charges, unlike the GO holes that generate the redox cycles. The NaCl disrupts the HB unlike GO that splits the water (H2O → H2 + O2). The dissociating and H2O interacting peculiarities vis-á-vis activities of GO to split H2O, clearly distinguish GO and NaCl. The study of MPs of aq-NaCl and aq-GO as a secondary bond i.e. HB reoriented by γNa+ and γCl− with stronger interactions at a nm distance, was conducted. It caused a downward pull only in the z-dimension where a monolayer of H2O exists but the bulk solution did not have residual electrostatic dipoles: NaCl ⇌ Na+ + Cl−, γ± = γNa+ + γCl− and Na+ = Cl−, γ± = γ2. So, FE ⇌ h+ + e−, γ± = γh+ + γe− and h+ = e− γ± = γ2 where γ is the activity coefficient. The Gt and GO both have strong alternative covalent bonds and mutual hybridization occurs. The same trend is obtained with the NaCl and GO, however on increasing concentration and temperature, the viscosity decreased (ESI, Table 3.1 and 4.0†). The negative value of the slope shows the weaker cohesive forces (ESI, Table 3.8†). The 288.15 K distinguishes the salt–water interaction unlike at 298.15 and 308.15 K (ESI, Fig. 2.4a†). At 298.15 K, all the apparent molar volumes are distinguished at lower concentration, but at a higher concentration the temperature could not be detected due to stronger salt–salt saturated interactions. No ionic charge is available that could oscillate on gaining kinetic energy. The lower NaCl concentration shows a maximum oscillation at lower temperature but on increasing its concentration the temperature shows no significance. This action mechanism defines that the NaCl concentration is temperature sensitive as the residual charges at 288.15 K are comparatively more sensitive, unlike at 298.15 and 308.15 K (ESI, Fig. 2.4b†).
aq-GO doped with TMI via photonic interaction
The functional edges of GO efficiently develop negative and positive holes to substantiate the intensified redox cycles for photocatalysis. Transitional metal ions have variable valence electrons, and the sole objective for using these metal ions was to sandwich their variable electrons between the functional edges of GO, supporting HOMO to LUMO transitions. In regard to current interest in recycling wastewater, our studies have been designed to combine the advantages of the variable electrons of TMI and the functional groups of GO. The variable redox cycles generated out of the functional edges boosted by the functional groups of the GO, have tunable fluid dynamics – an excellent model of laminar or Newtonian fluid out of the symmetric GO sheet. Such TMI-GO driven nanothin films could act as the photonic sensors, be used in touch screen technology, heat dissipating sensors and similar. Therefore, the metals ions-doped GO can generate efficient robust redox cycles.
The GO was doped with Cr3+, Fe2+, Mn2+ or Ni2+, forming TMI-GO in aq-chloride salt in sunlight within ∼30–90 min. The TMI-GO with unevenly distributed holes created a different pressure on surfaces with a different kinetic energy (Fig. 23, eqn (3.4)),
| |
 | (3.4) |
 |
| | Fig. 23 (a) Aq-salt, and absorption of aq-salts by GO at time (b) 0, (c) 60, and (d) 90 min. | |
The resonating holes develop a wavefunction in the same phase as the ions, with ψcat and ψan aligning from ψh+ and ψe−, respectively. The charge countering activities interact with the H2O dipoles to bond them in place, the cohesive forces are exchanged mutually as,
| |
 | (3.5) |
Eqn (3.5) predicts GO as a doped sheet with negative and positive holes to oxidise the Cl− as 2Cl− + 2h+ = Cl2. The ions have been reduced to metal GO frameworks within the GO spatial lattice (Fig. 23a–d).
In UV/vis, Cr-GO, Mn-GO, Fe-GO, and Ni-GO utilizing 105.1, 100, 109.4 and 100% quantum absorption yield (ΦQA), respectively (Fig. 24 and ESI Table 5.1†). The Cr3+(4s03d3) receives 3e− holes from GO for quantum absorption: 1e− hole in the 3d orbital and 2e− holes in the 4s orbital, generating two UV/vis peaks, respectively (Fig. 24a and b). The Mn2+(4s03d5), Fe2+(4s03d6) and Ni2+(4s03d8) receive the 2e− holes in the 4s orbital that generate peaks at λ = ∼200 nm. The higher potential energy of paired electrons compared to unpaired, neutralises the oscillations of unpaired electrons generating weak oscillations as ψpaired electrons ↔ ψunpaired electrons.
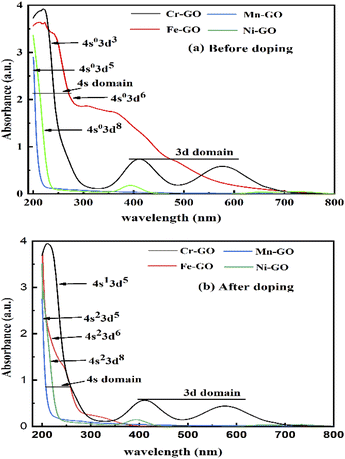 |
| | Fig. 24 UV/vis for TMI-GO (a) before and (b) after, doping. | |
The salts form cages around the cations forming NHS and aligning the H2O dipoles. The oxidation state vs. NHS reduce the cation where a cage acts as the electronic barrier (H2O-TMI-H2O). UV/vis at 228 nm produces >0.7 abs with the HOMO → LUMO state retaining 70% of the UV light. From 200 to 800 nm, the Mn2+ with abs = 0 aligned with an enhanced mechanism (Fig. 24). The Mn-GO could be a promote surface enhanced Raman sensor, unlike Ag-pyridine. Fe-GO and Ni-GO have fluctuating UV/vis abs due to a few paired electron spins. The Cr (3d3) has two empty d orbitals to oscillate, and Mn-GO aligns the GO sheet at 90° with no oscillatory disruption; Mn (3d5), Fe (3d6) and Ni (3d8) oscillate symmetrically. TMI-GO could be developed as an antibacterial or antifungal with antioxidant activities.38 The Mn2+ (4s03d5) and Fe2+ (4s03d6) have a difference of 1e− having 109.43 and 100% ΦQA, respectively. The ΦQA depends on the number of photons absorbed and emitted during PCR (ESI, Table 5.1†).
Using ICP-OES we detected the different amounts of TMI in the TMI-GO templates (Table 11). The TMI was washed before ICP detection, an equal stochiometric ratio of all metal ions was taken. The transition metal ions were adequately doped onto the GO sheets where their valency and nuclear sizes – the number of functional edges of the exfoliated GO sheets – were proven to be the prime consideration. The TMI-GO templates enhance the photocatalysis of methylene blue compared to GO alone, and the ICP-OES results also confirmed the substantial chemical binding of the transition metal ions with those of the electron clouds of the functional edges of the GO.
Table 11 ICP-OES analysis of TMI-GO
| Analyte quantity |
Corresponding intensity (g) |
Prepared concentration (mg L−1) |
| Cr 267.716 |
6416.2 |
1.584 |
| Mn 257.610 |
833![[thin space (1/6-em)]](https://www.rsc.org/images/entities/char_2009.gif) 906.2 906.2 |
30.57 |
| Fe 238.204 |
16![[thin space (1/6-em)]](https://www.rsc.org/images/entities/char_2009.gif) 539.7 539.7 |
3.30 |
| Ni 231.604 |
34![[thin space (1/6-em)]](https://www.rsc.org/images/entities/char_2009.gif) 206.2 206.2 |
27.53 |
Stronger bonding of TMI within TMI-GO reduces the IR peak as C atoms affect the oxide atom creating strong metal oxide stretches (ESI Fig. 4.2†). The GO attached to TMI stretched robustly symmetrically. ESI Fig. 4.2† infers photonic interactions with the GO reducing it to rGO; some functional groups are missing when compared to GO, and new ones appear, induced by the TMI (Fig. 6). A lower intensity of TMI-GO infers its monodispersion of oscillations. The functional edges of TMI-GO hold the H2O, and binding of TMI is explored.
The XPS spectra show the chemical composition and oxidation states of TMI binding with GO at certain binding energies of the inner electron. Fig. 25a shows the binding energy of Mn-GO and Ni-GO where the C (1s22s12px12py12pz1) atom of GO binds with the O atoms of –COOH, –OH, –O– and ![[double bond splayed left]](https://www.rsc.org/images/entities/char_e009.gif) CO, differing in their binding energies. The XPS of C 1s of Mn-GO and Ni-GO at 284, 284.8, and 287.1 eV, infer the activities of the sp2 C atom, –C–C and –COOH, respectively, due to electron clouds of the adjoining atoms (Fig. 25b). XPS spectra of O 1s of Mn–GO and Ni–GO at 530.87, 531.7, and 533.48 eV for C–OH, C–O–C and C
CO, differing in their binding energies. The XPS of C 1s of Mn-GO and Ni-GO at 284, 284.8, and 287.1 eV, infer the activities of the sp2 C atom, –C–C and –COOH, respectively, due to electron clouds of the adjoining atoms (Fig. 25b). XPS spectra of O 1s of Mn–GO and Ni–GO at 530.87, 531.7, and 533.48 eV for C–OH, C–O–C and C![[double bond, length as m-dash]](https://www.rsc.org/images/entities/char_e001.gif) O respectively depict their binding stabilities (Fig. 25c). The binding of C atoms with oxygen creates a gradient among C atoms of GO with a spontaneity to make GO receptive to respond to the TMI-GO. The binding energies are 853.2 and 870.6 eV for Ni 2p3/2 and Ni 2p1/2, respectively, along with the similar values of C 1s for C and O 1s for the O atoms (Fig. 25a–c). Similarly, the binding energies, are 641.18 and 653.33 eV for Mn 2p3/2 and Mn 2p1/2, respectively.4 The large energy difference between the Mn 2p and Ni 2p is due to the paired and unpaired electrons. The intensity of the –C
O respectively depict their binding stabilities (Fig. 25c). The binding of C atoms with oxygen creates a gradient among C atoms of GO with a spontaneity to make GO receptive to respond to the TMI-GO. The binding energies are 853.2 and 870.6 eV for Ni 2p3/2 and Ni 2p1/2, respectively, along with the similar values of C 1s for C and O 1s for the O atoms (Fig. 25a–c). Similarly, the binding energies, are 641.18 and 653.33 eV for Mn 2p3/2 and Mn 2p1/2, respectively.4 The large energy difference between the Mn 2p and Ni 2p is due to the paired and unpaired electrons. The intensity of the –C![[double bond, length as m-dash]](https://www.rsc.org/images/entities/char_e001.gif) O and –C–O reduced compared to the C–C, as GO underwent oxidation with different electronic clouds. Excellent hybridization occurs between the C and O atoms. The contribution of energy from the O 1s electron in the C skeleton, with the 1 s electron of the metal, is strong with a nucleus forming the skeleton of the GO sheets. The sharp peak of GO disappeared on binding of the TMI. The ψTMI = ψFE oscillations of half-filled 3d e− of Mn (4s23d5) approached the conduction band of the 4p orbital and conduction band of the GO. The valence band of TMI could approach the conduction band of GO. The unengaged lattices of the 2D GO sheets provided XRD with maximum intensity. Upon doping, the electronic clouds of the functional edges were engaged by the TMI; so the sharp peak of GO at 2θ = 8.85° was lost (ESI Fig. 4.3†).
O and –C–O reduced compared to the C–C, as GO underwent oxidation with different electronic clouds. Excellent hybridization occurs between the C and O atoms. The contribution of energy from the O 1s electron in the C skeleton, with the 1 s electron of the metal, is strong with a nucleus forming the skeleton of the GO sheets. The sharp peak of GO disappeared on binding of the TMI. The ψTMI = ψFE oscillations of half-filled 3d e− of Mn (4s23d5) approached the conduction band of the 4p orbital and conduction band of the GO. The valence band of TMI could approach the conduction band of GO. The unengaged lattices of the 2D GO sheets provided XRD with maximum intensity. Upon doping, the electronic clouds of the functional edges were engaged by the TMI; so the sharp peak of GO at 2θ = 8.85° was lost (ESI Fig. 4.3†).
 |
| | Fig. 25 (a) XPS of Mn-GO and Ni-GO survey spectra, (b) C 1s, (c) O 1s, (d) Ni 2p, and (e) Mn 2p. | |
FE were not blocked by ions; instead they homogenise when they do not acquire sufficient energy to reach the oxidation potential of Mn+. TMI-GO enhanced the water absorbing ability at low temperature. The GO could absorb 18% water at 136 °C and Cr-GO absorbs ∼32% at 101 °C (Fig. 3 and Fig. 26(i)). The TMI vs. C in the GO network develops large nuclear charge differences at a higher temperature. The C atoms in GO have a single lattice with a corresponding peak appearing in the TGA spectra (Fig. 26(i)). On heating, the e− gets excited and then returns to the ground state, so the single lattice has the same oscillations producing a single sharp peak in the TGA. TMI in TMI-GO is attached to carbon of the GO, so the oscillations of the sheet are changed. The heat capacities of different patches with different e− produce different lines in the TGA (Fig. 26(i–iv)). New lattices are developed with new oscillation patterns with different wt losses, where no H2O is present at 224 °C except crystalline H2O. Two peaks with five unpaired e− oscillate, which cannot occur in a lattice so the nuclei are responsible for the peaks (Fig. 26ii). The e− of Cr-GO oscillates at a lower energy with a wt loss at lower temperature, unlike Mn-GO at 224 °C (Fig. 26(ii)). A single lattice is formed where a paired e− neutralizes the unpaired e−; together the e− provide a similar lattice on gaining equal heat with a single peak at 356 °C. Fig. 3 and 26(iii), depict Fe2+ doping with functional edges and show the enhanced activity of TMI-GO on losing a least wt until 800 °C, due to increased stability of the TMI-GO (Fig. 26).
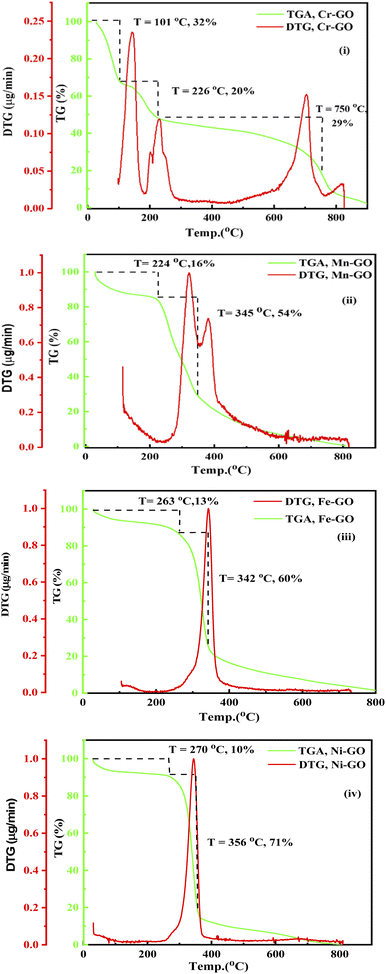 |
| | Fig. 26 TGA and DTG: (i) Cr-GO, (ii) Mn-GO, (iii) Fe-GO, (iv) Ni-GO. | |
Fig. 27(a and b) provide the binding constant (kB) of TMI-GO as calculated by extrapolation of density vs. concentration. The lower GO densities with increasing concentration, compared to TMI-GO, infer the accommodation of TMI within a sheet without disrupting the GO geometry. With increasing concentration, Mn-GO shows a slightly different trend, due to a half-filled d-orbital with ultrasensitive GO, where the smallest bandgap generates conductivity: their 3d electrons bind with GO for functionality. The Mn-GO acts as a more robust photocatalyst than the other TMI. The kb values are given in Table 12.
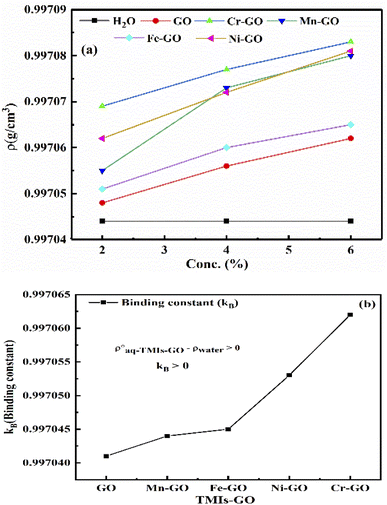 |
| | Fig. 27 (a) Density vs. concentration, (b) binding constant between aq-GO and TMI. | |
MB has a symmetric structure with continuous π-conjugation along with hydrophobic methyl groups at the terminal sites of the benzene rings. MB responds strongly to photons – unlike brilliant blue red (BBR) and brilliant blue green (BBG) – due to its quaternary nitrogen atom which is reduced (Fig. 28). The MB as a whole can also be reoriented under SL, and responds to the holes generated by GO at the closest permittivity and lowering of the QEB. The chloride ion attached to the quaternary nitrogen vibrates the secondary bond and detaches, resulting in lower activation energy to engage the positive holes (Fig. 29). MB fits in the intersheet arrangement of GO or TMI-GO, however, PCRs replacing MB using BBR and BBG are being pursued.
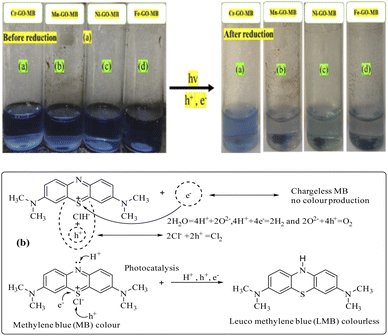 |
| | Fig. 28 (a) Reduction of MB by TMI-GO in sunlight and (b) the proposed mechanism. | |
 |
| | Fig. 29 Quantum tunnelling effect during reduction, which produces wavefunctions. | |
GO alone takes longer to catalyse PCR of MB than TMI-GO (Fig. 30).4
| | |
Time shift = t(TMI-GO) − t(TMI-GO-MB)
| (3.6) |
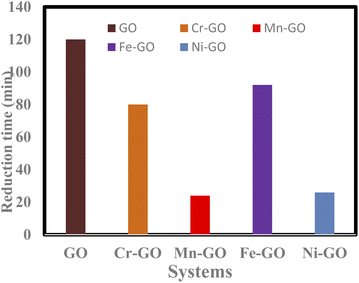 |
| | Fig. 30 Time taken for GO and TMI-GO to reduce MB. | |
The bandgaps of GO and TMI-GO were determined from the Tauc plot as
| |
 | (3.7) |
where
α is the absorption coefficient,
Eg the optical bandgap,
B the band tailing parameter, ℏ
ν is photon energy, and
n = ½ for the direct bandgap. The
Eg is calculated by extrapolating a straight-line from the curve between (
αℏ
ν)
2 vs. ℏ
ν when
α is equal to zero. The bandgap for GO, Cr-GO, Mn-GO, Fe-GO, and Ni-GO are 4.29, 3.87, 2.12, 4.47 and 3.00 eV, respectively (
Fig. 31). Mn-GO conducts electricity (
Fig. 32): as the interface between Mn and GO increases, absorption occurs due to the HOMO → LUMO transition. The Mn-GO quantum absorption infers nanocluster formation at 2.12 eV
Eg (
Fig. 31). Hence the choice of TMI affects the resultant nanocluster bandgap size (
Table 12).
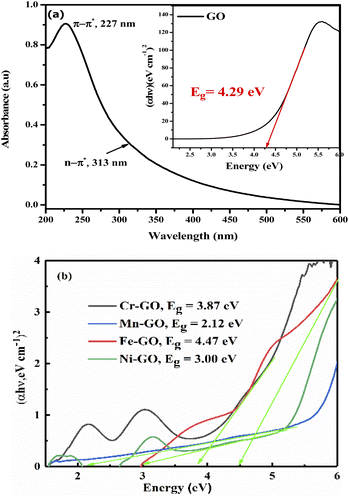 |
| | Fig. 31 (a) Bandgap energy from the Tauc plot of: (a) aq-GO and (b) the TMI-GO samples. | |
 |
| | Fig. 32 Conductivity of: (i) pure water; (ii) aq-GO; (iii) Cr-GO; (iv) Mn-GO; (v) Fe-GO; and (vi) Ni-GO. | |
Table 12 Rate of PCR and bandgap energy of TMI-GO with binding constant
| TMI-GO |
Doping time (min) TMI-GO |
Reducing time (min) GO-TMI![[thin space (1/6-em)]](https://www.rsc.org/images/entities/char_2009.gif) : :![[thin space (1/6-em)]](https://www.rsc.org/images/entities/char_2009.gif) MB MB |
Time shift |
Eg (eV) |
kb of TMI-GO (10−5) |
| Cr-GO |
150 |
70 |
80 |
3.87 |
2.1 |
| Mn-GO |
62 |
38 |
24 |
2.12 |
1.4 |
| Fe-GO |
118 |
26 |
92 |
4.47 |
0.33 |
| Ni-GO |
78 |
52 |
26 |
3.00 |
1.63 |
The smooth Mn-GO surface quenched any undesired surface charges, and is a heat, acid–base and chemical resistant structure. 70% Φ of GO is attained yet the aq-GO does not conduct electricity due to the larger bandgap, despite the holes with a confinement of Eg = 4.29 eV. The lower TMI-GO amount reduces a large amount of dye due to the aligned holes with a shorter bandgap that generate surface plasmonic resonance (Fig. 31).
neither aq-GO or Millipore water can light a bulb upon connection with 220 V at RT. However, TMI-GO allows electricity flow – the Mn-GO catalyses PCR of MB in 62 min due to stable poles, but Fe-GO has large Eg (4.47 eV). aq-GO as a sensor can determine conductivity and concentration variations.
The adsorption activity of MB by TMI-GO is calculated as
| |
 | (3.8) |
where
Eabs is absorbed energy,
Eem is emitted energy,
na is the number of photons absorbed,
ne is the number of photons emitted, (
λabsis the absorbed wavelength,
λem is the emitted wavelength and
Φ is quantum yield.
| |
 | (3.9) |
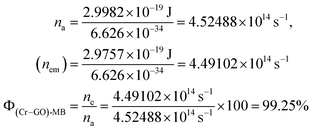
C0 is the initial MB concentration at time t = 0, and Ct is amount of reduced MB at t min. MB reduction of 98.7, 98, and 98.4% > GO by Mn-GO, Fe-GO and Ni-GO was found, respectively. The λabs is 663, 661, 665, 664 and the λem is 668, 665, 668 and 675 for (Cr-GO)-MB, (Mn-GO)-MB, (Fe-GO)-MB and (Ni-GO)-MB, respectively (Fig. 33). The Φ for MB reduction by (Cr-GO) is given by eqn (4.0)
| λabs = 663 nm and λem = 668 nm, |
| Eabs = 2.9982 × 10⁻¹⁹ J, Eem = 2.9757 × 10⁻¹⁹ J |
| |
 | (4.0) |
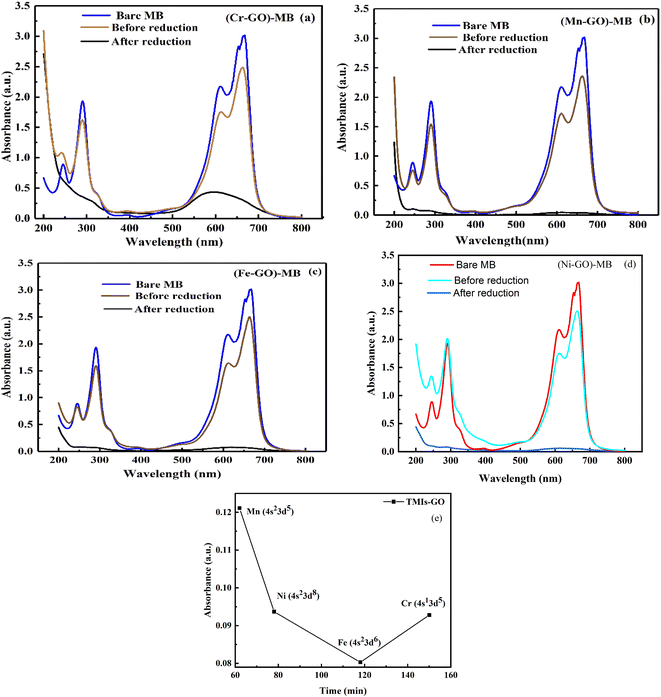 |
| | Fig. 33 UV/vis before and after MB reduction with: (a) Cr-GO, (b) Mn-GO, (c) Fe-GO, (d) Ni-GO and (e) absorbance vs. temperature for each TMI-GO-MB. | |
The Φ for (Mn-GO)-MB, (Fe-GO)-MB and (Ni-GO)-MB are 99.40, 99.55 and 98.37%, respectively. The Φ for MB reduction is 99.55 (Fe-GO) > 99.40% (Mn-GO) > 99.25 (Cr-GO) > 98.37% (Ni-GO) where the Fe-GO and Mn-GO have maximum Φ with Ea. TMI-GO reduced 99.14% MB compared to 88% by GO alone (Table 8).
aq-GO can photodegrade sugar, caffeine and the phytochemicals of tea with milk in 2 h, followed by H2O splitting and the appearance of the black fine powder of CNPs (Fig. 34c): the GO on receiving a photon reduces the π-conjugation of caffeine (C8H10N4O2). The sheets are aligned to store the energy received from solar radiation as photons. The caffeine and sucrose were both monodispersed on cotton to gain a high surface area for disposal, allowing collection of the purest CNPs. After 2 h under sunlight, the intense black CNPs were formed on the fabric and were collected without a filter. The CNPs could then be used for various chemical processes, with Mn-GO providing enhanced recovery of CNPs from the biomass of tea. Such a method could potentially even be used to dispose infectious medical biomass in place of incinerators (Fig. 34a–c).
 |
| | Fig. 34 Degradation of tea contents with aq-GO in sunlight. | |
Conclusions
The 48![[thin space (1/6-em)]](https://www.rsc.org/images/entities/char_2009.gif) 134.19 g mol−1 of GO determined at 298.15 K is comparable to the value of Mv at 288.15 K and 308.15 K. Using Mv at these temperatures, we have calculated the molar properties to determine the molar activities of aq-GO. Molar properties determine molar activities with a = γm. The Mv provides calculated, apparent, and limiting molar volumes (V0GO)G
134.19 g mol−1 of GO determined at 298.15 K is comparable to the value of Mv at 288.15 K and 308.15 K. Using Mv at these temperatures, we have calculated the molar properties to determine the molar activities of aq-GO. Molar properties determine molar activities with a = γm. The Mv provides calculated, apparent, and limiting molar volumes (V0GO)G![[O with combining right harpoon above (vector)]](https://www.rsc.org/images/entities/char_004f_20d1.gif) 0, enthalpy, entropy, viscosity, surface tension, friccohesity, fractional volume and isentropic compressibility. These values infer the integrity of GO sheets of 48
0, enthalpy, entropy, viscosity, surface tension, friccohesity, fractional volume and isentropic compressibility. These values infer the integrity of GO sheets of 48![[thin space (1/6-em)]](https://www.rsc.org/images/entities/char_2009.gif) 134.19 g mol−1 Mv: we studied the potential impact of 0.002–0.012 g% aq-GO undergoing aggregation, coalescence, nanoclustering and coagulation in a capillary flow. GO was then doped with Fe2+, Mn2+, Ni2+ or Cr3+ (TMI) under sunlight for ∼30–90 min. TMI-GO can reduce MB and enhance PCR to 99.14% compared to 88% by GO alone. Each TMI reduces the GO bandgap and generates conductance, except for Fe-GO. The bandgap for GO, Cr-GO, Mn-GO, Fe-GO, and Ni-GO are 4.29, 3.87, 2.12, 4.47 and 3.00 eV, respectively. The metal-doped graphene framework was 1.58, 30.57, 3.30 and 27.53 mg L−1 for Cr-GO, Mn-GO, Fe-GO and Ni-GO, respectively, as analysed by ICP-OES. The [η] values at 288.15 and 308.15 K have produced 46
134.19 g mol−1 Mv: we studied the potential impact of 0.002–0.012 g% aq-GO undergoing aggregation, coalescence, nanoclustering and coagulation in a capillary flow. GO was then doped with Fe2+, Mn2+, Ni2+ or Cr3+ (TMI) under sunlight for ∼30–90 min. TMI-GO can reduce MB and enhance PCR to 99.14% compared to 88% by GO alone. Each TMI reduces the GO bandgap and generates conductance, except for Fe-GO. The bandgap for GO, Cr-GO, Mn-GO, Fe-GO, and Ni-GO are 4.29, 3.87, 2.12, 4.47 and 3.00 eV, respectively. The metal-doped graphene framework was 1.58, 30.57, 3.30 and 27.53 mg L−1 for Cr-GO, Mn-GO, Fe-GO and Ni-GO, respectively, as analysed by ICP-OES. The [η] values at 288.15 and 308.15 K have produced 46![[thin space (1/6-em)]](https://www.rsc.org/images/entities/char_2009.gif) 886.03 and 42
886.03 and 42![[thin space (1/6-em)]](https://www.rsc.org/images/entities/char_2009.gif) 845.25 g mol−1, respectively; with an average
845.25 g mol−1, respectively; with an average ![[M with combining macron]](https://www.rsc.org/images/entities/i_char_004d_0304.gif) v 45
v 45![[thin space (1/6-em)]](https://www.rsc.org/images/entities/char_2009.gif) 955.16 g mol−1 which is 4.53% lower compared to 48
955.16 g mol−1 which is 4.53% lower compared to 48![[thin space (1/6-em)]](https://www.rsc.org/images/entities/char_2009.gif) 134.19 g mol−1 at 298.15. The calculation of the C atoms number of 4011, 688 hexagonal sheets, 222 π-conjugations, and 4011 FE is possible from the determined Mv. These are critical operators for photocatalysis and directly affect photon acceptance and hole generation. Thereby, such intrinsic data determination is not possible using only g%.
134.19 g mol−1 at 298.15. The calculation of the C atoms number of 4011, 688 hexagonal sheets, 222 π-conjugations, and 4011 FE is possible from the determined Mv. These are critical operators for photocatalysis and directly affect photon acceptance and hole generation. Thereby, such intrinsic data determination is not possible using only g%.
Appendix
Table 13 The secondary parameters of aq-GO at 288.15 Ka
| Conc. (g% w/v) |
σ (10−2) |
ϕ (10−3) |
KSϕ (10−7) |
Vϕ (104) |
| σ = friccohesity (scm−1), ϕ = fractional volume (cm3), KSϕ = isentropic compressibility (10−1 cm s2), Vϕ = apparent volume (cm3). |
| 0.002 |
1.500 |
2.83 |
4.65388 |
4.81778 |
| 0.004 |
1.508 |
5.13 |
4.65371 |
4.81773 |
| 0.006 |
1.514 |
6.66 |
4.65293 |
4.81772 |
| 0.008 |
1.535 |
12.50 |
4.65364 |
4.81766 |
| 0.010 |
1.550 |
16.30 |
4.65283 |
4.81762 |
| 0.012 |
1.439 |
13.40 |
4.65217 |
4.81759 |
Table 14 The secondary parameters of aq-GO at 298.15 K
| Conc. (g% w/v) |
σ (10−2) |
ϕ (10−3) |
KSϕ (10−7) |
Vϕ (104) |
| 0.002 |
1.217 |
−2.42 |
4.47656 |
4.82765 |
| 0.004 |
1.173 |
−0.36 |
4.47587 |
4.82760 |
| 0.006 |
1.215 |
2.25 |
4.47668 |
4.82757 |
| 0.008 |
1.168 |
3.53 |
4.47567 |
4.82751 |
| 0.010 |
1.145 |
4.35 |
4.47671 |
4.82746 |
| 0.012 |
1.149 |
5.74 |
4.47560 |
4.82743 |
Table 15 The secondary parameters of aq-GO at 308.15 K
| Conc. (g% w/v) |
σ (10−2) |
ϕ (10−3) |
KSϕ (10−7) |
Vϕ (104) |
| 0.002 |
0.998 |
2.33 |
4.35555 |
4.842230 |
| 0.004 |
1.002 |
4.05 |
4.35577 |
4.842119 |
| 0.006 |
1.004 |
4.76 |
4.35543 |
4.842141 |
| 0.008 |
1.001 |
3.73 |
4.35547 |
4.842045 |
| 0.010 |
1.014 |
8.76 |
4.35540 |
4.842042 |
| 0.012 |
1.016 |
9.76 |
4.35529 |
4.841974 |
Table 16 Molar parameters of GO at 288.15 Ka
| Molality (10−6) |
ηm (106) |
γm (107) |
σm (104) |
ρm (106) |
ϕm (103) |
KSϕm |
Vϕm (104) |
μm (109) |
| Symbol: ηm = molar viscosity (mPa s mol−1), γm = molar surface tension (mN m−1 mol−1), σm = molar friccohesity (scm−1 mol−1), ρm = molar density (g cm−3 mol−1), ϕm = molar fractional volume (cm3 mol−1) KSϕm = molar isentropic compressibility (10−1 cm s2 mol−1), μm = molar sound velocity (ms−1 mol−1), Vϕm = apparent molar volume (cm3 mol−1). |
| 0.41654 |
2.7502 |
18.34 |
3.6002 |
2.398565 |
6.7832 |
1.1173 |
3.13 |
3.5208 |
| 0.83329 |
1.3826 |
9.17 |
1.8099 |
1.198979 |
6.1514 |
0.5585 |
2.89 |
1.7600 |
| 1.25003 |
0.9251 |
6.11 |
1.2111 |
0.799257 |
5.3282 |
0.3722 |
3.21 |
1.1733 |
| 1.66682 |
0.7037 |
4.58 |
0.9212 |
0.599410 |
7.4837 |
0.2792 |
2.95 |
0.8799 |
| 2.08360 |
0.5682 |
3.67 |
0.7438 |
0.479515 |
7.8266 |
0.2233 |
2.89 |
0.7039 |
| 2.49852 |
0.4705 |
3.06 |
0.6159 |
0.399886 |
5.3663 |
0.1862 |
2.97 |
0.5871 |
Table 17 Molar parameters of GO at 298.15 K
| Molality (10−6) |
ηm (106) |
γm (107) |
σm (104) |
ρm (106) |
ϕm (103) |
KSϕm |
Vϕm (104) |
μm (109) |
| 0.41654 |
2.1247 |
17.45 |
2.9226 |
2.393670 |
−5.8175 |
1.0747 |
3.8617 |
3.5935 |
| 0.83329 |
1.0676 |
9.10 |
1.4082 |
1.196531 |
−0.4322 |
0.5371 |
3.3790 |
1.7964 |
| 1.25003 |
0.7163 |
5.90 |
0.9718 |
0.797626 |
1.7971 |
0.3581 |
3.3791 |
1.1974 |
| 1.66682 |
0.5389 |
4.61 |
0.7007 |
0.598188 |
2.1152 |
0.2685 |
3.0171 |
0.8981 |
| 2.08360 |
0.4320 |
3.77 |
0.5494 |
0.478538 |
2.0857 |
0.2149 |
2.9447 |
0.7184 |
| 2.49852 |
0.3615 |
3.15 |
0.4598 |
0.399071 |
2.2974 |
0.1791 |
3.0158 |
0.5991 |
Table 18 Molar parameters of GO at 308.15 K
| Molality (10−6) |
ηm (106) |
γm (108) |
σm (104) |
ρm (106) |
ϕm (103) |
KSϕm |
Vϕm (104) |
μm (109) |
| 0.41654 |
1.7364 |
1.74 |
2.3955 |
2.386465 |
5.5936 |
1.0457 |
4.1134 |
3.6486 |
| 0.83329 |
0.8717 |
0.87 |
1.2025 |
1.192939 |
4.8544 |
0.5227 |
2.5347 |
1.8237 |
| 1.25003 |
0.5821 |
0.58 |
0.8030 |
0.795226 |
3.8103 |
0.3484 |
3.3849 |
1.2158 |
| 1.66682 |
0.4355 |
0.44 |
0.6007 |
0.596392 |
2.2402 |
0.2613 |
2.7171 |
0.9118 |
| 2.08360 |
0.3527 |
0.35 |
0.4865 |
0.477097 |
4.2021 |
0.2090 |
3.0450 |
0.7294 |
| 2.49852 |
0.2948 |
0.29 |
0.4067 |
0.397872 |
3.9058 |
0.1743 |
2.8169 |
0.6083 |
Author contributions
Krishan Kumar has conducted the bench work, calculations, plotting figures and other designing for effective discussion and conclusive. Riddhi P. Dave has conducted the bench work, calculations, plotting figures and other designing for effective discussion and conclusive. Sachin Dev has discussed the systems to be taken up for research work for designing effective discussion. Prof. Man Singh is over supervision for conducting the research work, frequent discussions, exploring new models outer experiment observations and matching with the explored scientific exhalations to substantially create the new science out of the research.
Conflicts of interest
The authors confirm that there is no conflict of interest.
Acknowledgements
The authors are thankful to the Central University of Gujarat, India, for facilities, the National Forensic Science University, India, for FT-IR analysis. Krishan Kumar and Riddhi P. Dave are thankful to Kuldeep Delu and Dr C. P. Bhasin for support.
References
- T. A. Saleh, Protocols for synthesis of nanomaterials, polymers, and green materials as adsorbents for water treatment technologies, Environ. Technol. Innovation, 2021, 24, 101821 CrossRef CAS.
- S. S. Maktedar, G. Avashthi and M. Singh, Ultrasound assisted simultaneous reduction and direct functionalization of graphene oxide with thermal and cytotoxicity profile, Ultrason. Sonochem., 2017, 34, 856–864 CrossRef CAS PubMed.
- A. Chandra, P. Malik, S. Singh, A. Roy, N. Sahoo and M. Singh, Sustainable research methodology for potassium nitrate recovery from seawater, Chem. Eng. Process., 2022, 174, 108870 CrossRef CAS.
- S. Dev and M. Singh, Metallic sulfide nanoparticles anchored graphene oxide: Synthesis, characterization and reduction of methylene blue to leuco methylene blue in aqueous mixtures, J. Phys. Chem. Solids, 2020, 139, 109335 CrossRef CAS.
- R. Kumari and M. Singh, Photocatalytic reduction of fluorescent dyes in sunlight by newly synthesized spiroindenoquinoxaline pyrrolizidines, ACS Omega, 2020, 5, 23201–23218 CrossRef CAS PubMed.
- G. Avashthi and M. Singh, Ultrasound accelerated near-edge functionalized heterogeneous graphene oxide sonocatalyst for surface optical bandwidth efficacy and in situ sonothermocatalysis, New J. Chem., 2021, 45, 5463–5483 RSC.
- L. Utracki and R. Simha, Molecular weight and temperature dependence of intrinsic viscosities in very poor solvents, J. Phys. Chem., 1963, 67, 1056–1061 CrossRef CAS.
- M. P. J. Dohmen, A. M. Pereira, J. M. K. Timmer, N. E. Benes and J. T. F. Keurentjes, Hydrodynamic Radii of Polyethylene Glycols in Different Solvents Determined from Viscosity Measurements, J. Chem. Eng. Data, 2008, 53, 63–65 CrossRef CAS.
- R. Sadeghi and M. T. Zafarani-Moattar, Thermodynamics of aqueous solutions of polyvinylpyrrolidone, J. Chem. Thermodyn., 2004, 36, 665–670 CrossRef CAS.
- K. Ito and T. Ukai, Determination of mark–houwink–sakurada constants for measurements of the molecular weights by gel permeation chromatography i. on the generalization of mathematical procedure, Polym. J., 1986, 18, 593–600 CrossRef CAS.
- M. A. Masuelli, Mark–Houwink Parameters for Aqueous-Soluble Polymers and Biopolymers at Various Temperatures, J. Polym. Biopolym. Phys. Chem., 2014, 2, 37–43 CAS.
- M. S. A. Sher Shah, A. R. Park, K. Zhang, J. H. Park and P. J. Yoo, Green synthesis of biphasic TiO 2-reduced graphene oxide nanocomposites with highly enhanced photocatalytic activity, ACS Appl. Mater. Interfaces, 2012, 4, 3893–3901 CrossRef CAS PubMed.
- R. K. Singh, R. Kumar and D. P. Singh, Graphene oxide: Strategies for synthesis, reduction and frontier applications, RSC Adv., 2016, 6, 64993–65011 RSC.
- Y. Xu, J. Li and W. Huang, Porous graphene oxide prepared on nickel foam by electrophoretic deposition and thermal reduction as high-performance supercapacitor electrodes, Materials, 2017, 10, 936 CrossRef PubMed.
- P. Nemes-Incze, Z. Osváth, K. Kamarás and L. P. Biró, Anomalies in thickness measurements of graphene and few layer graphite crystals by tapping mode atomic force microscopy, Carbon, 2008, 46, 1435–1442 CrossRef CAS.
- A. T. Abdel-Motagaly, W. M. A. El Rouby, S. I. El-Dek, I. M. El-Sherbiny and A. A. Farghali, Fast technique for the purification of as-prepared graphene oxide suspension, Diamond Relat. Mater., 2018, 86, 20–28 CrossRef CAS.
- C. J. Shearer, A. D. Slattery, A. J. Stapleton, J. G. Shapter and C. T. Gibson, Accurate thickness measurement of graphene, Nanotechnology, 2016, 27, 125704 CrossRef PubMed.
- M. Bera, Chandravati, P. Gupta and P. K. Maji, Facile one-pot synthesis of graphene oxide by sonication assisted mechanochemical approach and its surface chemistry, J. Nanosci. Nanotechnol., 2018, 18, 902–912 CrossRef CAS PubMed.
- J. Chen, Y. Li, L. Huang, C. Li and G. Shi, High-yield preparation of graphene oxide from small graphite flakes via an improved Hummers method with a simple purification process, Carbon, 2015, 81, 826–834 CrossRef CAS.
- A. Kaniyoor and S. Ramaprabhu, A Raman spectroscopic investigation of graphite oxide
derived graphene, AIP Adv., 2012, 2, 032183 CrossRef.
- M. Singh, and S. Singh, Survismeter: Fundamentals, Concepts, and Applications, 1st edn, Jenny Stanford Publishing, DOI:10.1201/9780429027611, 2019.
- Z. Yang, H. Peng, W. Wang and T. Liu, Crystallization behavior of poly(ε-caprolactone)/layered double hydroxide nanocomposites, J. Appl. Polym. Sci., 2010, 116, 2658–2667 CAS.
- I. Castilla-Cortázar, A. Vidaurre, B. Marí and A. J. Campillo-Fernández, Morphology, crystallinity, and molecular weight of poly(ε-caprolactone)/graphene oxide hybrids, Polymers, 2019, 11, 1099 CrossRef PubMed.
- M. Singh, Survismeter - Type I and II for surface tension, viscosity measurements of liquids for academic, and research and development studies, J. Biochem. Biophys. Methods, 2006, 67, 151–161 CrossRef CAS PubMed.
- G. Avashthi, S. S. Maktedar and M. Singh, Surface-Induced in Situ Sonothermodynamically Controlled Functionalized Graphene Oxide for in vitro Cytotoxicity and Antioxidant Evaluations, ACS Omega, 2019, 4, 16385–16401 CrossRef CAS PubMed.
- S. R. Pandya and M. Singh, Dispersion and optical activities of newly synthesized magnetic nanoparticles with organic acids and dendrimers in DMSO studied with UV/vis spectrophotometry, J. Mol. Liq., 2015, 211, 146–156 CrossRef CAS.
- Y. Liu, B. Chen, D. Wang, N. Jiang, J. Tan, J. Fu, B. Wu, Y. Hu and Z. Guo, Surface tension of supercooled graphene oxide nanofluids measured with acoustic levitation, J. Therm. Anal. Calorim., 2021, 144, 1369–1379 CrossRef CAS.
- D. Cabaleiro, P. Estellé, H. Navas, A. Desforges and B. Vigolo, Dynamic viscosity and surface tension of stable graphene oxide and reduced graphene oxide aqueous nanofluids, J. Nanofluids, 2018, 7, 1081–1088 CrossRef.
- S. U. Ilyas, S. Ridha and F. A. Abdul Kareem, Dispersion stability and surface tension of SDS-Stabilized saline nanofluids with graphene nanoplatelets, Colloids Surf., A, 2020, 592, 124584 CrossRef CAS.
- A. Kujawska, R. Mulka, S. Hamze, G. Żyła, B. Zajaczkowski, M. H. Buschmann and P. Estellé, The effect of boiling in a thermosyphon on surface tension and contact angle of silica and graphene oxide nanofluids, Colloids Surf., A, 2021, 627, 127082 CrossRef CAS.
- S. S. Maktedar, P. Malik, G. Avashthi and M. Singh, Dispersion enhancing effect of sonochemically functionalized graphene oxide for catalysing antioxidant efficacy of curcumin, Ultrason. Sonochem., 2017, 39, 208–217 CrossRef CAS PubMed.
- R. Kamatchi, S. Venkatachalapathy and B. A. Srinivas, International Journal of Thermal Sciences Synthesis , stability , transport properties , and surface wettability of reduced graphene oxide/water nano fl uids, Int. J. Therm. Sci., 2015, 97, 17–25 CrossRef CAS.
- H. Karami, S. Papari-Zare, M. Shanbedi, H. Eshghi, A. Dashtbozorg, A. Akbari, E. Mohammadian, M. Heidari, A. Z. Sahin and C. B. Teng, The thermophysical properties and the stability of nanofluids containing carboxyl-functionalized graphene nano-platelets and multi-walled carbon nanotubes, Int. Commun. Heat Mass Transfer, 2019, 108, 104302 CrossRef CAS.
- A. Bakak, M. Lotfi, R. Heyd, A. Ammar and A. Koumina, Viscosity and Rheological Properties of Graphene Nanopowders Nanofluids, Entropy, 2021, 23, 979 CrossRef CAS PubMed.
- F. Jabbari, A. Rajabpour and S. Saedodin, Viscosity of carbon nanotube/water nanofluid: Equilibrium molecular dynamics, J. Therm. Anal. Calorim., 2019, 135, 1787–1796 CrossRef CAS.
- A. Ansón-Casaos, J. C. Ciria, O. Sanahuja-Parejo, S. Víctor-Román, J. M. González-Domínguez, E. García-Bordejé, A. M. Benito and W. K. Maser, The viscosity of dilute carbon nanotube (1D) and graphene oxide (2D) nanofluids, Phys. Chem. Chem. Phys., 2020, 22, 11474–11484 RSC.
- D. Cabaleiro, L. Colla, S. Barison, L. Lugo, L. Fedele and S. Bobbo, Heat Transfer Capability of (Ethylene Glycol + Water)-Based Nanofluids Containing Graphene Nanoplatelets: Design and Thermophysical Profile, Nanoscale Res. Lett., 2017, 12 DOI:10.1186/s11671-016-1806-x.
- S. S. Maktedar, P. Malik, G. Avashthi and M. Singh, Dispersion enhancing effect of sonochemically functionalized graphene oxide for catalysing antioxidant efficacy of curcumin, Ultrason. Sonochem., 2017, 39, 208–217 CrossRef CAS PubMed.
- M. Mehrali, E. Sadeghinezhad, A. R. Akhiani, S. Tahan Latibari, H. S. C. Metselaar, A. S. Kherbeet and M. Mehrali, Heat transfer and entropy generation analysis of hybrid graphene/Fe3O4 ferro-nanofluid flow under the influence of a magnetic field, Powder Technol., 2017, 308, 149–157 CrossRef CAS.
- H. Yarmand, S. Gharehkhani, S. F. S. Shirazi, A. Amiri, M. S. Alehashem, M. Dahari and S. N. Kazi, Experimental investigation of thermo-physical properties, convective heat transfer and pressure drop of functionalized graphene nanoplatelets aqueous nanofluid in a square heated pipe, Energy Convers. Manage., 2016, 114, 38–49 CrossRef CAS.
- M. Mehrali, E. Sadeghinezhad, S. T. Latibari, S. N. Kazi, M. Mehrali, M. Nashrul, B. Mohd, H. Simon and C. Metselaar, Investigation of thermal conductivity and rheological properties of nanofluids containing graphene nanoplatelets, Nanoscale Res. Lett., 2014, 9, 15 CrossRef PubMed.
- A. A. Farajian, R. Mortezaee, T. H. Osborn, O. V. Pupysheva, M. Wang, A. Zhamu and B. Z. Jang, Multiscale molecular thermodynamics of graphene-oxide liquid-phase exfoliation, Phys. Chem. Chem. Phys., 2019, 21, 1761–1772 RSC.
- S. Pandit and M. De, Interaction of Amino Acids and Graphene Interaction of Amino Acids and Graphene Oxide, J. Phys. Chem. C, 2017, 121, 600 CrossRef CAS.
- H. L. Zhang and S. J. Han, Viscosity and density of water + sodium chloride + potassium chloride solutions at 298.15 K, J. Chem. Eng. Data, 1996, 41, 516–520 CrossRef.
- S. S. Maktedar, G. Avashthi and M. Singh, Understanding the significance of O-doped graphene towards biomedical applications, RSC Adv., 2016, 6, 114264–114275 RSC.
- S. S. Maktedar, S. S. Mehetre, G. Avashthi and M. Singh, In situ sonochemical reduction and direct functionalization of graphene oxide: A robust approach with thermal and biomedical applications, Ultrason. Sonochem., 2017, 34, 67–77 CrossRef CAS PubMed.
|
| This journal is © The Royal Society of Chemistry 2022 |
Click here to see how this site uses Cookies. View our privacy policy here.  Open Access Article
 *
*
![[thin space (1/6-em)]](https://www.rsc.org/images/entities/char_2009.gif) 134.19 g mol−1 Mv at 298.15 K, and the apparent molar (Vϕm, cm3 mol−1), limiting molar volumes (V0GO)G
134.19 g mol−1 Mv at 298.15 K, and the apparent molar (Vϕm, cm3 mol−1), limiting molar volumes (V0GO)G![[O with combining right harpoon above (vector)]](https://www.rsc.org/images/entities/char_004f_20d1.gif) 0, enthalpy (ΔHm, J mol−1), entropy (ΔSm, J mol−1 K−1), viscosity (ηm, mPa s mol−1), surface tension (γm, mN m−1 mol−1), friccohesity (σm, scm−1 mol−1), fractional volume (ϕm, cm3 mol−1), isentropic compressibility (Ksϕ,m, 10−4 cm s2 g−1 mol), infer GO molar consistency throughout the chemical processes. Molar properties (MPs) infer a GO monodispersion producing negative electrons (e−) and positive holes (h+) under sunlight. The transition metal ions (Fe2+, Mn2+, Ni2+, Cr3+, TMI) doped onto GO (TMI-GO), can photodegrade methylene blue (MB) in 60 min compared with 120 min using GO alone. The 4011 C atoms, 688 hexagonal sheets, 222 π-conjugations, and 4011 FE were calculated from the 48
0, enthalpy (ΔHm, J mol−1), entropy (ΔSm, J mol−1 K−1), viscosity (ηm, mPa s mol−1), surface tension (γm, mN m−1 mol−1), friccohesity (σm, scm−1 mol−1), fractional volume (ϕm, cm3 mol−1), isentropic compressibility (Ksϕ,m, 10−4 cm s2 g−1 mol), infer GO molar consistency throughout the chemical processes. Molar properties (MPs) infer a GO monodispersion producing negative electrons (e−) and positive holes (h+) under sunlight. The transition metal ions (Fe2+, Mn2+, Ni2+, Cr3+, TMI) doped onto GO (TMI-GO), can photodegrade methylene blue (MB) in 60 min compared with 120 min using GO alone. The 4011 C atoms, 688 hexagonal sheets, 222 π-conjugations, and 4011 FE were calculated from the 48![[thin space (1/6-em)]](https://www.rsc.org/images/entities/char_2009.gif) 134.19 g mol−1. The functional edges are the negative and positive holes generating centres of the GO 2D sheets.
134.19 g mol−1. The functional edges are the negative and positive holes generating centres of the GO 2D sheets.![[thin space (1/6-em)]](https://www.rsc.org/images/entities/char_2009.gif) :
:![[thin space (1/6-em)]](https://www.rsc.org/images/entities/char_2009.gif) 1.5 ratio, this mixture was poured dropwise into 500 mL RB flask containing Gt and KMnO4 in 1
1.5 ratio, this mixture was poured dropwise into 500 mL RB flask containing Gt and KMnO4 in 1![[thin space (1/6-em)]](https://www.rsc.org/images/entities/char_2009.gif) :
:![[thin space (1/6-em)]](https://www.rsc.org/images/entities/char_2009.gif) 6 ratio (9 g) kept on an ice bath. The suspension was kept for 30 min at room temperature (RT) and was refluxed for 12 h at 650 rpm at 55 °C. Ice-cold water and 3 mL H2O2 were mixed in a reaction mixture to cease the reaction.4 The resultant product was centrifuged at 8000 rpm for 10 min and was washed with water and (5%) HCl alternately until the supernatant attained pH 7. The final washing was done with absolute alcohol. AgNO3 and BaCl2 tests ensured the complete removal of NaCl and Na2SO4 after washing. A cake-like brownish sediment was coagulated with petroleum ether and extracted in a Petri dish and dried at 60 °C for 24 h. GtO was exfoliated with minimum water by sonicating @ 28 kHz for 3 h to disrupt ABAB sheet stacking so a brownish GO was obtained (Fig. 1).
6 ratio (9 g) kept on an ice bath. The suspension was kept for 30 min at room temperature (RT) and was refluxed for 12 h at 650 rpm at 55 °C. Ice-cold water and 3 mL H2O2 were mixed in a reaction mixture to cease the reaction.4 The resultant product was centrifuged at 8000 rpm for 10 min and was washed with water and (5%) HCl alternately until the supernatant attained pH 7. The final washing was done with absolute alcohol. AgNO3 and BaCl2 tests ensured the complete removal of NaCl and Na2SO4 after washing. A cake-like brownish sediment was coagulated with petroleum ether and extracted in a Petri dish and dried at 60 °C for 24 h. GtO was exfoliated with minimum water by sonicating @ 28 kHz for 3 h to disrupt ABAB sheet stacking so a brownish GO was obtained (Fig. 1).
![[thin space (1/6-em)]](https://www.rsc.org/images/entities/char_2009.gif) :
:![[thin space (1/6-em)]](https://www.rsc.org/images/entities/char_2009.gif) 4 ratio in a glass tube kept in sunlight for 90 min. The resultant material is noted as the TMI-GO template which settled at the bottom. The template was washed with water 2–3 times to remove unused TMI and GO. The AgNO3 test ensured the complete removal of Cl− ions. The TMI-GO was dried in a vacuum oven for 3 h at 50 °C to produce the powder form for use in the MB photodegradation.
4 ratio in a glass tube kept in sunlight for 90 min. The resultant material is noted as the TMI-GO template which settled at the bottom. The template was washed with water 2–3 times to remove unused TMI and GO. The AgNO3 test ensured the complete removal of Cl− ions. The TMI-GO was dried in a vacuum oven for 3 h at 50 °C to produce the powder form for use in the MB photodegradation.
![[double bond splayed left]](https://www.rsc.org/images/entities/char_e009.gif) CO, –COOH, –OH). These have almost the same heat capacity generating the ψ in a similar phase to that adsorbed by TMI. The 82% of GO decomposed sharply at 193 °C, unlike the broader curve at 136 °C on removal of adsorbed atmospheric gases and water: the oscillatory activities with similar ψ weaken the covalent bonding of the carbon skeleton. The sharper transitions infer crystalline exfoliated GO sheets with almost the same functional edges, unlike the 18% wt loss from 50 to 136 °C, due to expulsion of the attached water molecules. These water molecules develop a unique rheology without damaging the sheet during fluid dynamics or friccofluidics acting as a shock absorber in regard to a ‘lacey’ GO sheet.
CO, –COOH, –OH). These have almost the same heat capacity generating the ψ in a similar phase to that adsorbed by TMI. The 82% of GO decomposed sharply at 193 °C, unlike the broader curve at 136 °C on removal of adsorbed atmospheric gases and water: the oscillatory activities with similar ψ weaken the covalent bonding of the carbon skeleton. The sharper transitions infer crystalline exfoliated GO sheets with almost the same functional edges, unlike the 18% wt loss from 50 to 136 °C, due to expulsion of the attached water molecules. These water molecules develop a unique rheology without damaging the sheet during fluid dynamics or friccofluidics acting as a shock absorber in regard to a ‘lacey’ GO sheet.
![[double bond splayed left]](https://www.rsc.org/images/entities/char_e009.gif) CO, –CHO, –OH, –O–) oscillate in the same phase. The active sites contribute to disperse water on GO for accurate Mv (Fig. 4).
CO, –CHO, –OH, –O–) oscillate in the same phase. The active sites contribute to disperse water on GO for accurate Mv (Fig. 4).
![[thin space (1/6-em)]](https://www.rsc.org/images/entities/char_2009.gif) :
:![[thin space (1/6-em)]](https://www.rsc.org/images/entities/char_2009.gif) 20 ratio for coating. After coating, a 7 kV beam stimulated the secondary electrons from the GO surface. GO morphology is rough, furrowed multiple layers or ripples with the stronger H-bonding between the multiple successive layers of GO. Fig. 5 shows the pattern of monodispersed lacey GO sheets with a higher surface area. The GO sheets are stacked, however, they seem to be of equal size and dimension, optimized with functional groups at specific stretching frequencies.
20 ratio for coating. After coating, a 7 kV beam stimulated the secondary electrons from the GO surface. GO morphology is rough, furrowed multiple layers or ripples with the stronger H-bonding between the multiple successive layers of GO. Fig. 5 shows the pattern of monodispersed lacey GO sheets with a higher surface area. The GO sheets are stacked, however, they seem to be of equal size and dimension, optimized with functional groups at specific stretching frequencies.
![[double bond splayed left]](https://www.rsc.org/images/entities/char_e009.gif) CO, –COOH, –OH increases (Fig. 5). The stretching frequencies of –COOH,
CO, –COOH, –OH increases (Fig. 5). The stretching frequencies of –COOH, ![[double bond splayed left]](https://www.rsc.org/images/entities/char_e009.gif) CO, –CHO, –OH, –O– at wavenumber (
CO, –CHO, –OH, –O– at wavenumber (![[small nu, Greek, macron]](https://www.rsc.org/images/entities/i_char_e0ce.gif) )6,12 and their transmittance bands, infer bond energies.13 The broad peak at 3351 cm−1 is due to the –OH of water bonding on the GO surface. The –O–, –CHO,
)6,12 and their transmittance bands, infer bond energies.13 The broad peak at 3351 cm−1 is due to the –OH of water bonding on the GO surface. The –O–, –CHO, ![[double bond splayed left]](https://www.rsc.org/images/entities/char_e009.gif) CO, –COOH, –OH give IR bands at 1071, 1400, 1250, 1750, 1626 cm−1, respectively (Fig. 6).12,14 The symmetric stretching alignment with stable dipoles and higher polarizability which stack to develop the topographic surface, are illustrated with Raman spectroscopy and AFM.
CO, –COOH, –OH give IR bands at 1071, 1400, 1250, 1750, 1626 cm−1, respectively (Fig. 6).12,14 The symmetric stretching alignment with stable dipoles and higher polarizability which stack to develop the topographic surface, are illustrated with Raman spectroscopy and AFM.


![[thin space (1/6-em)]](https://www.rsc.org/images/entities/char_2009.gif) η vs. 1/c in Fig. 13
η vs. 1/c in Fig. 13
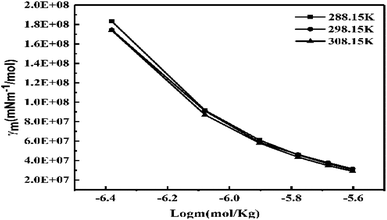
![[thin space (1/6-em)]](https://www.rsc.org/images/entities/char_2009.gif) m to see the molar surface excess concentration and calculate the surface area of aq-GO.
m to see the molar surface excess concentration and calculate the surface area of aq-GO.![[thin space (1/6-em)]](https://www.rsc.org/images/entities/char_2009.gif) k + a
k + a![[thin space (1/6-em)]](https://www.rsc.org/images/entities/char_2009.gif) log
log![[thin space (1/6-em)]](https://www.rsc.org/images/entities/char_2009.gif) M
M

![[thin space (1/6-em)]](https://www.rsc.org/images/entities/char_2009.gif) 648
648![[thin space (1/6-em)]](https://www.rsc.org/images/entities/char_2009.gif) 656
656![[thin space (1/6-em)]](https://www.rsc.org/images/entities/char_2009.gif) 651
651![[thin space (1/6-em)]](https://www.rsc.org/images/entities/char_2009.gif) 656
656![[thin space (1/6-em)]](https://www.rsc.org/images/entities/char_2009.gif) 649
649![[thin space (1/6-em)]](https://www.rsc.org/images/entities/char_2009.gif) 655
655![[thin space (1/6-em)]](https://www.rsc.org/images/entities/char_2009.gif) 106.88
106.88![[thin space (1/6-em)]](https://www.rsc.org/images/entities/char_2009.gif) 167.84
167.84![[thin space (1/6-em)]](https://www.rsc.org/images/entities/char_2009.gif) 289.75
289.75![[thin space (1/6-em)]](https://www.rsc.org/images/entities/char_2009.gif) 411.66
411.66![[thin space (1/6-em)]](https://www.rsc.org/images/entities/char_2009.gif) 472.61
472.61![[thin space (1/6-em)]](https://www.rsc.org/images/entities/char_2009.gif) c with eqn (2.1),
c with eqn (2.1),
![[thin space (1/6-em)]](https://www.rsc.org/images/entities/char_2009.gif) 886.03
886.03![[thin space (1/6-em)]](https://www.rsc.org/images/entities/char_2009.gif) 134.19
134.19![[thin space (1/6-em)]](https://www.rsc.org/images/entities/char_2009.gif) 845.25
845.25


![[thin space (1/6-em)]](https://www.rsc.org/images/entities/char_2009.gif) 134.19 g mol−1
134.19 g mol−1


![[thin space (1/6-em)]](https://www.rsc.org/images/entities/char_2009.gif) M, the higher viscosity values at 298.15 K decrease with Mv unlike at 288.15 and 308.15 K. The viscosity values for aq-PVP at higher concentration are the same with almost a similar response at each temperature, this infers the presence of similar adhesive forces (Fig. 18 and Table 9). The GO has weakened the cohesive forces and strengthened the adhesive forces of H2O as shown in the ηsp/C vs. temperature plots at 288.15 and 308.15 K (ESI Fig. 3.9†), which are close but differ at 298.15 K for 0.002–0.004 g%: the concentrations used produced closely placed [η] values at 288.15 and 308.15 K, unlike 298.15 K due to a thermal alignment.
M, the higher viscosity values at 298.15 K decrease with Mv unlike at 288.15 and 308.15 K. The viscosity values for aq-PVP at higher concentration are the same with almost a similar response at each temperature, this infers the presence of similar adhesive forces (Fig. 18 and Table 9). The GO has weakened the cohesive forces and strengthened the adhesive forces of H2O as shown in the ηsp/C vs. temperature plots at 288.15 and 308.15 K (ESI Fig. 3.9†), which are close but differ at 298.15 K for 0.002–0.004 g%: the concentrations used produced closely placed [η] values at 288.15 and 308.15 K, unlike 298.15 K due to a thermal alignment.
![[thin space (1/6-em)]](https://www.rsc.org/images/entities/char_2009.gif) M of (Fig. 18)
M of (Fig. 18)
 infers a molar shift in interaction of edges and dipoles as a sensitive PCR vs. concentration dependence of the PCR sensor. The oscillatory arrays at 298.15 K equilibrate the interaction of the functional edges and electrostatic dipole monomer H2O via cohad ↔ cohesive ± adhesive (ESI Fig. 3.9†). The γ values decrease on increasing concentration and temperature, both weakening the cohesive forces unlike the 0.012 g% at 288.15 and 308.15 K (ESI Fig. 1.0a and b†). Results from lower density at 308.15 K compared to 288.15 and 298.15 K, infer the weaker interaction of the edges and dipolar oscillation unlike a lower thermal energy. The closely placed density values infer the GO-FE-ED-H2O template, as the interaction of edges and dipoles maintain similar adhesive forces on increasing temperature. The reproducibility of density values show the stability without clustering, due to the interaction of functional edges and electrostatic dipoles. The wavefunction of functional edges and electrostatic dipoles behave as a simple harmonic oscillator by transferring the energy at three temperatures (ESI Fig. 1.1†).
![[thin space (1/6-em)]](https://www.rsc.org/images/entities/char_2009.gif) c (Fig. 19)
c (Fig. 19)
![[thin space (1/6-em)]](https://www.rsc.org/images/entities/char_2009.gif) η vs. 1/c decrease on decreasing GO concentration due to the stronger activity (Fig. 13, Table 3). However, on decreasing the GO concentration, the slope values decreased due to a mild effect on the surface energy.
η vs. 1/c decrease on decreasing GO concentration due to the stronger activity (Fig. 13, Table 3). However, on decreasing the GO concentration, the slope values decreased due to a mild effect on the surface energy.
![[thin space (1/6-em)]](https://www.rsc.org/images/entities/char_2009.gif) 655 + 12.191T), closely agreeing with the experimental values. The V0GO is theoretically calculated using the values of the regression constants at 283.15 and 313.15 K which have the same order as experimental results (Fig. 16 and Table 5).
655 + 12.191T), closely agreeing with the experimental values. The V0GO is theoretically calculated using the values of the regression constants at 283.15 and 313.15 K which have the same order as experimental results (Fig. 16 and Table 5).
![[thin space (1/6-em)]](https://www.rsc.org/images/entities/char_2009.gif) ηm vs. 1/m allows the calculation of Ea from the slope, and we can see the log
ηm vs. 1/m allows the calculation of Ea from the slope, and we can see the log![[thin space (1/6-em)]](https://www.rsc.org/images/entities/char_2009.gif) ηm value decreases with increasing GO moles (Fig. 14, Table 4). The γm vs. log
ηm value decreases with increasing GO moles (Fig. 14, Table 4). The γm vs. log![[thin space (1/6-em)]](https://www.rsc.org/images/entities/char_2009.gif) m allows the determination of surface area from the slope value (Fig. 15, Table 6). The [η] infers interaction of the edges and dipoles of monodisperse GO during the redox cycles (Fig. 17).
m allows the determination of surface area from the slope value (Fig. 15, Table 6). The [η] infers interaction of the edges and dipoles of monodisperse GO during the redox cycles (Fig. 17).![[thin space (1/6-em)]](https://www.rsc.org/images/entities/char_2009.gif) :
:![[thin space (1/6-em)]](https://www.rsc.org/images/entities/char_2009.gif) 1 ratio affecting aq-GO fluid dynamics (eqn (3.2)).
1 ratio affecting aq-GO fluid dynamics (eqn (3.2)). 

![[thin space (1/6-em)]](https://www.rsc.org/images/entities/char_2009.gif) 000 to 54
000 to 54![[thin space (1/6-em)]](https://www.rsc.org/images/entities/char_2009.gif) 000 g mol−1, could not distinguish a decisive distribution and so failed to produce a mol. wt. (ESI, Fig. 3.6†). LC-MS also failed as unfragmented GO did not respond to a quadrupolar magnet, the GO sheet reoriented, so a survismeter method was used to determine Mv. The wavefunction increases on rising temperature, but at m → 0, the sheets are separated. The wavefunction infers the H2O acts as a sheath between the GO sheets. The electrostatic stabilisation of the H2O as a barrier could not pass the oscillating motions from one GO sheet to another despite 2D spreading. These deviations in volume depict the lowest distance between the functional edges and electrostatic dipoles. The ions were activated but the Hδ+ were covalently bonded with the H2O, and it was difficult to disrupt the covalent bonds compared to counterbalancing the ions. The salts dissociated, where the Hδ+ activated the GO for the redox cycle without acquiring much activation energy. The studies are prerequisites to explain Φ. The coefficient [η]/[V0]m→0 infers alignment of the functional edges and electrostatic dipoles to functionalize the GO with TMI and to photodegrade the dyes depending on concentration. The aq-GO sheet with functional edges and electrostatic dipoles interacting, has a higher relaxation time within a capillary unlike the pendant drop method that has free area available for cohad forces: so no relaxation time is required for the pendant drop number. The GO develops the 1
000 g mol−1, could not distinguish a decisive distribution and so failed to produce a mol. wt. (ESI, Fig. 3.6†). LC-MS also failed as unfragmented GO did not respond to a quadrupolar magnet, the GO sheet reoriented, so a survismeter method was used to determine Mv. The wavefunction increases on rising temperature, but at m → 0, the sheets are separated. The wavefunction infers the H2O acts as a sheath between the GO sheets. The electrostatic stabilisation of the H2O as a barrier could not pass the oscillating motions from one GO sheet to another despite 2D spreading. These deviations in volume depict the lowest distance between the functional edges and electrostatic dipoles. The ions were activated but the Hδ+ were covalently bonded with the H2O, and it was difficult to disrupt the covalent bonds compared to counterbalancing the ions. The salts dissociated, where the Hδ+ activated the GO for the redox cycle without acquiring much activation energy. The studies are prerequisites to explain Φ. The coefficient [η]/[V0]m→0 infers alignment of the functional edges and electrostatic dipoles to functionalize the GO with TMI and to photodegrade the dyes depending on concentration. The aq-GO sheet with functional edges and electrostatic dipoles interacting, has a higher relaxation time within a capillary unlike the pendant drop method that has free area available for cohad forces: so no relaxation time is required for the pendant drop number. The GO develops the 1![[thin space (1/6-em)]](https://www.rsc.org/images/entities/char_2009.gif) :
:![[thin space (1/6-em)]](https://www.rsc.org/images/entities/char_2009.gif) 1 redox cycles, despite being restricted to the original state of C atoms in GO, and its size multiplying the holes. So a NaCl → Na+ + Cl (1
1 redox cycles, despite being restricted to the original state of C atoms in GO, and its size multiplying the holes. So a NaCl → Na+ + Cl (1![[thin space (1/6-em)]](https://www.rsc.org/images/entities/char_2009.gif) :
:![[thin space (1/6-em)]](https://www.rsc.org/images/entities/char_2009.gif) 1) electrolyte was chosen vis-á-vis GO laminar sheet arrays.
1) electrolyte was chosen vis-á-vis GO laminar sheet arrays.

![[thin space (1/6-em)]](https://www.rsc.org/images/entities/char_2009.gif) 906.2
906.2![[thin space (1/6-em)]](https://www.rsc.org/images/entities/char_2009.gif) 539.7
539.7![[thin space (1/6-em)]](https://www.rsc.org/images/entities/char_2009.gif) 206.2
206.2![[double bond splayed left]](https://www.rsc.org/images/entities/char_e009.gif) CO, differing in their binding energies. The XPS of C 1s of Mn-GO and Ni-GO at 284, 284.8, and 287.1 eV, infer the activities of the sp2 C atom, –C–C and –COOH, respectively, due to electron clouds of the adjoining atoms (Fig. 25b). XPS spectra of O 1s of Mn–GO and Ni–GO at 530.87, 531.7, and 533.48 eV for C–OH, C–O–C and C
CO, differing in their binding energies. The XPS of C 1s of Mn-GO and Ni-GO at 284, 284.8, and 287.1 eV, infer the activities of the sp2 C atom, –C–C and –COOH, respectively, due to electron clouds of the adjoining atoms (Fig. 25b). XPS spectra of O 1s of Mn–GO and Ni–GO at 530.87, 531.7, and 533.48 eV for C–OH, C–O–C and C![[double bond, length as m-dash]](https://www.rsc.org/images/entities/char_e001.gif) O respectively depict their binding stabilities (Fig. 25c). The binding of C atoms with oxygen creates a gradient among C atoms of GO with a spontaneity to make GO receptive to respond to the TMI-GO. The binding energies are 853.2 and 870.6 eV for Ni 2p3/2 and Ni 2p1/2, respectively, along with the similar values of C 1s for C and O 1s for the O atoms (Fig. 25a–c). Similarly, the binding energies, are 641.18 and 653.33 eV for Mn 2p3/2 and Mn 2p1/2, respectively.4 The large energy difference between the Mn 2p and Ni 2p is due to the paired and unpaired electrons. The intensity of the –C
O respectively depict their binding stabilities (Fig. 25c). The binding of C atoms with oxygen creates a gradient among C atoms of GO with a spontaneity to make GO receptive to respond to the TMI-GO. The binding energies are 853.2 and 870.6 eV for Ni 2p3/2 and Ni 2p1/2, respectively, along with the similar values of C 1s for C and O 1s for the O atoms (Fig. 25a–c). Similarly, the binding energies, are 641.18 and 653.33 eV for Mn 2p3/2 and Mn 2p1/2, respectively.4 The large energy difference between the Mn 2p and Ni 2p is due to the paired and unpaired electrons. The intensity of the –C![[double bond, length as m-dash]](https://www.rsc.org/images/entities/char_e001.gif) O and –C–O reduced compared to the C–C, as GO underwent oxidation with different electronic clouds. Excellent hybridization occurs between the C and O atoms. The contribution of energy from the O 1s electron in the C skeleton, with the 1 s electron of the metal, is strong with a nucleus forming the skeleton of the GO sheets. The sharp peak of GO disappeared on binding of the TMI. The ψTMI = ψFE oscillations of half-filled 3d e− of Mn (4s23d5) approached the conduction band of the 4p orbital and conduction band of the GO. The valence band of TMI could approach the conduction band of GO. The unengaged lattices of the 2D GO sheets provided XRD with maximum intensity. Upon doping, the electronic clouds of the functional edges were engaged by the TMI; so the sharp peak of GO at 2θ = 8.85° was lost (ESI Fig. 4.3†).
O and –C–O reduced compared to the C–C, as GO underwent oxidation with different electronic clouds. Excellent hybridization occurs between the C and O atoms. The contribution of energy from the O 1s electron in the C skeleton, with the 1 s electron of the metal, is strong with a nucleus forming the skeleton of the GO sheets. The sharp peak of GO disappeared on binding of the TMI. The ψTMI = ψFE oscillations of half-filled 3d e− of Mn (4s23d5) approached the conduction band of the 4p orbital and conduction band of the GO. The valence band of TMI could approach the conduction band of GO. The unengaged lattices of the 2D GO sheets provided XRD with maximum intensity. Upon doping, the electronic clouds of the functional edges were engaged by the TMI; so the sharp peak of GO at 2θ = 8.85° was lost (ESI Fig. 4.3†).

![[thin space (1/6-em)]](https://www.rsc.org/images/entities/char_2009.gif) :
:![[thin space (1/6-em)]](https://www.rsc.org/images/entities/char_2009.gif) MB
MB


![[thin space (1/6-em)]](https://www.rsc.org/images/entities/char_2009.gif) 134.19 g mol−1 of GO determined at 298.15 K is comparable to the value of Mv at 288.15 K and 308.15 K. Using Mv at these temperatures, we have calculated the molar properties to determine the molar activities of aq-GO. Molar properties determine molar activities with a = γm. The Mv provides calculated, apparent, and limiting molar volumes (V0GO)G
134.19 g mol−1 of GO determined at 298.15 K is comparable to the value of Mv at 288.15 K and 308.15 K. Using Mv at these temperatures, we have calculated the molar properties to determine the molar activities of aq-GO. Molar properties determine molar activities with a = γm. The Mv provides calculated, apparent, and limiting molar volumes (V0GO)G![[O with combining right harpoon above (vector)]](https://www.rsc.org/images/entities/char_004f_20d1.gif) 0, enthalpy, entropy, viscosity, surface tension, friccohesity, fractional volume and isentropic compressibility. These values infer the integrity of GO sheets of 48
0, enthalpy, entropy, viscosity, surface tension, friccohesity, fractional volume and isentropic compressibility. These values infer the integrity of GO sheets of 48![[thin space (1/6-em)]](https://www.rsc.org/images/entities/char_2009.gif) 134.19 g mol−1 Mv: we studied the potential impact of 0.002–0.012 g% aq-GO undergoing aggregation, coalescence, nanoclustering and coagulation in a capillary flow. GO was then doped with Fe2+, Mn2+, Ni2+ or Cr3+ (TMI) under sunlight for ∼30–90 min. TMI-GO can reduce MB and enhance PCR to 99.14% compared to 88% by GO alone. Each TMI reduces the GO bandgap and generates conductance, except for Fe-GO. The bandgap for GO, Cr-GO, Mn-GO, Fe-GO, and Ni-GO are 4.29, 3.87, 2.12, 4.47 and 3.00 eV, respectively. The metal-doped graphene framework was 1.58, 30.57, 3.30 and 27.53 mg L−1 for Cr-GO, Mn-GO, Fe-GO and Ni-GO, respectively, as analysed by ICP-OES. The [η] values at 288.15 and 308.15 K have produced 46
134.19 g mol−1 Mv: we studied the potential impact of 0.002–0.012 g% aq-GO undergoing aggregation, coalescence, nanoclustering and coagulation in a capillary flow. GO was then doped with Fe2+, Mn2+, Ni2+ or Cr3+ (TMI) under sunlight for ∼30–90 min. TMI-GO can reduce MB and enhance PCR to 99.14% compared to 88% by GO alone. Each TMI reduces the GO bandgap and generates conductance, except for Fe-GO. The bandgap for GO, Cr-GO, Mn-GO, Fe-GO, and Ni-GO are 4.29, 3.87, 2.12, 4.47 and 3.00 eV, respectively. The metal-doped graphene framework was 1.58, 30.57, 3.30 and 27.53 mg L−1 for Cr-GO, Mn-GO, Fe-GO and Ni-GO, respectively, as analysed by ICP-OES. The [η] values at 288.15 and 308.15 K have produced 46![[thin space (1/6-em)]](https://www.rsc.org/images/entities/char_2009.gif) 886.03 and 42
886.03 and 42![[thin space (1/6-em)]](https://www.rsc.org/images/entities/char_2009.gif) 845.25 g mol−1, respectively; with an average
845.25 g mol−1, respectively; with an average ![[M with combining macron]](https://www.rsc.org/images/entities/i_char_004d_0304.gif) v 45
v 45![[thin space (1/6-em)]](https://www.rsc.org/images/entities/char_2009.gif) 955.16 g mol−1 which is 4.53% lower compared to 48
955.16 g mol−1 which is 4.53% lower compared to 48![[thin space (1/6-em)]](https://www.rsc.org/images/entities/char_2009.gif) 134.19 g mol−1 at 298.15. The calculation of the C atoms number of 4011, 688 hexagonal sheets, 222 π-conjugations, and 4011 FE is possible from the determined Mv. These are critical operators for photocatalysis and directly affect photon acceptance and hole generation. Thereby, such intrinsic data determination is not possible using only g%.
134.19 g mol−1 at 298.15. The calculation of the C atoms number of 4011, 688 hexagonal sheets, 222 π-conjugations, and 4011 FE is possible from the determined Mv. These are critical operators for photocatalysis and directly affect photon acceptance and hole generation. Thereby, such intrinsic data determination is not possible using only g%.


