DOI:
10.1039/D2RA04635K
(Paper)
RSC Adv., 2022,
12, 28152-28170
Quantitative study of impact damage on yellow peaches based on reflectance, absorbance and Kubelka–Munk spectral data†
Received
25th July 2022
, Accepted 20th September 2022
First published on 3rd October 2022
Abstract
Impact damage is one of the main forms of damage during the postharvest transportation and processing of yellow peaches. Thus, a quantitative prediction of the impact damage degree of yellow peaches is significant for their postharvest grading. In the present study, mechanical parameters such as the damage area, absorbed energy and maximum force were obtained based on a single pendulum collision device and an intelligent data acquisition system. The reflection spectra (R) of the damaged areas of yellow peaches were collected by a hyperspectral imaging system and transformed into absorbance (A) spectra and Kubelka–Munk (K–M) spectra. The R, A and K–M spectra were preprocessed by standard normal variables (SNV), moving average (MA) and Gaussian filtering (GF). Partial least squares regression (PLSR) models and support vector regression (SVR) models based on original and preprocessed spectra were established, respectively. By comparative analysis, the spectral data with better prediction performance (raw or preprocessed spectra) were selected from all spectra, and the characteristic wavelengths were selected by competitive adaptive reweighted sampling (CARS) and uninformative variable elimination (UVE). The PLSR and SVR models based on characteristic wavelengths were established. The results revealed that the prediction performance of the K–M-GF-CARS-PLSR model is the best. For the damage area, absorbed energy and maximum force, the RP2 and RMSEP of the K–M-GF-CARS-PLSR model were 0.870 and 77.865 mm2, 0.772 and 1.065 J, 0.895 and 47.996 N, respectively. Furthermore, the values of their RPD were 2.700, 1.768 and 3.050, respectively. The characteristic wavelengths of the model were 18.8%, 10.2% and 21.6%, respectively. The results of this study showed that there was a strong correlation between the mechanical parameters and K–M spectrum, which demonstrates the feasibility of quantitatively predicting the damage degree of yellow peaches based on the K–M spectrum. Therefore, the results of this work not only provide theoretical guidance for the postharvest grading of fruits, but also enrich the theoretical system of biomechanics.
1. Introduction
Yellow peaches have become an important part of the human dietary structure due to their delicious taste and rich nutrition.1,2 With the continuous improvement of agricultural mechanization, the mechanical damage of yellow peaches usually occurs in the process of picking, transporting and packing.3,4 Damaged yellow peaches are not only more susceptible to rot but also affect other intact yellow peaches, resulting in economic losses.5,6 Mechanical damage mainly includes static pressure damage, vibration damage, puncture damage and impact damage, among which impact damage is the most serious and prone to occur.7 If the damage degree of the fruit can be quantitatively evaluated, the economic losses will be reduced by grading fruit based on their damage degree.8–10
At present, mechanical parameters have become one of the main methods to evaluate the damage degree of fruit. The mechanical parameters that can be used to quantitatively assess the damage degree of fruits mainly include damage area, damage volume, impact energy, absorbed energy, impact acceleration, peak force and maximum stress.11–13 A large number of studies on the mechanical properties of fruit have been reported. An et al.14 investigated the tissue damage mechanism of strawberries by compression tests at different velocities and found that the absorbed energy was a suitable and easily measured mechanical parameter for evaluating the damage degree of strawberries. Wang et al.15 used the modulus of elasticity to characterize the damage degree of litchi, and the effect of impact times and absorbed energy on the damage degree of litchi was investigated. Yeşim et al.16 used electronic fruit (IRD) to simulate impact tests on peaches, which recorded the peak impact acceleration and velocity changes. The damage thresholds for different varieties of peaches were determined by evaluating the relationship between the peak acceleration and velocity of peaches and the damage area of peaches. The above studies confirmed that mechanical parameters can be used to characterize the damage degree of fruit, and the relationship between different mechanical parameters and damage degree was analyzed. However, a quantitative prediction of the damage degree has not been achieved in these studies.
In recent years, with the continuous development of hyperspectral imaging technology, an increasing number of people have been using it to detect the internal quality and external damage of fresh fruits.17 Hyperspectral imaging (HSI) is an emerging technology that provides simultaneous spatial and spectral information of the object being detected.18 A large number of scholars have established classification models for the quality of multiple fruits based on hyperspectral imaging. Liu et al.19 utilized image information combined with spectral information to identify strawberry damage defects, and PLS-DA, SVM and BPNN models were established. The results showed that SVM had the best classification effect. Tan et al.20 established GS-SVM models based on the spectral information of apple damage regions with a correct discrimination rate of over 95% for the four-damage degrees. Zhu et al.21 used near-infrared hyperspectral imaging to rapidly detect slight bruises on apples after 1–3 days. Many researchers used spectral information combined with the physicochemical properties of fruit (e.g., soluble solids content, titratable acids, sugar content, flesh color and firmness) to detect the bruise defects of fruit.22,23 However, there are few studies based on hyperspectral imaging and mechanical parameters to characterize the damage degree of fruit. Xu et al.24 measured the mechanical parameters of apples during dropping by pressure sensitive film technology and collected hyperspectral data in the range of 900–1700 nm and established a quantitative prediction model based on the mechanical parameters of apples. Zhang et al.25 obtained the absorbed energy, maximum force and damage area during apple dropping by pressure-sensitive film technique and high-speed camera, and Full-SVM, PCA-SVM and SPA-SVM quantitative prediction models were established. The results showed that PCA-SVM had better prediction performance for mechanical parameters. However, the above research only used reflectance spectra for the model, and the robustness of the model remains to be improved.
In order to find a model with better prediction accuracy, three kinds of spectral data (R, A and K–M) are used to quantitatively predict the mechanical parameters of yellow peaches in this study. The specific objectives of this work are to preprocess three kinds of spectral data by standard normal transform (SNV), moving average (MA) and Gaussian filter (GF), and the characteristic wavelengths are selected by competitive adaptive reweighting (CARS) and uninformative variable elimination (UVE). The partial least squares regression (PLSR) and support vector regression (SVR) quantitative prediction models based on the three spectral data are established. The best model for predicting mechanical parameters is selected by comparing the predictive performance of all models. The results of this study will not only provide theoretical guidance for fruit grading, but also enrich the theoretical system of biomechanics.
2. Materials and methods
2.1 Yellow peach samples
Yellow peaches were purchased from the local fruit market in Nanchang. These yellow peaches were stored at 4 °C for less than 3 weeks. A total of 180 fresh yellow peaches of similar size without any mechanical damage and disease were selected for this experiment. In order to reduce the effect of the mass and curvature radius of the yellow peaches on the impact damage, the mass of all yellow peaches ranged from 243 to 253 g, and the equatorial diameter range was 75 to 81 mm. Prior to the collision experiment, all yellow peaches were randomly divided into six groups and numbered. All yellow peaches were stored at room temperature of 20 °C and a relative humidity of 40% for 24 hours to reduce the effect of temperature on the experimental results.
2.2 Collision experiment
In this study, a collision system for the impact test was designed based on the pendulum principle.26 Its structure is shown in Fig. 1. Fig. 1(a) shows the front view of the experimental device, which is composed of a frame and base, and the force sensor is installed on a steel plate that can be vertically adjusted. A fish line with a length of 80 cm and non-elongation was selected as the pendulum arm, and the fruit jig was made of a new material polylactic acid (PLA) by 3D printer. Therefore, the mass of the fruit jig and the rotational inertia of the pendulum arm could be neglected. A permanently fixed protractor was installed on the frame of this device, and the swing angle of the pendulum arm was controlled within a range of 5° to 85°. In the collision experiment, in order to avoid another impact, the yellow peaches were grabbed by hand immediately after impacting the force sensor. During the impact process, the force variation with time were recorded by means of a force sensor and intelligent data acquisition instrument. The force sensor model HZC-H1 with a measuring range of 0–100 kg and an output sensitivity of 2.00 mV V−1. The sampling frequency of the intelligent data acquisition instrument was 51.2 kHz and the calibration value was 0.02 mV N−1. The measurement was started when the impact force exceeded 0.5 N. The yellow peaches were fixed on the fruit jig, and they were released from swing angles of 30°, 40°, 50°, 60°, 70° and 80° to obtain samples with different degrees of damage.
 |
| | Fig. 1 Schematic diagram of the impacting device: 1-protractor, 2-fishing line, 3-fruit fixture, 4-dynamic bumper plate, 5-pressure sensor, 6-intelligent data acquisition and signal processing, 7-PC, 8-light source, 9- high-speed camera. | |
Fig. 1(b) shows the side view of the experimental device. The whole process of the yellow peach collision was recorded by a digital high-speed camera (HXC20NIR) fixed on a tripod and a lens with a constant focal length of 35 mm. The distance between the camera and the impact area was 0.3 m, and the picture acquisition frequency was set as 1000 frames per s. Due to the high shooting speed of the camera, high brightness and strobe-free LED lights were installed on both sides of the camera for illumination. The impact velocity and rebound velocity of the yellow peach during the collision process could be obtained by this method. In this experiment, the scale factor was set as 0.13 mm per pixel when the image size was converted from pixel to millimeter.
2.3 Calculation and measurement of the mechanical parameters
2.3.1 Damage area. After the collision experiment, all damaged yellow peaches were left at room temperature (20 °C) for 24 hours to allow for browning of the damaged region, so that they were more easily identified and measured. As the collision surface between the force sensor and the yellow peach is a smooth circular plane, the shape of the damaged region is approximately circular. Therefore, for the damage area, the diameter of the damage region was measured in two mutually perpendicular directions by means of a digital vernier caliper (accuracy of 0.01 mm), and the average value of the two diameters was used as the diameter of the damage region. The value of the damage area was calculated by eqn (1):| |
 | (1) |
where A is the damage area (mm2) and D is the damage diameter (mm).
2.3.2 Maximum force and absorbed energy. The collected data were time domain analyzed by the DASP-V11 software. Parameters, such as the maximum and average forces of the yellow peaches during the collision, were obtained. In impact collision experiments, part of the impact energy is absorbed due to the plastic deformation of the yellow peaches. If the energy loss during the collision is neglected, the absorbed energy of the yellow peach is equal to the difference between the impact energy and the rebound energy.27 The speed of the yellow peach during impact and rebound is low, and the high-speed camera can capture 1000 images in 1 s. Hence, the change in the spatial position of the yellow peach in two consecutive frame images is the displacement of the yellow peach in Δt time (in this experiment, Δt = 1 × 10⁻³ s). Two consecutive frame images of the yellow peach before and after the collision were selected, and the moving distance of the yellow peach in the image was calculated by digital image correlation method.28,29 The impact and rebound energy of the yellow peach were calculated by eqn (2):| |
 | (2) |
where S is the actual displacement in Δt time, and Δt is the time between adjacent images (t = 0.001 s). The absorbed energy of the yellow peaches was calculated by eqn (3):| |
 | (3) |
where v1 is the impact velocity, v2 is the rebound velocity, and m is the mass of the yellow peach.
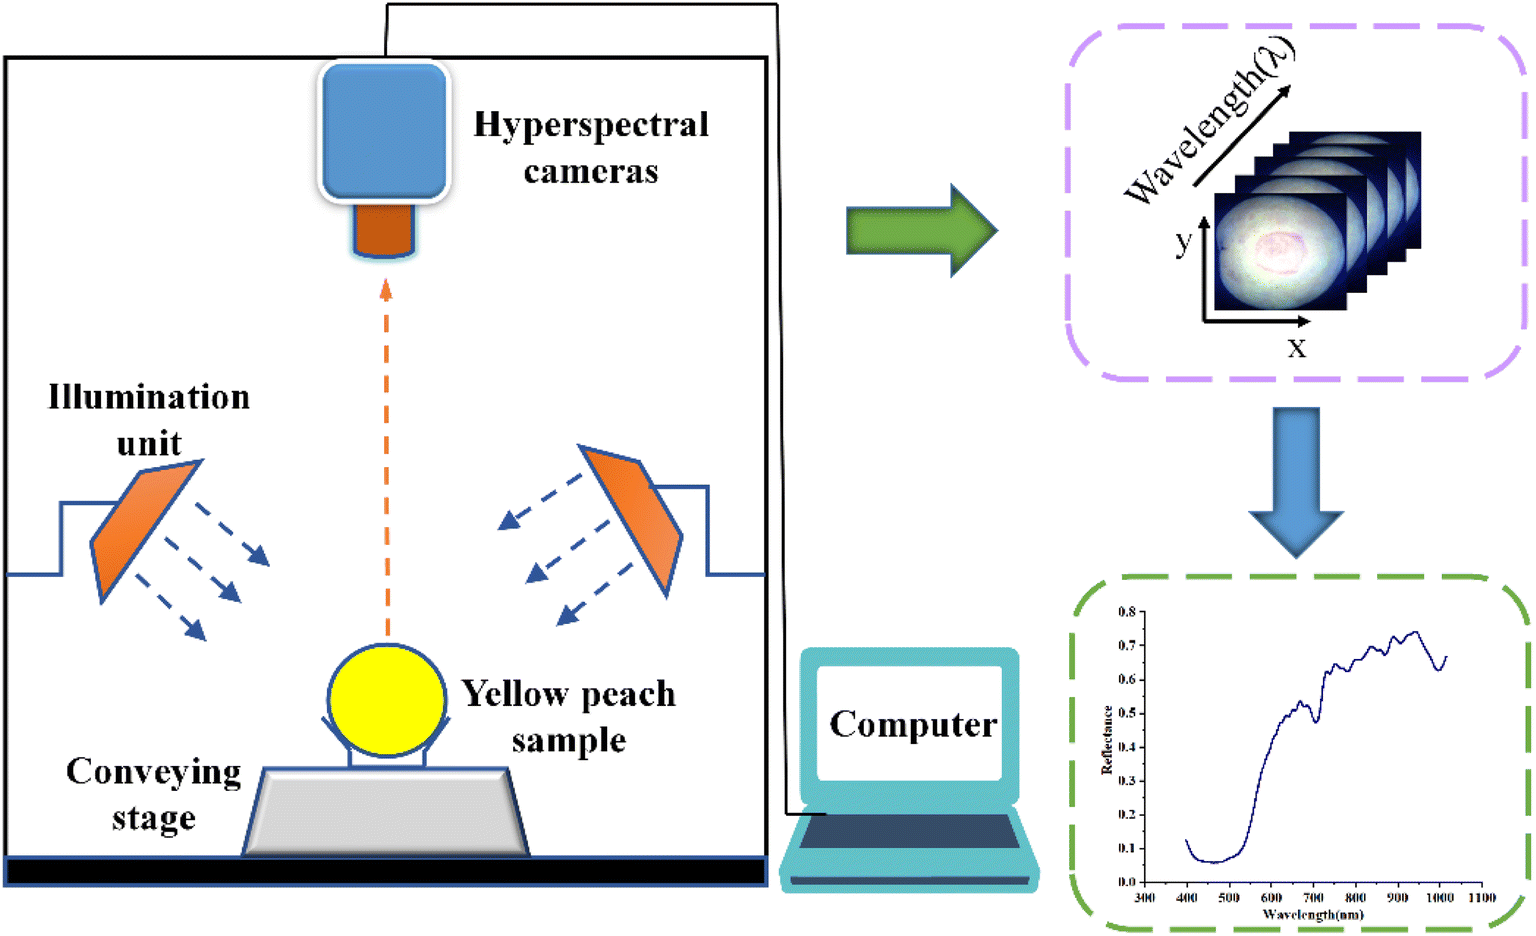
2.4 Hyperspectral imaging system
The images of the samples were obtained using a hyperspectral imaging system (spectral range 397.5–1014 nm), and the structure diagram is shown in Fig. 2. The components of this hyperspectral imaging system mainly include an imaging spectrometer, a charge coupled device (CCD) camera, an illumination unit with four tungsten halogen lamps with a power of 20 W, and a motor-controlled mobile platform. In order to reduce the influence of stray light on the sample, all components are installed in a closed dark box. During the image acquisition, the distance between the damaged region of the yellow peach and the CCD camera was 48 cm, the exposure time of the CCD camera was 6 ms, the spectral resolution was 3.5 nm, and the forward speed of the mobile platform was 3 cm s−1.
 |
| | Fig. 2 Schematic illustration of the hyperspectral imaging system. | |
2.5 Extraction and conversion of the spectral data
After the impact test, the damaged yellow peach was scanned in reflectance mode using the hyperspectral imaging system. The presence of dark currents in the CCD camera results in a lot of noise in some bands of weak light intensity. Hence, the acquired hyperspectral images need to be corrected with black and white references before extracting the spectral data.30 The images were corrected by eqn (4):| |
 | (4) |
where I is the corrected hyperspectral image in units of relative reflectance (%), Ir is the original hyperspectral image, Id is the dark reflectance image and Iw is the white reflectance image. The ENVI 4.5 software was used to identify the circular region of interest (ROI) of the yellow peach, and the average spectrum of the ROI was extracted.
After extracting the average reflectance spectra of the yellow peaches, the average spectral data were transformed into absorption spectral data (A) and Kubelka–Munk spectral data (K–M) in order to investigate the potential of quantitative prediction of mechanical parameters by absorption spectra (A) and Kubelka–Munk spectra (K–M). Spectral data were transformed using eqn (5) and (6):31
| |
A = −log![[thin space (1/6-em)]](https://www.rsc.org/images/entities/char_2009.gif) R10 R10
| (5) |
| |
 | (6) |
Consequently, three kinds of spectral data with different units (i.e., R, A and K–M) were obtained, and they were used to quantitatively predict the mechanical parameters of yellow peaches.
2.6 Spectral data preprocessing
The raw spectrum contains information about the sample itself, as well as other extraneous information and noise, such as electrical noise, sample background and stray light. At present, there is no standard for the optimal pretreatment type of spectra.32 Accordingly, it is necessary to use different methods to preprocess the original spectrum, so as to select the appropriate pretreatment method. In this study, standard normal variables (SNV), moving average (MA) and Gaussian filter (GF) were used to preprocess the original spectrum. Standard normal variables (SNV) can eliminate the effects of the solid particles, surface scattering and optical path changes on the reflection spectrum.33 Moving averages (MA) are one of the main tools for smoothing data.34 Gaussian filtering (MF) can be calculated by means of a Gaussian function to reduce the original spectral noise.35
2.7 Characteristic wavelength selection
The acquired spectral data contains numerous wavelengths. There are redundancy and collinearity problems between the adjacent wavelength data points, which seriously affect the prediction performance of the model. In order to simplify the modelling process and improve the efficiency of the model, it is necessary to select the characteristic wavelengths from all wavelengths for modelling. In recent years, many wavelength selection algorithms have been reported.36,37 In the present study, competitive adaptive reweighted sampling (CARS) and uninformative variable elimination algorithm (UVE) were used to select the characteristic wavelengths.
The competitive adaptive reweighted sampling (CARS) algorithm has been widely used in the selection of the spectral wavelength, and it is based on the “survival of the fittest” principle of Darwinian evolution.38 The process of selecting the characteristic wavelengths by CARS is mainly divided into two parts, i.e., (i) the variables in the PLS model with larger absolute values of the regression coefficients are selected using the adaptive reweighting technique (ARS) and the exponential decay function (EDF), and (ii) the variables in the subset of the PLS model with the smallest RMSECV are selected as the characteristic wavelengths by cross-validation.39
Uninformative variable elimination (UVE) is a variable selection method based on the stability analysis of regression coefficients. Its basic idea is to use partial least squares regression (PLSR) coefficients as a measure of the importance of wavelengths, which can effectively eliminate redundant informative variables.40
2.8 Regression model building and model evaluation
In spectral data analysis, it is important to use suitable modelling algorithms to obtain good predictive models. Since it is uncertain whether the relationship between the spectral data and the mechanical parameters is linear or non-linear, at least two algorithms are chosen to establish the quantitative prediction model. In this study, a linear modelling algorithm (PLSR) and a non-linear modelling algorithm (SVR) were used to build the prediction models.41,42 The best model was selected by comparing the predictive performance of different models. Before modelling, the Kennard–Stone (KS) algorithm was used to select 20 samples from each release angle, 120 samples as the modelling set, and 60 samples as the prediction set. The partial least squares regression (PLSR) model and support vector regression (SVR) model were each established.
PLSR is a linear statistical algorithm, which incorporates principal component analysis and canonical correlation analysis on the basis of ordinary multiple regression. It can be used to solve the problem of multiple collinearity of independent variables.43 The quantitative relationships of the PLSR model can be calculated by eqn (7):
| | |
Yn×1 = Xn×k × βk×1 + En×1
| (7) |
where
Y is the matrix of predicted values,
X is the spectra matrix,
β is the matrix of coefficients, and
E is the error matrix.
SVR is a non-linear statistical algorithm, which transforms the non-linear variables in low-dimensional space into high-dimensional space by means of kernel functions, and the relationship between the variables in high-dimensional space is described through linear functions.44,45 When modelling using support vector regression (SVR), different kernel functions have significant influence on the predictive performance of the model. In some previous studies, it has been found that the RBF kernel function has better stability and predictive performance.46,47 Thus, the RBF function is chosen as the kernel function for the SVR model in this study. Additionally, the performance of the SVR model is influenced by some parameters, including the penalty factor (C), insensitivity loss coefficient (ε), and width coefficient of the kernel function (γ). In the present work, a grid search method is used to determine the optimal parameters.
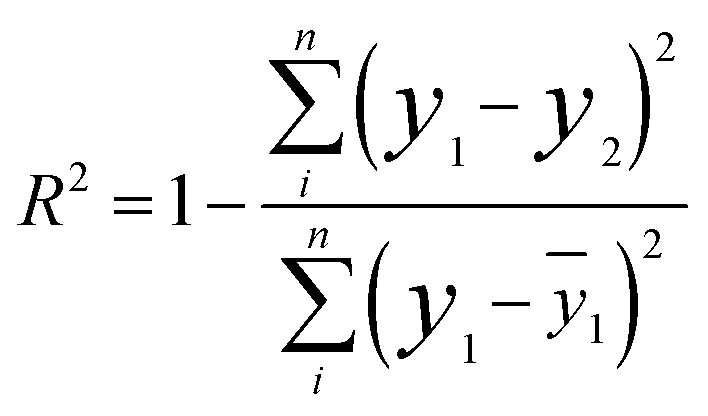
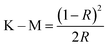
Model evaluation is an important part of modelling. The performance of the model is evaluated using the determination coefficient of the modelling set (RC2), root mean square error of the modelling set (RMSEC), determination coefficient of the prediction set (RP2), root mean square error of the prediction set (RMSEP), and the prediction set prediction deviation (RPD). In general, the higher the determination coefficient (R2), the more stable the model is and the smaller the root mean square error (RMSE), indicating that the model has a better fit. A higher value of RPD shows that the model has better predictive performance.48,49 The relevant parameters were calculated by eqn (8), (9) and (10):50,51
| |
 | (8) |
| |
 | (9) |
| |
 | (10) |
where
y1 and
y2 are the true and predicted values of the sample, respectively,
ȳ1 is the average of the true values of all samples,
n is the sample size, and SD is the standard deviation of the prediction set.
Spectral data were preprocessed, and the PLSR and SVR models were established using The Unscramble X 10.4. KS classification. The characteristic wavelengths were selected by CARS and UVE algorithms in MATLAB 2018b. Fig. 3 shows the flow chart of the data processing.
 |
| | Fig. 3 Processing methods of the spectral data: R = Reflectance; A = Absorbance; K–M = Kubelka–Munk; MA = moving average; GF = Gaussian filter; SNV = standard normal variate; CARS = competitive adaptive reweighted sampling; UVE = uninformative variable elimination; PLSR = partial least squares regression; SVR = support vector regression. | |
3. Results and discussion
3.1 Statistical analysis of the mechanical parameters
Statistical analysis of the mechanical parameters was carried out, and the results are shown in Table 1. It can be seen from Table 1 that there is diversity in the statistics for the different mechanical parameters. It is noteworthy that the values of all mechanical parameters are positively correlated with the collision angle, which is consistent with the findings of Zbigniew et al.52 The average value of the absorbed energy varies considerably when the collision angle is 60°, 70° and 80°. After analysis, the main reason is that the greater the angle of collision, the faster the yellow peach is at its lowest point. However, the shooting speed of a high-speed camera is not fast enough, resulting in a large deviation in the spatial displacement of the yellow peach in the adjacent pictures. In future research studies, a high-speed camera with faster shooting speed will be used to shoot the whole motion process, so as to reduce the calculation error of the absorbed energy. Overall, all mechanical parameters show some regular variation, so it is feasible and reasonable to use mechanical parameters to characterize the degree of impact damage on the yellow peaches.
Table 1 Statistical results of the mechanical parametersa
| Mechanical parameters |
Collision angle |
Maximum |
Minimum |
Mean |
SD |
| DA = damaged area; MF = maximum force; AE = absorbed energy; SD = standard deviation. |
| DA (mm2) |
30° |
199 |
133 |
161 |
14.46 |
| 40° |
279 |
207 |
237 |
20.30 |
| 50° |
378 |
227 |
324 |
36.18 |
| 60° |
518 |
382 |
460 |
35.76 |
| 70° |
698 |
527 |
623 |
40.31 |
| 80° |
850 |
719 |
783 |
40.01 |
| MF (N) |
30° |
176 |
135 |
153 |
10.85 |
| 40° |
261 |
171 |
223 |
22.84 |
| 50° |
401 |
216 |
316 |
37.86 |
| 60° |
461 |
308 |
396 |
36.37 |
| 70° |
574 |
388 |
482 |
42.97 |
| 80° |
663 |
492 |
575 |
47.44 |
| AE (J) |
30° |
0.95 |
0.04 |
0.36 |
0.24 |
| 40° |
2.39 |
0.25 |
1.31 |
0.61 |
| 50° |
3.88 |
1.32 |
2.65 |
0.67 |
| 60° |
6.53 |
2.62 |
4.02 |
1.20 |
| 70° |
9.47 |
3.22 |
4.96 |
1.60 |
| 80° |
9.83 |
3.13 |
6.44 |
1.90 |
3.2 Spectral characteristics analysis
The average spectral curves of the reflectance spectrum (R), absorbance spectrum (A) and Kubelka–Munk (K–M) spectrum are shown in Fig. 4(a), (b) and (c) respectively. As shown in Fig. 4(a), the spectral reflectance of sound yellow peaches was significantly higher than that of damaged yellow peaches. This is consistent with the results of research on apples and pears.53,54 According to the literature, 705 nm is mainly the absorption band of carbohydrates.55 The wave valley at 995 nm is due to the O–H bond in the water molecule.56 The more severely damaged yellow peaches are, the lower the spectral reflectance is. This indicates that spectral information can reflect the damage degree of yellow peaches. The reflectance spectrum and absorbance spectrum have differences in the wave crests and troughs. This may be attributed to the rupture of pulp cells in the injured part of the yellow peach and the release of a large amount of cell fluids, resulting in different water contents, and thus differences between the wave peaks and troughs.57 As shown in Fig. 4(c), the K–M spectral curve has fewer wave peaks and troughs. This is probably due to the fact that the process of transforming the R spectrum into a K–M spectrum removes most of the spectra signal information, especially that of the wave peaks and troughs. Three kinds of spectra overlap in some bands, so further processing of the raw spectra was required.
 |
| | Fig. 4 Three spectral curves of yellow peaches: (a) average reflectance spectral curves of healthy and damaged yellow peaches; (b) average absorbance spectral curves of healthy and damaged yellow peaches; (c) average Kubelka–Munk spectral curves of healthy and damaged yellow peaches. | |
3.3 Modelling based on original and preprocessed spectra
3.3.1 Modelling based on reflectance spectral data. In this research, the K–S algorithm was used to partition the sample set (modelling set: prediction set = 2:1), and the results of the partition are shown in Table 2. It can be seen in Table 2 that the maximum and minimum values of all mechanical parameters were divided into the modelling set. The average values of the mechanical parameters in the modelling and prediction sets were very close to each other. Therefore, the K–S algorithm is reasonable for the results of the dividing of the sample set.
Table 2 Modelling set and prediction set of samples
| Mechanical parameters |
Samples set |
Number |
Maximum |
Minimum |
Mean |
| DA (mm2) |
Modelling |
120 |
850 |
133 |
433 |
| Prediction |
60 |
849 |
139 |
429 |
| AE (J) |
Modelling |
120 |
9.83 |
0.04 |
3.36 |
| Prediction |
60 |
9.45 |
0.05 |
3.15 |
| MF (N) |
Modelling |
120 |
663 |
135 |
357 |
| Prediction |
60 |
633 |
136 |
357 |
Partial least squares regression (PLSR) models and support vector regression (SVR) models were developed using the raw and preprocessed reflectance spectral data, respectively, and the results are shown in Table 3. Through comparative analysis, it was found that the PLSR and SVR models based on different spectral data had different predictive performance for mechanical parameters. For the damage area, absorbed energy and maximum force, the prediction performance of the PLSR model outperformed the SVR model.
Table 3 PLSR and SVR model predictions of the reflectance spectra after preprocessing with different methodsa
| Model |
Spectra |
Mechanical parameter |
Parameter |
Model set |
Prediction set |
| RMSEC |
RC2 |
RMSEP |
RP2 |
RPD |
| The parameter of the PLSR model is the optimal number of PCs; the parameter of the SVR model is the penalty factor (C), insensitivity loss coefficient (ε) and width coefficient of kernel function (γ), shown as (C, ε, γ). |
| PLSR |
Raw |
DA (mm2) |
9 |
80.303 |
0.866 |
93.077 |
0.821 |
2.403 |
| AE (J) |
8 |
1.351 |
0.677 |
1.203 |
0.660 |
1.705 |
| MF (N) |
9 |
64.096 |
0.818 |
71.455 |
0.765 |
1.970 |
| SNV |
DA (mm2) |
11 |
74.512 |
0.886 |
92.252 |
0.823 |
2.509 |
| AE (J) |
14 |
1.243 |
0.733 |
1.288 |
0.712 |
1.525 |
| MF (N) |
12 |
58.966 |
0.845 |
64.331 |
0.812 |
2.372 |
| MA |
DA (mm2) |
10 |
81.768 |
0.862 |
92.877 |
0.821 |
2.334 |
| AE (J) |
9 |
1.305 |
0.699 |
1.498 |
0.628 |
1.342 |
| MF (N) |
9 |
65.299 |
0.811 |
91.583 |
0.764 |
1.963 |
| GF |
DA (mm2) |
9 |
81.475 |
0.863 |
91.583 |
0.826 |
2.351 |
| AE (J) |
8 |
1.361 |
0.672 |
1.430 |
0.661 |
1.437 |
| MF (N) |
9 |
64.388 |
0.817 |
71.344 |
0.766 |
1.971 |
| SVR |
Raw |
DA (mm2) |
(100,0.1,0.01) |
74.599 |
0.887 |
96.399 |
0.825 |
2.225 |
| AE (J) |
(100,0.1,0.01) |
1.176 |
0.773 |
1.498 |
0.635 |
1.146 |
| MF (N) |
(100,0.1,0.01) |
58.303 |
0.852 |
74.886 |
0.748 |
1.852 |
| SNV |
DA (mm2) |
(10,0.1,0.01) |
88.060 |
0.852 |
115.644 |
0.725 |
1.566 |
| AE (J) |
(10,0.1,0.01) |
1.353 |
0.700 |
1.470 |
0.628 |
1.173 |
| MF (N) |
(1,0.1,0.01) |
65.440 |
0.825 |
83.012 |
0.713 |
1.566 |
| MA |
DA (mm2) |
(10,0.1,0.01) |
112.973 |
0.738 |
130.255 |
0.665 |
1.517 |
| AE (J) |
(100,0.1,0.01) |
1.247 |
0.739 |
1.535 |
0.612 |
1.139 |
| MF (N) |
(100,0.1,0.01) |
65.934 |
0.809 |
75.607 |
0.746 |
1.786 |
| GF |
DA (mm2) |
(100,0.1,0.01) |
77.017 |
0.878 |
113.728 |
0.746 |
1.843 |
| AE (J) |
(100,0.1,0.01) |
1.194 |
0.764 |
1.505 |
0.630 |
1.153 |
| MF (N) |
(100,0.1,0.01) |
60.112 |
0.843 |
75.148 |
0.746 |
1.808 |
In the PLSR model, the SNV-PLSR model showed the best prediction performance on the absorbed energy and maximum force with RP2 and RMSEP of 0.712 and 1.288 J, and 0.812 and 64.331 N, respectively. The RPD values were 1.525 and 2.372. For the prediction of the damage area, the RP2 and RMSEP of the GF-PLSR model were 0.826 and 91.583 mm2, respectively, and the stability of this model was slightly better than that of the SNV-PLSR model. However, the RPD values of the GF-PLSR model were slightly lower than that of the SNV-PLSR model, which indicates that the SNV-PLSR model had better prediction accuracy. Overall, the SNV-PLSR model had higher prediction accuracy for the mechanical parameters. In the SVR model, for the prediction of the damage area, absorbed energy and maximum force, the RP2 and RMSEP of the Raw-PLSR model were 0.825 and 96.399 mm2, 0.635 and 1.498 J, and 0.748 and 74.866 N, respectively. The RPD values were 2.255, 1.146 and 1.825. Its prediction performance was higher than that of other models. Accordingly, for the R spectra, the SNV preprocessed spectral data and the raw spectral data are selected for subsequent processing.
3.3.2 Modelling based on the absorbance spectral data. The PLSR and SVR models were established based on the raw absorbance data and the preprocessed absorbance spectral data, respectively, and the results are shown in Table 4. It can be seen from Table 4 that the PLSR model outperforms the SVR model in terms of the prediction performance for all mechanical parameters. In the two modelling methods, the prediction performance of the three kinds of preprocessed absorbance data was less satisfactory.
Table 4 PLSR and SVR model predictions of the absorbance spectra after preprocessing with different methods
| Model |
Spectra |
Mechanical parameter |
Parameter |
Model set |
Prediction set |
| RMSEC |
RC2 |
RMSEP |
RP2 |
RPD |
| PLSR |
Raw |
DA (mm2) |
10 |
83.074 |
0.858 |
89.882 |
0.832 |
2.538 |
| AE (J) |
14 |
1.237 |
0.728 |
1.296 |
0.723 |
1.687 |
| MF (N) |
13 |
54.531 |
0.868 |
67.223 |
0.792 |
2.199 |
| SNV |
DA (mm2) |
8 |
93.175 |
0.821 |
98.665 |
0.797 |
2.146 |
| AE (J) |
8 |
1.422 |
0.653 |
1.417 |
0.647 |
1.510 |
| MF (N) |
9 |
66.048 |
0.806 |
70.847 |
0.770 |
2.119 |
| MA |
DA (mm2) |
11 |
84.084 |
0.854 |
89.204 |
0.834 |
2.435 |
| AE (J) |
16 |
1.250 |
0.722 |
1.338 |
0.705 |
1.667 |
| MF (N) |
11 |
65.596 |
0.809 |
72.703 |
0.757 |
2.039 |
| GF |
DA (mm2) |
10 |
87.121 |
0.844 |
94.684 |
0.813 |
2.236 |
| AE (J) |
15 |
1.234 |
0.730 |
1.305 |
0.719 |
1.727 |
| MF (N) |
11 |
63.375 |
0.822 |
70.974 |
0.769 |
2.090 |
| SVR |
Raw |
DA (mm2) |
(100,0.1,0.01) |
80.939 |
0.865 |
99.731 |
0.809 |
2.170 |
| AE (J) |
(100,0.1,0.01) |
1.276 |
0.725 |
1.582 |
0.586 |
1.209 |
| MF (N) |
(100,0.1,0.01) |
64.704 |
0.817 |
72.891 |
0.759 |
1.818 |
| SNV |
DA (mm2) |
(10,0.1,0.01) |
90.587 |
0.837 |
123.104 |
0.759 |
1.486 |
| AE (J) |
(10,0.1,0.01) |
1.314 |
0.733 |
1.529 |
0.590 |
1.079 |
| MF (N) |
(10,0.1,0.01) |
64.802 |
0.817 |
81.325 |
0.718 |
1.707 |
| MA |
DA (mm2) |
(100,0.1,0.01) |
91.056 |
0.830 |
116.470 |
0.741 |
1.806 |
| AE (J) |
(100,0.1,0.01) |
1.311 |
0.701 |
1.610 |
0.574 |
1.216 |
| MF (N) |
(100,0.1,0.01) |
71.883 |
0.773 |
75.862 |
0.737 |
1.732 |
| GF |
DA (mm2) |
(100,0.1,0.01) |
83.867 |
0.856 |
110.517 |
0.763 |
1.887 |
| AE (J) |
(100,0.1,0.01) |
1.287 |
0.719 |
1.589 |
0.583 |
1.200 |
| MF (N) |
(100,0.1,0.01) |
66.573 |
0.806 |
73.956 |
0.751 |
1.786 |
In the PLSR model, the Raw-PLSR model had the best prediction performance on the absorbed energy and maximum force with RP2 and RMSEP of 0.723 and 1.296 J, 0.792 and 67.223 N, respectively. Their RPD values were 1.667 and 2.199. For the prediction of the damage area, the RP2 (0.834) of the MA-PLSR model was slightly higher than the RP2 (0.832) of the Raw-PLSR model, which indicates that the MA-PLSR model had better stability. However, from the perspective of prediction accuracy, the RPD (2.538) of the Raw-PLSR model was slightly higher than that of the MA-PLSR model RPD (2.435). Overall, the Raw-PLSR model showed better predictive performance. Among the SVR models, the Raw-SVR model had better predictive performance for the damage area and maximum force with RP2 and RMSEP of 0.809 and 99.731 mm2 and 0.759 and 72.891 N, respectively. The values of RPD were 2.170 and 1.818. For the absorbed energy, although the RP2(0.590) of the SNV-PLSR model was larger than the RP2(0.586) of the Raw-SVR model, the Raw-PLSR model had better prediction accuracy for absorbed energy. It is worth noting that the predictive performance of the SVR for absorbed energy remains to be improved, with none of its RP2 values exceeding 0.590. Overall, for the A spectra, the original spectra were selected for further processing.
3.3.3 Modelling based on K–M spectral data. The PLSR and SVR models were established using the original K–M spectra and the preprocessed K–M spectra, respectively, and the results are shown in Table 5. Comparing the two models, the prediction ability of the PLSR model for all mechanical parameters was higher than that of the SVR model. In the PLSR model, the GF-PLSR model had the best prediction performance for the damage area and absorbed energy, with RP2 and RMSEP of 0.856 and 81.841 mm2, 0.720 and 1.180 J, respectively, and the values of RPD were 2.603 and 1.567, respectively. For the maximum force, the prediction performance of the Raw-PLSR model was better. Its values of RP2 and RMSEP were 0.840 and 59.496 N, respectively. However, the RPD of the GF-PLSR model (2.438) was similar to that of the Raw-PLSR model (2.456), and the prediction results of the GF-PLSR model for the maximum force were still acceptable. For the SVR model, the Raw-SVR model had the best predictive performance for all mechanical parameters with RP2 and RMSEP of 0.806 and 99.195 mm2, 0.586 and 1.442 J, and 0.746 and 74.923 N, respectively. Overall, for the K–M spectra, the GF preprocessed spectra and the original spectra were selected for further analysis.
Table 5 PLSR and SVR model predictions of the absorbance spectra after preprocessing with different methods
| Model |
Spectra |
Mechanical parameter |
Parameter |
Model set |
Prediction set |
| RMSEC |
RC2 |
RMSEP |
RP2 |
RPD |
| PLSR |
Raw |
DA (mm2) |
9 |
86.864 |
0.846 |
97.302 |
0.798 |
2.338 |
| AE (J) |
13 |
1.298 |
0.728 |
1.190 |
0.715 |
1.515 |
| MF (N) |
12 |
58.866 |
0.845 |
59.496 |
0.840 |
2.456 |
| SNV |
DA (mm2) |
7 |
91.131 |
0.828 |
110.847 |
0.748 |
1.818 |
| AE (J) |
9 |
1.352 |
0.705 |
1.322 |
0.648 |
1.741 |
| MF (N) |
9 |
59.967 |
0.841 |
66.074 |
0.799 |
2.060 |
| MA |
DA (mm2) |
13 |
85.285 |
0.852 |
97.369 |
0.797 |
2.047 |
| AE (J) |
16 |
1.290 |
0.732 |
1.220 |
0.700 |
1.549 |
| MF (N) |
14 |
65.915 |
0.806 |
68.973 |
0.784 |
2.042 |
| GF |
DA (mm2) |
14 |
69.621 |
0.902 |
81.841 |
0.856 |
2.603 |
| AE (J) |
13 |
1.295 |
0.730 |
1.180 |
0.720 |
1.567 |
| MF (N) |
13 |
57.915 |
0.850 |
60.685 |
0.833 |
2.438 |
| SVR |
Raw |
DA (mm2) |
(100,0.1,0.01) |
95.520 |
0.815 |
99.195 |
0.806 |
2.107 |
| AE (J) |
(100,0.1,0.01) |
1.448 |
0.675 |
1.442 |
0.586 |
1.038 |
| MF (N) |
(100,0.1,0.01) |
73.607 |
0.759 |
74.923 |
0.746 |
1.669 |
| SNV |
DA (mm2) |
(100,0.1,0.01) |
106.447 |
0.769 |
141.084 |
0.593 |
1.224 |
| AE (J) |
(100,0.1,0.01) |
1.451 |
0.684 |
1.629 |
0.464 |
1.009 |
| MF (N) |
(100,0.1,0.01) |
75.727 |
0.769 |
98.699 |
0.588 |
1.412 |
| MA |
DA (mm2) |
(100,0.1,0.01) |
103.768 |
0.782 |
109.299 |
0.757 |
1.822 |
| AE (J) |
(100,0.1,0.01) |
1.503 |
0.644 |
1.467 |
0.567 |
1.028 |
| MF (N) |
(100,0.1,0.01) |
79.339 |
0.719 |
79.258 |
0.716 |
1.541 |
| GF |
DA (mm2) |
(10,0.1,0.01) |
100.359 |
0.796 |
105.414 |
0.771 |
1.862 |
| AE (J) |
(10,0.1,0.01) |
1.466 |
0.665 |
1.446 |
0.583 |
1.029 |
| MF (N) |
(10,0.1,0.01) |
75.313 |
0.747 |
75.861 |
0.740 |
1.636 |
3.4 Selection of characteristic wavelengths
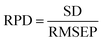
3.4.1 Reflectance spectral characteristic wavelength selection. The CARS algorithm was used to select the characteristic wavelengths for the raw spectra and the SNV preprocessed spectral data. Fig. 5 shows the characteristic wavelength selection process for the raw spectra of the absorbed energy. Fig. 5(a) shows that the number of selection variables decreases with the number of samples, and the speed of variable reduction is fast first, and then slow. As shown in Fig. 5(b), with increasing sample, the RMSECV value decreases firstly and then increases. The RMSECV value reaches a minimum value when the number of samples was 57. This indicates that the spectral information, which is not relevant to the absorbed energy, was eliminated in the 1st–57th samples. After the 57th sample, the RMSECV value gradually increased, indicating that the information relevant to the absorbed energy was also eliminated. Fig. 5(c) shows the path of change in the regression coefficients of the 176 spectral variables. Since the smallest RMSECV value was found in the 57th sampling, the variables extracted from the 57th sampling were used as the characteristic wavelengths of the absorbed energy, containing a total of 14 variables, 495.8 nm, 557.5 nm, 696.9 nm, 711 nm, 807 nm, 810.6 nm, 824.9 nm, 828.5 nm, 850.1 nm, 853.7 nm, 900.7 nm, 907.9 nm, 940.7, and 1010.3 nm.
 |
| | Fig. 5 Process for the selection of characteristic wavelengths by the CARS method: (a) change in the number of variables, (b) changes to the RMSECV, (c) change in the regression coefficient. | |
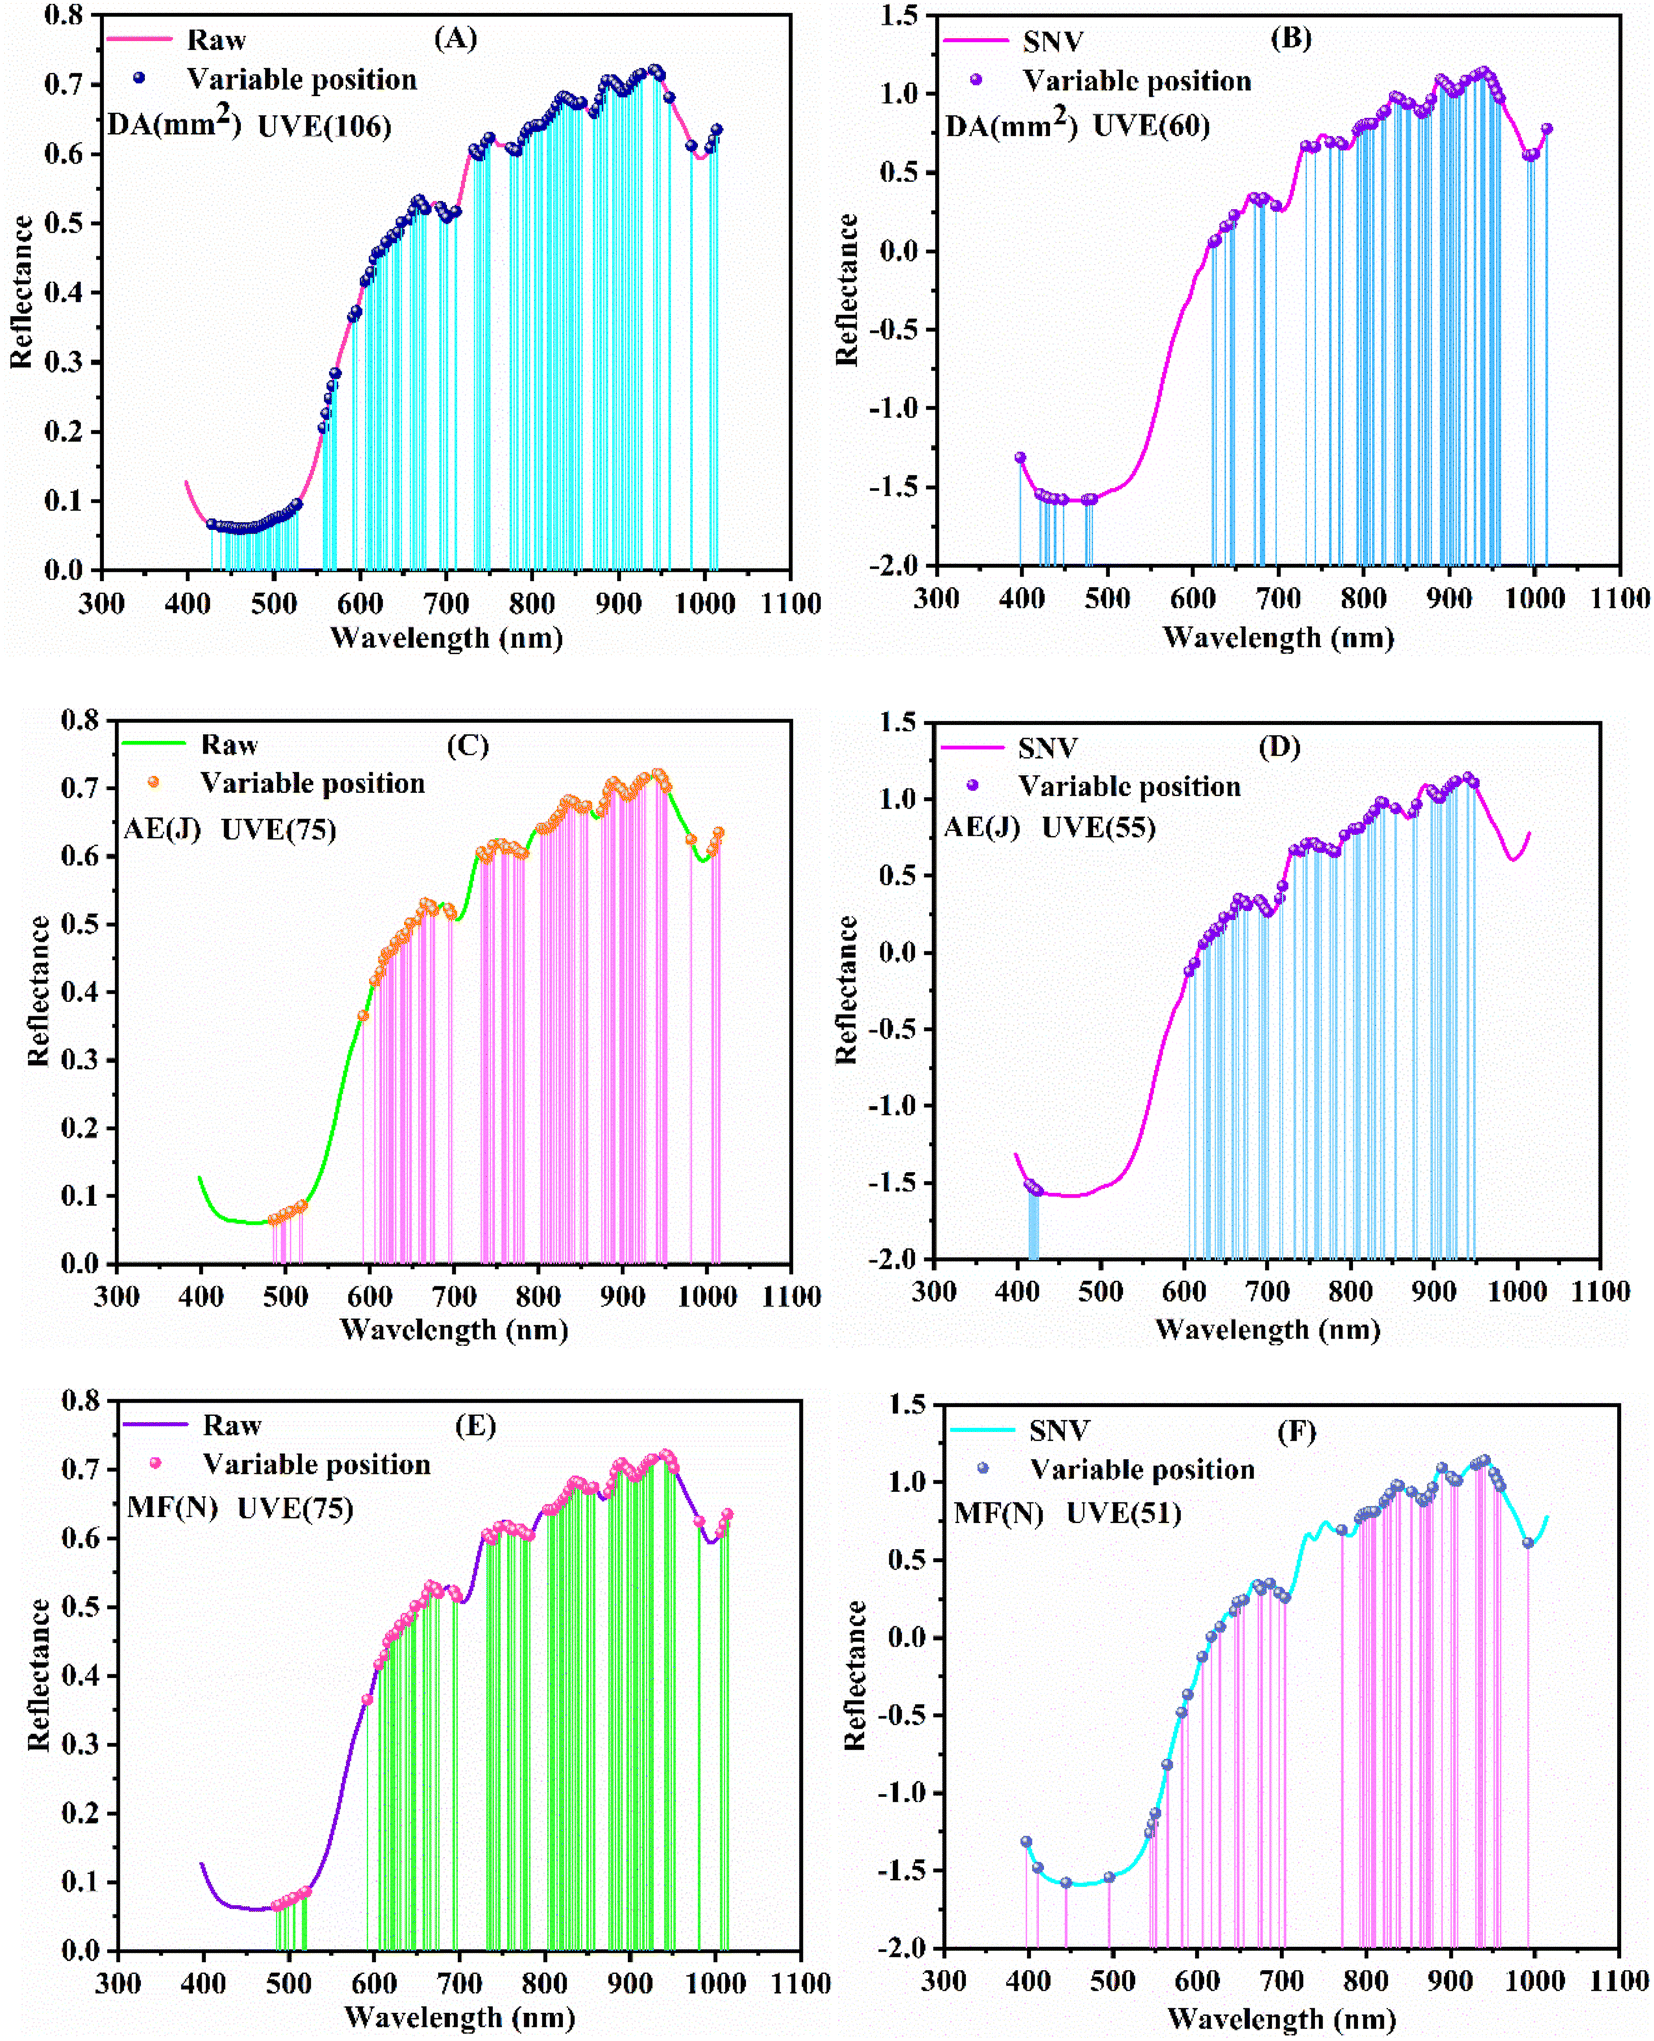
For the original spectra, the number of characteristic wavelengths corresponding to the damage area, absorbed energy and maximum force were 35, 14 and 28, respectively, accounting for 19.9%, 7.9% and 15.9% of the total wavelengths, respectively. The positions of the characteristic wavelengths are shown in Fig. 6(A), (C) and (E). For the SNV preprocessed spectra, the number of characteristic wavelengths corresponding to the damage area, absorbed energy and maximum force were 21, 9 and 28, respectively, accounting for 11.9%, 5.1% and 15.9% of the full wavelengths, respectively. The positions of the characteristic wavelengths are shown in Fig. 6(B), (D) and (F). As shown in Fig. 6, the position and number of characteristic wavelengths corresponding to different mechanical parameters were different, which indicates that the spectral characteristic information of different mechanical parameters is different. It is noteworthy that most of the characteristic wavelengths were located between 760 nm and 950 nm (water absorption band), indicating that there is a strong correlation between the water molecular content and mechanical parameters in the collision region.
 |
| | Fig. 6 The CARS algorithms select the position of the reflectance spectra characteristic wavelength. Raw = original spectrum; SNV = standard normal variate. | |
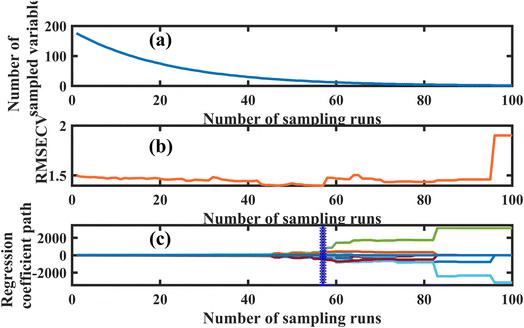
The UVE algorithm was used to select the characteristic wavelengths for the original spectrum and the spectrum preprocessed by SNV. Fig. 7 shows the stability analysis of the characteristic wavelength of the original spectrum for the damaged area. In Fig. 7, the 176 original wavelengths are shown on the left, and the same number of random variables are introduced on the right. The two parallel lines represent the upper and lower limits of stability, with all variables within the two parallel lines removed, and the remaining variables were used for further processing. The results show that a total of 106 variables were selected by UVE, accounting for 60.2% of the full wavelength.
 |
| | Fig. 7 Characteristic wavelength selection by the UVE algorithm. | |
For the original spectra, the number of characteristic wavelengths corresponding to the damage area, absorbed energy and maximum force were 106, 75 and 73, representing 60.2%, 42.6% and 41.5% of the full wavelengths, respectively. The positions of the characteristic wavelengths are shown in Fig. 8(A), (C) and (E). For the SNV pretreatment spectra, the number of characteristic wavelengths corresponding to the damage area, absorbed energy and maximum force were 60, 55 and 51, representing 34.1%, 31.3% and 28.9% of the full wavelengths, respectively. The locations of the characteristic wavelengths are shown in Fig. 8(B), (D) and (F). As can be seen from Fig. 8, the number of characteristic wavelengths selected by the UVE algorithm was large, with most of the characteristic wavelengths located between 600 nm–750 nm (carbohydrate absorption band) and 760 nm–950 nm (water absorption band).
 |
| | Fig. 8 The UVE algorithms select the position of the reflectance spectra characteristic wavelength. | |
3.4.2 Absorbance spectral characteristic variable selection. The characteristic wavelengths of the raw absorptance spectra were selected using the CARS and UVE algorithms, respectively, and the wavelength selection process was referred to Section 3.4.1. For the damaged area, absorbed energy and maximum force, the number of characteristic wavelengths selected by CARS were 18, 33 and 52, representing 10.2%, 18.8% and 29.5% of the full wavelengths, respectively. The positions of the characteristic wavelengths are shown in Fig. 9(A), (C) and (E), with most of the characteristic wavelengths located between 700 nm and 950 nm. The numbers of feature wavelengths selected by the UVE algorithm were 75, 96 and 73, accounting for 42.6%, 54.5% and 41.5% of the full band, respectively. The positions of the characteristic wavelengths are shown in Fig. 9(B), (D) and (F), with most of the characteristic wavelengths located between 600 nm–750 nm and 760 nm–950 nm.
 |
| | Fig. 9 The CARS and UVE algorithms select the position of the reflectance spectra characteristic wavelength. | |
3.4.3 K–M spectral characteristic wavelength selection. The characteristic wavelengths of the raw K–M spectra and the GF preprocessed spectra were selected using CARS, and the selection process is referred to in Section 3.4.1. For the raw K–M spectra, the numbers of the characteristic wavelengths corresponding to the damage area, absorbed energy and maximum force were 33, 18 and 38, representing 18.8%, 10.2% and 21.6% of the full wavelengths, respectively. The position of the characteristic wavelengths is shown in Fig. 10(A), (C) and (E). For the GF preprocessed spectra, the numbers of characteristic wavelengths corresponding to the damage area, absorbed energy and maximum force were 36, 38 and 35, accounting for 20.5%, 21.6% and 19.9% of the full wavelengths, respectively. The positions of the characteristic wavelengths are shown in Fig. 10(B), (D) and (F). It is worth noting that, unlike the R and A spectra, most of the characteristic wavelengths in the K–M spectrum were in the range of 450 nm to 550 nm. This is consistent with the findings of Yuan et al.58
 |
| | Fig. 10 The CARS algorithms select the position of the reflectance spectra characteristic wavelength. Raw = original spectrum; GF = Gaussian filter. | |
The characteristic wavelengths of the raw K–M spectra and the GF preprocessed spectra were selected by UVE algorithm, and the selection process was referred to in Section 3.4.1. For the original spectrum, the numbers of characteristic wavelengths corresponding to the damage area, absorbed energy and maximum force were 98, 68 and 114, representing 55.7%, 38.6% and 64.8% of the total wavelengths, respectively. The positions of the characteristic wavelengths are shown in Fig. 11(A), (C) and (E). For the GF preprocessed spectra, the numbers of characteristic wavelengths corresponding to the damage area, absorbed energy and maximum force were 76, 82 and 117 respectively, accounting for 43.2%, 46.6% and 66.5% of the total wavelengths, respectively. The positions of the characteristic wavelengths are shown in Fig. 11(B), (D) and (F). It can be seen from Fig. 11 that unlike the CARS algorithm, the larger number of characteristic wavelengths selected by UVE was in the range of 600 nm to 1000 nm.
 |
| | Fig. 11 The UVE algorithms select the position of the reflectance spectra characteristic wavelength. | |
3.5 Modelling based on characteristic wavelengths
The characteristic wavelengths of the three kinds of spectra (R, A and K–M) were used as input variables to establish the PLSR and SVR models. The optimal predictions for the PLSR and SVR models in the R, A and K–M spectra are shown in Table 6 (See additional information for the rest of the models, Table S1†).
Table 6 Optimal prediction results of PLSR and SVR based on characteristic wavelengthsa
| Spectra |
Model |
Mechanical parameter |
Number |
Parameter |
Model set |
Prediction set |
| RMSEC |
RC2 |
RMSEP |
RP2 |
RPD |
| Spectra: three kinds of spectra of R, A, and K–M; Number: number of characteristic wavelengths. |
| R |
SNV-PLSR |
DA (mm2) |
176 |
11 |
74.512 |
0.886 |
92.252 |
0.823 |
2.509 |
| AE (J) |
176 |
14 |
1.243 |
0.733 |
1.288 |
0.712 |
1.525 |
| MF (N) |
176 |
12 |
58.966 |
0.845 |
64.331 |
0.812 |
2.372 |
| SNV-CARS-PLSR |
DA (mm2) |
21 |
8 |
63.923 |
0.916 |
86.452 |
0.844 |
2.415 |
| AE (J) |
9 |
8 |
1.214 |
0.745 |
1.303 |
0.706 |
1.621 |
| MF (N) |
28 |
12 |
55.550 |
0.862 |
57.139 |
0.852 |
2.524 |
| SNV-UVE-SVR |
DA (mm2) |
60 |
(100,0.1,0.01) |
67.725 |
0.909 |
95.119 |
0.814 |
2.169 |
| AE (J) |
55 |
(100,0.1,0.01) |
1.281 |
0.726 |
1.378 |
0.671 |
1.465 |
| MF (N) |
51 |
(100,0.1,0.01) |
56.747 |
0.860 |
61.679 |
0.845 |
2.350 |
| A |
Raw-PLSR |
DA (mm2) |
176 |
10 |
83.074 |
0.858 |
89.882 |
0.832 |
2.538 |
| AE (J) |
176 |
14 |
1.237 |
0.728 |
1.296 |
0.723 |
1.687 |
| MF (N) |
176 |
13 |
54.531 |
0.868 |
67.223 |
0.792 |
2.199 |
| Raw-CARS-PLSR |
DA (mm2) |
18 |
7 |
65.495 |
0.911 |
85.700 |
0.848 |
2.642 |
| AE (J) |
33 |
16 |
1.239 |
0.727 |
1.316 |
0.715 |
1.622 |
| MF (N) |
52 |
10 |
58.342 |
0.849 |
59.387 |
0.838 |
2.449 |
| Raw-CARS-SVR |
DA (mm2) |
18 |
(100,0.1,0.1) |
87.125 |
0.847 |
103.390 |
0.779 |
1.923 |
| AE (J) |
33 |
(100,0.1,0.1) |
0.930 |
0.854 |
1.518 |
0.626 |
1.417 |
| MF (N) |
52 |
(100,0.1,0.1) |
41.039 |
0.926 |
81.502 |
0.719 |
1.815 |
| K–M |
GF-PLSR |
DA (mm2) |
176 |
14 |
69.621 |
0.902 |
81.841 |
0.856 |
2.603 |
| AE (J) |
176 |
13 |
1.295 |
0.730 |
1.180 |
0.850 |
1.567 |
| MF (N) |
176 |
13 |
57.915 |
0.850 |
60.685 |
0.833 |
2.438 |
| GF-CARS-PLSR |
DA (mm2) |
36 |
10 |
72.966 |
0.892 |
77.865 |
0.870 |
2.700 |
| AE (J) |
38 |
13 |
1.044 |
0.785 |
1.065 |
0.772 |
1.768 |
| MF (N) |
35 |
12 |
47.930 |
0.897 |
47.996 |
0.895 |
3.050 |
| Raw-UVE-SVR |
DA (mm2) |
98 |
(10,0.1,0.1) |
87.303 |
0.847 |
109.997 |
0.774 |
1.892 |
| AE (J) |
68 |
(10,0.1,0.1) |
1.505 |
0.644 |
1.437 |
0.578 |
1.076 |
| MF (N) |
114 |
(100,0.1,0.01) |
76.084 |
0.743 |
76.029 |
0.739 |
1.643 |
From Table 6 and additional information, Table S1† shows that in the PLSR model, the performance of the model based on the K–M spectral data outperforms that of the R and A spectra. Among these models, the PLSR model based on the characteristic wavelengths selected by CARS showed the best prediction performance. For the prediction of the damage area, absorbed energy and maximum force, the RP2 and RMSEP of the K–M-GF-CARS-PLSR model were 0.870 and 77.865 mm2, 0.772 and 1.065 J, 0.895 and 47.996 N, respectively. The values of RPD were 2.700, 1.768 and 3.050. In the SVR models, the performance of the models based on the R-spectral data outperforms that of the A-spectral and K–M spectra. Among these models, the SVR model based on the characteristic wavelengths selected by the UVE showed better predictive performance. For the prediction of the damaged area, absorbed energy and maximum force, the RP2 and RMSEP of the R-SNV-UVE-SVR model were 0.814 and 95.119 mm2, 0.671 and 1.378 J, 0.845 and 61.679 N, respectively. The values of RPD were 2.169, 1.465 and 2.350. It was notable that the prediction accuracy of the PLSR model was higher than that of the SVR model for the three kinds of spectra, which is probably due to the fact that the mechanical parameter values are more in line with the linear law of change. This was consistent with the results of the Apple study.59 In summary, for the quantitative prediction of yellow peach in terms of mechanical parameters, the K–M-GF-CARS-PLSR model provides the best prediction performance. It has fewer characteristic wavelengths (19.9–20.5% of the full band) and higher prediction accuracy.
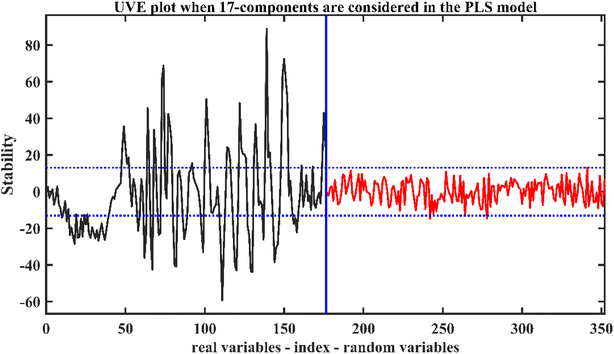
Fig. 12 shows the scatter plots of the modelling sets and prediction sets for the mechanical parameters obtained based on the K–M-GF-CARS-PLSR model. The X-axis represents the actual measured values and the Y-axis represents the predicted values. As shown in Fig. 12, the K–M-GF-CARS-PLSR model had high prediction accuracy for the damage area, absorbed energy and maximum force. In addition, the sample points in the modelling sets and prediction sets were distributed near the regression line, and the linear fit was good. This indicates that the mechanical parameters have a strong correlation with the K–M spectral data, and the K–M spectrum can be used to accurately predict the mechanical parameters of yellow peaches. Compared to the damage area and the maximum force, the correlation between the measured and predicted values of the absorbed energy was poor. The possible reason for this was that the absorbed energy produced large errors in the measurement process, resulting in the spectral information not being able to predict it accurately. In future research studies, more accurate methods will be used to obtain the absorbed energy of yellow peaches in order to reduce systematic and measurement errors, and try to improve the model or spectral analysis algorithm to improve the prediction accuracy.
 |
| | Fig. 12 Scatter plot of the mechanical parameters. (a) Damaged area; (b) absorbed energy; (c) maximum force. | |
4. Conclusion
This study focuses on comparing the quantitative predictive ability of three kinds of spectra (R, A and K–M) for mechanical parameters. Firstly, reflectance spectra (R) were obtained by a hyperspectral imaging system, and they were transformed into absorbance (A) spectra and Kubelka–Munk (K–M) spectra. Then, the R, A and K–M spectra were preprocessed by SNV, MA and GF, respectively. Finally, the characteristic wavelengths were selected by CARS and UVE algorithms, and the PLSR and SVR models were established based on the characteristic wavelengths, respectively. After analysis and comparison, the main conclusions of this research were as follows:
(a) For the SVR model, the R-SNV-UVE-SVR model based on the R spectra showed the best prediction on the damage area, absorbed energy and maximum force. However, compared with the damage area and maximum force, the prediction accuracy of the absorbed energy remained to be improved.
(b) For the PLSR model, the K–M-GF-CARS-PLSR model based on the K–M spectrum has the highest prediction accuracy for the damage area, absorbed energy and maximum force. The RP2 and RMSEP for this model were 0.870 and 77.865 mm2, 0.772 and 1.065 J, and 0.895 and 47.996 N, respectively. The values of RPD were 2.700, 1.768 and 3.050.
(c) In the R, A and K–M spectra, the prediction accuracy of the PLSR model for mechanical parameters was better than that of the SVR model.
In summary, the K–M spectra combined with the PLSR model can be used to accurately predict the mechanical parameters of impact damage, so as to realize the quantitative prediction of peach impact damage. The results of this study may provide a theoretical basis for predicting mechanical parameters using hyperspectral imaging, in addition to promoting the development of agricultural biomechanics.
Conflicts of interest
There are no conflicts of interest to declare.
Acknowledgements
The authors would like to acknowledge financial support from the National Science and Technology Award Backup Project Cultivation Plan (20192AEI91007) and the Natural Science Foundation of China (12103019).
References
- N. P. Bondonno, C. P. Bondonno and N. C. Ward, et al., The cardiovascular health benefits of apples: Whole fruit vs. isolated compounds, Trends Food Sci. Technol., 2017, 69, 243–256 CrossRef CAS.
- D. Rico, A. B. Martin-Diana and J. M. Barat, et al., Extending and measuring the quality of fresh-cut fruit and vegetables: a review, Trends Food Sci. Technol., 2007, 18(7), 373–386 CrossRef CAS.
- H. K. Celik, H. Ustun and M. Erkan, et al., Effects of bruising of 'Pink Lady' apple under impact loading in drop test on firmness, colour and gas exchange of fruit during long term storage, Postharvest Biol. Technol., 2021, 179, 111561 CrossRef CAS.
- R. Lewis, A. Yoxall and M. B. Marshall, et al., Characterising pressure and bruising in apple fruit, Wear, 2008, 264(1–2), 37–46 CrossRef CAS.
- X. Luo, T. Takahashi and K. Kyo, et al., Wavelength selection in vis/NIR spectra for detection of bruises on apples by ROC analysis, J. Food Eng., 2012, 109(3), 457–466 CrossRef CAS.
- S. Zhang, X. Wu and S. Zhang, et al., An effective method to inspect and classify the bruising degree of apples based on the optical properties, Postharvest Biol. Technol., 2017, 127, 44–52 CrossRef.
- M. Van Zeebroeck, P. Darius and B. De Ketelaere, et al., The effect of fruit properties on the bruise susceptibility of tomatoes, Postharvest Biol. Technol., 2007, 45(2), 168–175 CrossRef.
- R. Lu, Detection of bruises on apples using near–infrared hyperspectral imaging, Trans. ASAE, 2003, 46(2), 523 Search PubMed.
- Q. Zhu, J. Guan and M. Huang, et al., Predicting bruise susceptibility of ‘Golden Delicious’ apples using hyperspectral scattering technique, Postharvest Biol. Technol., 2016, 114, 86–94 CrossRef.
- U. L. Opara and P. B. Pathare, Bruise damage measurement and analysis of fresh horticultural produce—A review, Postharvest Biol. Technol., 2014, 91, 9–24 CrossRef.
- U. Kitthawee, S. Pathaveerat and T. Srirungruang, et al., Mechanical bruising of young coconut, Biosyst. Eng., 2011, 109(3), 211–219 CrossRef.
- Y. B. Öztekin and B. Güngör, et al., Determining impact bruising thresholds of peaches using electronic fruit, Sci. Hortic., 2020, 262, 109046 CrossRef.
- R. Stopa, D. Szyjewicz and P. Komarnicki, Limit values of impact energy determined from contours and surface pressure distribution of apples under impact loads, Comput. Electron. Agric., 2018, 154, 1–9 CrossRef.
- X. An, Z. Li and M. Zude-Sasse, et al., Characterization of textural failure mechanics of strawberry fruit, J. Food Eng., 2020, 282, 110016 CrossRef.
- W. Wang, H. Lu and S. Zhang, et al., Damage caused by multiple impacts of litchi fruits during vibration harvesting, Comput. Electron. Agric., 2019, 162, 732–738 CrossRef.
- Y. B. Öztekin and B. Güngör, Determining impact bruising thresholds of peaches using electronic fruit, Sci. Hortic., 2020, 262, 109046 CrossRef.
- R. Moscetti, R. P. Haff and D. Monarca, et al., Near-infrared spectroscopy for detection of hailstorm damage on olive fruit, Postharvest Biol. Technol., 2016, 120, 204–212 CrossRef.
- B. Jia, W. Wang and X. Ni, et al., Essential processing methods of hyperspectral images of agricultural and food products, Chemom. Intell. Lab. Syst., 2020, 198, 103936 CrossRef CAS.
- Q. Liu, K. Sun and J. Peng, et al., Identification of bruise and fungi contamination in strawberries using hyperspectral imaging technology and multivariate analysis, Food Anal. Methods, 2018, 11(5), 1518–1527 CrossRef.
- W. Tan, L. Sun and F. Yang, et al., Study on bruising degree classification of apples using hyperspectral imaging and GS-SVM, Optik, 2018, 154, 581–592 CrossRef.
- X. Zhu and G. Li, Rapid detection and visualization of slight bruise on apples using hyperspectral imaging, Int. J. Food Prop., 2019, 22(1), 1709–1719 CrossRef CAS.
- J. C. Keresztes, M. Goodarzi and W. Saeys, Real-time pixel based early apple bruise detection using short wave infrared hyperspectral imaging in combination with calibration and glare correction techniques, Food Control, 2016, 66, 215–226 CrossRef.
- M. H. Hu, Q. L. Dong and B. L. Liu, Classification and characterization of blueberry mechanical damage with time evolution using reflectance, transmittance and interactance imaging spectroscopy, Comput. Electron. Agric., 2016, 122, 19–28 CrossRef.
- D. Xu, H. Wang and H. Ji, et al., Quantitative evaluation of impact damage to apple by hyperspectral imaging and mechanical parameters, Food Anal. Methods, 2019, 12(2), 371–380 CrossRef.
- P. Zhang, B. Shen and H. Ji, et al., Nondestructive Prediction of Mechanical Parameters to Apple Using Hyperspectral Imaging by Support Vector Machine, Food Anal. Methods, 2022, 15(5), 1397–1406 CrossRef.
- Z. Stropek and K. Gołacki, A new method for measuring impact related bruises in fruits, Postharvest Biol. Technol., 2015, 110, 131–139 CrossRef.
- Z. Stropek and K. Gołacki, Quantity assessment of plastic deformation energy under impact loading conditions of selected apple cultivars, Postharvest Biol. Technol., 2016, 115, 9–17 CrossRef.
- H. Wang, Marker identification technique for deformation measurement, Adv. Mech. Eng., 2013, 5, 246318 CrossRef.
- X. Zhang, X. Chu and H. Ji, et al., Effect of freezing rate on the onion cell deformation evaluated by digital image correlation, Food Anal. Methods, 2016, 9(11), 3125–3132 CrossRef.
- R. Yuan, G. Liu and J. He, et al., Determination of metmyoglobin in cooked tan mutton using Vis/NIR hyperspectral imaging system, J. Food Sci., 2020, 85(5), 1403–1410 CrossRef CAS PubMed.
- X. Y. Tian, J. H. Aheto and C. Dai, et al., Monitoring microstructural changes and moisture distribution of dry-cured pork: a combined confocal laser scanning microscopy and hyperspectral imaging study, J. Sci. Food Agric., 2021, 101(7), 2727–2735 CrossRef CAS PubMed.
- Å. Rinnan, F. Van Den Berg and S. B. Engelsen, Review of the most common pre-processing techniques for near-infrared spectra, TrAC, Trends Anal. Chem., 2009, 28(10), 1201–1222 CrossRef.
- G. Wan, G. Liu and J. He, et al., Feature wavelength selection and model development for rapid determination of myoglobin content in nitrite-cured mutton using hyperspectral imaging, J. Food Eng., 2020, 287, 110090 CrossRef CAS.
- S. A. Akrami, A. El-Shafie and M. Naseri, et al., Rainfall data analyzing using moving average (MA) model and wavelet multi-resolution intelligent model for noise evaluation to improve the forecasting accuracy, Neural. Comput. Appl., 2014, 25(7), 1853–1861 CrossRef.
- N. Omar, A. Sengur and S. G. S. Al-Ali, Cascaded deep learning-based efficient approach for license plate detection and recognition, Expert Syst. Appl., 2020, 149, 113280 CrossRef.
- J. Sun, X. Shi and H. Zhang, et al., Detection of moisture content in peanut kernels using hyperspectral imaging technology coupled with chemometrics, J. Food Process Eng., 2019, 42(7), e13263 Search PubMed.
- A. Biancolillo, K. H. Liland and I. Måge, et al., Variable selection in multi-block regression, Chemom. Intell. Lab. Syst., 2016, 156, 89–101 CrossRef CAS.
- K. Xiao, Q. Liu and L. Wang, et al., Prediction of soluble solid content of Agaricus bisporus during ultrasound-assisted osmotic dehydration based on hyperspectral imaging, LWT, 2020, 122, 109030 CrossRef CAS.
- H. Wang, R. Zhang and Z. Peng, et al., Measurement of SSC in processing tomatoes (Lycopersicon esculentum Mill.) by applying Vis-NIR hyperspectral transmittance imaging and multi-parameter compensation models, J. Food Process Eng., 2019, 42(5), e13100 Search PubMed.
- X. Wei, Y. Zhang and D. Wu, et al., Rapid and non-destructive detection of decay in peach fruit at the cold environment using a self-developed handheld electronic-nose system, Food Anal. Methods, 2018, 11(11), 2990–3004 CrossRef.
- F. Shen, Q. Wu and P. Liu, et al., Detection of Aspergillus spp. contamination levels in peanuts by near infrared spectroscopy and electronic nose, Food Control, 2018, 93, 1–8 CrossRef CAS.
- M. Zhao, C. Esquerre and G. Downey, et al., Process analytical technologies for fat and moisture determination in ground beef-a comparison of guided microwave spectroscopy and near infrared hyperspectral imaging, Food Control, 2017, 73, 1082–1094 CrossRef CAS.
- P. Geladi and B. R. Kowalski, Partial least-squares regression: a tutorial, Anal. Chim. Acta, 1986, 185, 1–17 CrossRef CAS.
- J. Sun, G. Wang and H. Zhang, et al., Detection of fat content in peanut kernels based on chemometrics and hyperspectral imaging technology, Infrared Phys. Technol., 2020, 105, 103226 CrossRef CAS.
- Y. Bai, Z. Sun and B. Zeng, et al., A comparison of dimension reduction techniques for support vector machine modeling of multi-parameter manufacturing quality prediction, J. Intell. Manuf., 2019, 30(5), 2245–2256 CrossRef.
- Y. Shao, Y. Liu and G. Xuan, et al., Application of hyperspectral imaging for spatial prediction of soluble solid content in sweet potato, RSC Adv., 2020, 10(55), 33148–33154 RSC.
- R. M. Balabin and E. I. Lomakina, Support vector machine regression (SVR/LS-SVM)—an alternative to neural networks (ANN) for analytical chemistry? Comparison of nonlinear methods on near infrared (NIR) spectroscopy data, Analyst, 2011, 136(8), 1703–1712 RSC.
- H. Husnizar, W. Wilopo and A. T. Yuliansyah, The prediction of heavy metals lead (Pb) and zinc (Zn) contents in soil using NIRs technology and PLSR regression method, J. Degrade. Min. Land Manage., 2018, 5(3), 1153 CrossRef.
- A. Rohman, A. Windarsih and S. Riyanto, et al., Fourier transform infrared spectroscopy combined with multivariate calibrations for the authentication of avocado oil, Int. J. Food Prop., 2016, 19(3), 680–687 CrossRef CAS.
- A. Fadeyibi, Modeling Rheological Behavior of Beef based on Time-Dependent Deformation and Packaging, Gazi Univ. J. Sci., 2021, 35(3), 997–1008 Search PubMed.
- E. Purlis, C. Cevoli and A. Fabbri, Modelling volume change and deformation in food products/processes: An overview, Foods, 2021, 10(4), 778 CrossRef CAS PubMed.
- Z. Stropek and K. Gołacki, Impact characteristics of pears, Postharvest Biol. Technol., 2019, 147, 100–106 CrossRef.
- X. Luo, T. Takahashi and K. Kyo, et al., Wavelength selection in vis/NIR spectra for detection of bruises on apples by ROC analysis, J. Food Eng., 2012, 109(3), 457–466 CrossRef CAS.
- W. H. Lee, M. S. Kim and H. Lee, et al., Hyperspectral near-infrared imaging for the detection of physical damages of pear, J. Food Eng., 2014, 130, 1–7 CrossRef.
- A. Siedliska, P. Baranowski and W. Mazurek, Classification models of bruise and cultivar detection on the basis of hyperspectral imaging data, Comput. Electron. Agric., 2014, 106, 66–74 CrossRef.
- S. Yin, X. Bi and Y. Niu, et al., Hyperspectral classification for identifying decayed oranges infected by fungi, Emir. J. Food Agric., 2017, 601–609 CrossRef.
- R. Lu, H. Cen and M. Huang, et al., Spectral absorption and scattering properties of normal and bruised apple tissue, Trans. ASABE, 2010, 53(1), 263–269 Search PubMed.
- R. Yuan, M. Guo and C. Li, et al., Detection of early bruises in jujubes based on reflectance, absorbance and Kubelka-Munk spectral data, Postharvest Biol. Technol., 2022, 185, 111810 CrossRef CAS.
- P. Zhang, H. Ji and H. Wang, et al., Quantitative evaluation of impact damage to apples using NIR hyperspectral imaging, Int. J. Food Prop., 2021, 24(1), 457–470 CrossRef CAS.
|
| This journal is © The Royal Society of Chemistry 2022 |
Click here to see how this site uses Cookies. View our privacy policy here. 
 Open Access Article
 This Open Access Article is licensed under a Creative Commons Attribution-Non Commercial 3.0 Unported Licence
 ,
Hai Yin,
Jiping Zou and
Aiguo Ou-yang
,
Hai Yin,
Jiping Zou and
Aiguo Ou-yang