
 Open Access Article
 This Open Access Article is licensed under a Creative Commons Attribution-Non Commercial 3.0 Unported Licence
Losartan as an ACE inhibitor: a description of the mechanism of action through quantum biochemistry
Eveline M. Bezerra†
 *ad,
Érika C. de Alvarenga†b,
Ricardo P. dos Santos†c,
Jeanlex S. de Sousa†d,
Umberto L. Fulco†e,
Valder N. Freire†d,
Eudenilson L. Albuquerque†e and
Roner F. da Costa†a
*ad,
Érika C. de Alvarenga†b,
Ricardo P. dos Santos†c,
Jeanlex S. de Sousa†d,
Umberto L. Fulco†e,
Valder N. Freire†d,
Eudenilson L. Albuquerque†e and
Roner F. da Costa†a
aPrograma de Pós-Graduação em Ciência e Engenharia de Materiais (PPgCEM), Universidade Federal Rural do Semi-Árido (UFERSA), CEP 59625-900, Mossoró, RN, Brazil. E-mail: eveline@fisica.ufc.br; roner.costa@ufersa.edu.br
bDepartamento de Ciências Naturais, Universidade Federal de São João del-Rei (UFSJ), CEP 36307-352, São João del-Rei, MG, Brazil. E-mail: erika.fisio@ufsj.edu.br
cEngenharia da Computação, Universidade Federal do Ceará (UFC), CEP 62010-560, Sobral, CE, Brazil. E-mail: rpsantos2007@gmail.com
dDepartamento de Física, Universidade Federal do Ceará (UFC), CEP 60440-900, Fortaleza, CE, Brazil. E-mail: jeanlex@fisica.ufc.br; valder@fisica.ufc.br
eDepartamento de Biofísica e Farmacologia, Universidade Federal do Rio Grande do Norte (UFRN), CEP 59064-741, Natal, RN, Brazil. E-mail: umbertofulco@gmail.com; eudenilson@gmail.com
First published on 5th October 2022
Abstract
Losartan (LST) is a potent and selective angiotensin II (Ang II) type 1 (AT1) receptor antagonist widely used in the treatment of hypertension. The formation of Ang II is catalyzed by the angiotensin I-converting enzyme (ACE) through proteolytic cleavage of angiotensin I (Ang I), which is involved in the control of blood pressure. Despite the vast literature on the relationship of losartan with the renin–angiotensin system (RAS), the actions of losartan on the sACE enzyme are so far poorly understood. In view of this, we investigated how losartan can interact with the sACE enzyme to block its activity and intracellular signaling. After performing docking assays following quantum biochemistry calculations using losartan and sACE crystallographic data, we report that their interaction results reveal a new mechanism of action with important implications for understanding its effects on hypertension.
1 Introduction
Hypertension is one of the most important causes of premature death worldwide and the problem is growing; in 2025, an estimated 1.56 billion adults will be living with hypertension.1 Elevated Blood Pressure (BP) has been considered like the most important modifiable risk factor for cardiovascular disease (CVD). Hypertension may be either systolic (pressure against arterial wall during heart contraction) or diastolic (pressure against arterial wall at rest) as defined by the blood pressure recording (systolic/diastolic). If the pressure is high for prolonged periods of time, it leads to damage of the arterial wall, which in turn predisposes to atherosclerosis with thickening of the arterial wall and narrowing of the arterial diameter. This chronic disease may be treated with several agents, including beta-blockers, diuretics, and angiotensin converting enzyme (ACE) inhibitors, in addition, lifestyle changes that include dietary interventions (reducing salt, increasing potassium, alcohol avoidance, and multifactorial diet control), weight reduction, tobacco cessation, physical exercise, and stress management help in the treatment.2,3The renin–angiotensin system (RAS) has been demonstrated to be a key element in blood pressure regulation and fluid volume homeostasis.4 In this system, renin breaks the peptide angiotensinogen, producing angiotensin, which circulates in the body. In pulmonary vessels, angiotensin I interacts with the angiotensin converting enzyme (ACE), which produces the octapeptide hormone angiotensin II (Ang II).5 Angiotensin II, in turn can interact with the AT1 receptor (Angiotensin II type 1 receptor) triggering vasoconstriction or AT2 (Angiotensin II type 2 receptor), leading to vasodilation. When Ang II binds to the AT1 receptor, it activates phospholipase C (PLC), which generates diacylglycerol (DAG) and inositol triphosphate (IP3).4 These molecules promote activation of the proteins kinase C and Ca2+ released from the intracellular stores.4 Calcium signaling activates myosin light chain kinase (MLCK), which phosphorylates the myosin light chain (MLC) and promotes blood vessel smooth muscle contraction and elevation of blood pressure.
The role of RAS in hypertension pathophysiology has been widely explored for therapy.6,7 ACE inhibitors block the Ang II formation and inhibit the aldosterone release, which promotes vasodilation. As a selective ACE inhibitor, lisinopril (LPR) blocks the formation of Ang II, so the prescription of other RAS blocking drugs is highly recommended. Losartan, which has been described in the literature as an AT1 receptor antagonist, has antihypertensive efficacy similar to that of an ACE inhibitor, with the advantage of not generating accumulation of bradykinin (BK), whose accumulation in the lungs causes coughing.8 Information on antihypertensive drugs that may be the first choice for the treatment of arterial hypertension, classified by mechanisms of action and with recommended doses and dose ranges are found in several published clinical trials.9–14
Recent in vitro studies have demonstrated crosstalk between the biochemical pathways in RAS.17 Guimarães et al.17 performed an in vitro study through cell models with Chinese hamster ovary cells (CHO-ACE) and melanoma cells (Tm5) to express the ACE enzyme and found that Ang II can bind to ACE with high affinity. Furthermore, it was shown that Ang II is able to bind to and activate ACE, an important receptor in melanoma cells, promoting cell proliferation and migration effects.18 To further confirm your data, Guimarães et al.17 performed competitive binding assays using radiolabeled AngII (3H-Ang II and 125I-Ang II), Ang II, lisinopril and losartan as competitors. The results obtained in this competitive binding assay show that lisinopril and losartan bind to the CHO-ACE with respective IC50, 0.80 ± 0.02 and 0.40 ± 0.17. In this context, the understanding of the interaction of losartan (LST) and ACE (EC 3.4.15.1) is particularly important to assist the development of new effective drugs for hypertension therapy. For that purpose, we take full advantage of published crystallographic data from the N domain of human somatic angiotensin I-converting enzyme (sACE) complexed with the inhibitor lisinopril (PDB ID 2C6N),15 see Fig. 1, to perform computer simulations in docking and ab initio quantum mechanical approaches. The latter is based on the density functional theory (DFT) formalism, in the framework of molecular fragmentation with conjugate caps (MFCC) strategy,19 to investigate the details of the binding interaction energy from lisinopril (LPR) and losartan (LST) to sACE. The techniques of Quantum Biochemistry and the MFCC scheme have been widely applied to calculate the energy of interaction between proteins and ligands and are contributing to explain and/or unravel new mechanisms of action of several drugs that are already widely used in medicine today.20–24
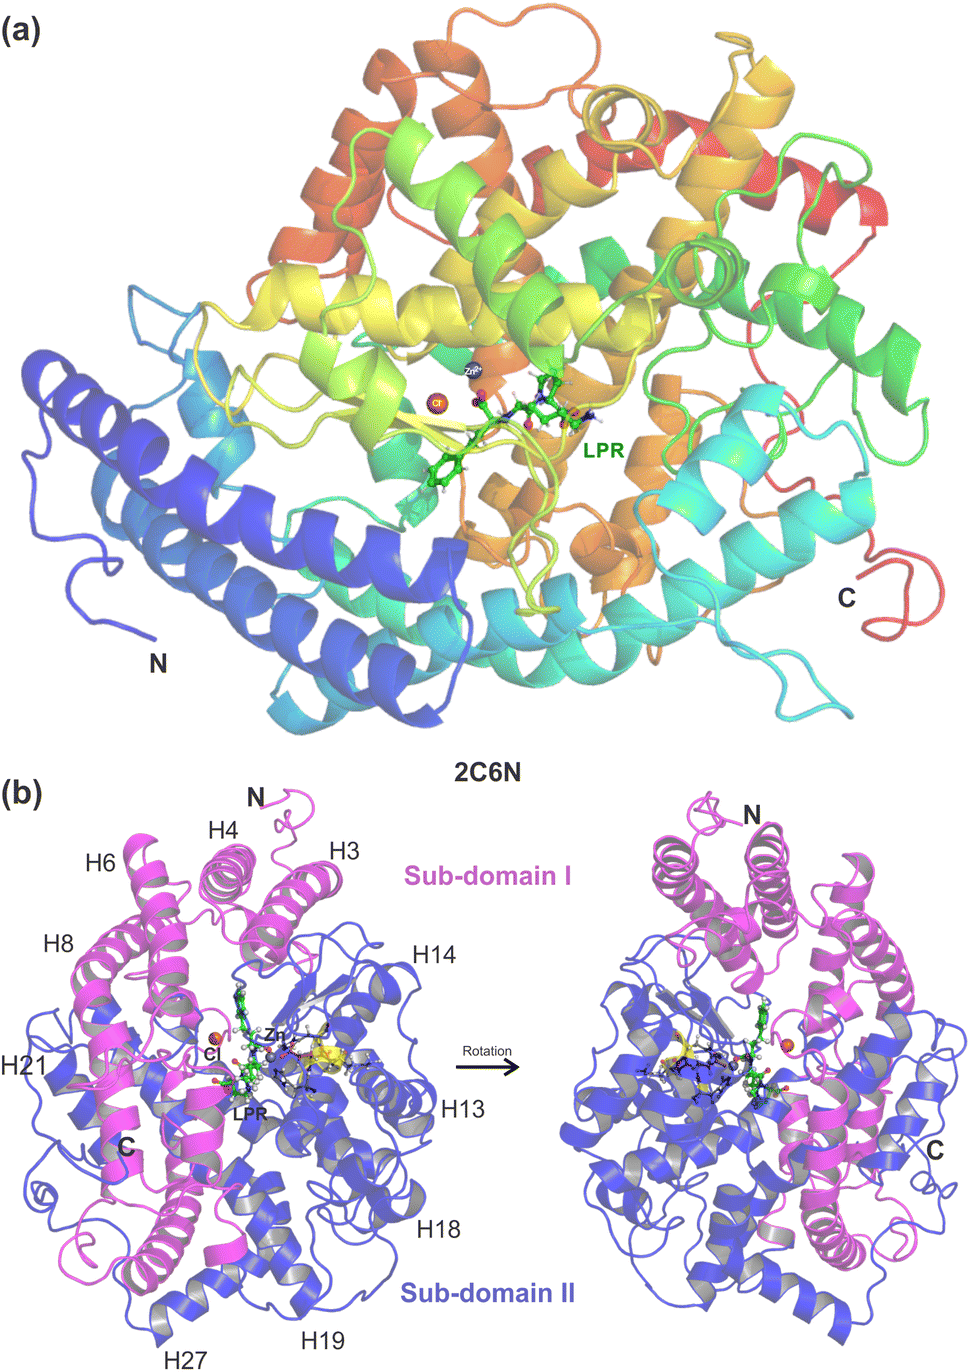 | ||
| Fig. 1 (a) Overview of the sACE structure co-crystallized with the inhibitor lisinopril (LPR). Cartoon representation of the N domain of the human somatic angiotensin I-converting enzyme with LPR obtained through X-ray diffraction by Corradi et al., PDB 2C6N,15 showing ball and stick representation of LPR (carbon in green), zinc ion (grey), chloride ion (orange), illustrating the α-helix and β-strand secondary structure elements. (b) The N domain divided into two halves, namely the sub-domains I and II, shown in pink and blue, respectively. The catalytic domain of sACE (shown in yellow) contains the HEMGH zinc-binding motif. The figure was drawn using PyMOL16 (PyMOL Molecular Graphics System; https://www.pymol.org). | ||
2 Materials and methods – in silico studies
2.1 Structural data
All computational simulations in this work took full advantage of the N domain of the human somatic angiotensin I-converting enzyme complexed with the inhibitor lisinopril (LPR), determined through X-ray diffraction by Corradi et al.15 (see Fig. 1). The 3D structure was downloaded from the PDB database (https://www.rcsb.org), PDB ID 2C6N, at high resolution of 3.0 Å and pH 7.4, but the hydrogen atoms were not resolved. The hydrogens were added to the structure and then submitted to classical geometry optimization with the specific peptide and protein consistent valence force field (CVFF)25 with the atomic positions of the non-hydrogen atoms kept fixed. The protonation state of the receptor was adjusted according to results obtained from the Marvin Sketch code version 5.3.2 (Marvin Beans Suite, ChemAxon) at physiological pH. The corresponding structures are shown with ball and stick representation in Fig. 2 for the molecules LPR (C21H31N3O5, green balls) and LST (C22H24ClN6O, Drugbank DB00678, light blue balls). The method used here is similar to that used in early works.20–23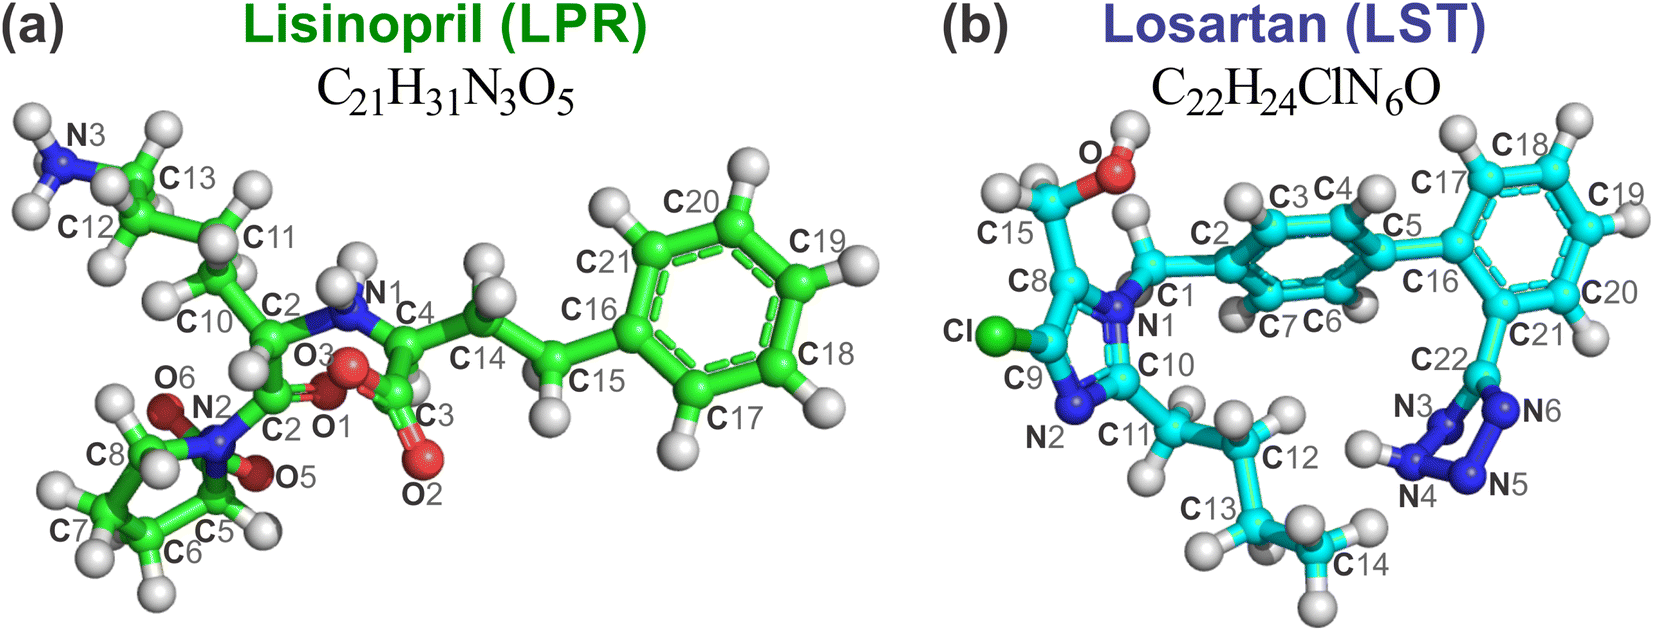 | ||
| Fig. 2 Ball and stick representation of (a) lisinopril (LPR, C21H31N3O5) and (b) losartan (LST, C22H24ClN6O) with atom labels. The carbons of each of the ligands are colored differently (LPR in green balls and LST in light blue balls), while non-carbon atoms are colored by atom type (oxygen in red, nitrogen in blue, chloride in green and zinc ion in grey). The figure was drawn using PyMOL16 (PyMOL Molecular Graphics System; https://www.pymol.org). | ||
2.2 Molecular docking
The geometric optimization of the isolated losartan (LST) molecule (Fig. 2b) was performed using the semiempirical Hamiltonian PM7 (ref. 26) package in the MOPAC2012 program (https://openmopac.net). The crystallographic structure of the lisinopril (LPR, Fig. 2a) with sACE (LPR–sACE complex) was obtained from the RCSB Protein Data Bank (PDB ID 2C6N15). To identify potential binding sites, molecular docking was carried out employing automated docking in the AutoDocking Vina program (Molecular Graphics Lab).27 The ligand used was optimized LST, and the target was sACE after the removal of the LPR in the LPR–sACE complex. During the docking procedure, all rotatable bonds within the ligands were allowed to rotate freely while the protein target was kept rigid. The spacing consisted of 1 Å and the exhaustiveness was set at 200. All other docking parameters were used as defaults. The conformation generated with the lowest binding free energy was accepted as the most probable model of interaction. Thus, the best LST pose was selected based on the best-ranked conformation of the ligand in the sACE, and used for the setup of the LST–sACE complex. Molecular graphics were performed using the UCSF Chimera 1.8 package (Resource for Biocomputing, Visualization, and Informatics at the University of California, San Francisco).282.3 Molecular fractionation with conjugate caps (MFCC)
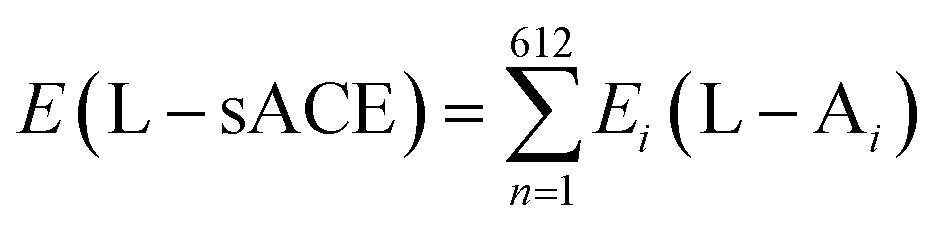
Afterwards, simulations within the density functional theory (DFT) formalism using the local density approximation (LDA) for the exchange-correlation functional (DFT/LDA) were carried out using the Materials Studio DMol3 modelling program.29–31 Considering the need to achieve the best balance between computational cost per simulation run and the size of the ligand–protein binding site complex investigated, as well as the dominant character of non-covalent dispersive forces present therein, we chose the LDA functional approach to estimate the strength of the ligand–amino acid intermolecular interaction energies. This enabled ascertaining the interaction energies between the sACE inhibitors (LPR and LST) and each of the sACE amino acids with good estimation and, additionally, obtaining the total interaction energy by adding all the interaction energies of the individual amino acids. A double numerical plus polarization (DNP) basis set was chosen to expand the electronic Kohn–Sham orbitals considering all electrons explicitly and with unrestricted spin. The orbital cutoff radius for this basis set was set to 3.7 Å and the self-consistent field convergence threshold was adjusted to 10−6 Eh. The hydrogen atomic position of the system formed by the sACE ligands (LST and LPR) and the sACE were optimized classically and by using the DFT approach, with convergence tolerances se to 10−5 Eh for the maximum force per atom and 0.005 Å for the maximum atomic displacement, with non-hydrogen atoms kept fixed.The structures of the LPR–sACE complex (obtained from the Protein Data Bank, PDB ID 2C6N) and LST–sACE complex (obtained by molecular docking as previously described) were used as inputs for calculations of interaction energies of sACE ligands (LPR and LST) with all amino acids of the sACE. The interaction energies were estimated using the MFCC (Molecular Fractionation with Conjugate Caps) method,19,21–23,32–36 considering the caps as the neighbouring amino acids with the broken peptide bond completed with a hydrogen atom. Therefore, the total interaction energy of the L–sACE (LPR– and LST–sACE) complex is given by:
 | (1) |
| Ei(L–Ai) = EA(L + Ai−1AiAi+1 + S1 + S2) − EB(Ai−1AiAi+1 + S1 + S2) − EC(L + Ai−1 + Ai+1 + S1 + S2) + ED(Ai−1 + Ai+1 + S1 + S2) | (2) |
Here the Ai−1 and Ai+1 caps are the first neighboring amino acids on both sides of the amino acid Ai with the broken peptide bond completed with a hydrogen atom. On the right hand side of eqn (1), EA is the total energy of the system formed by the ligand molecule, the amino acid (Ai), the first neighboring amino acids (Ai−1 and Ai+1) of the Ai and shields (S1 and S2); the EB term is the total energy of the amino acid (Ai), the first neighboring amino acids (Ai−1 and Ai+1) of Ai and shields (S1 and S2) alone; EC is the total energy of the system formed by the ligand molecule, the first neighboring amino acids (Ai−1 and Ai+1) of the Ai and shields (S1 and S2) alone; finally, ED is the total energy of the system formed only by the first neighboring amino acids (Ai−1 and Ai+1) of Ai and shields (S1 and S2).
Also, we used a shield (S1) from all charged amino acids due to the long-range interaction with the zinc ion present in the binding pocket of the sACE. In this case, five amino acids that belonging to the zinc site (His361, Glu362, Met363, Gly364 and His365), were used, as depicted in Fig. 3a. In addition, shield (S2) was also formed with a layer of amino acid residues within a radius of 3.0 Å measured from the ligands, with the 14 amino acids for S2-LPR (Gln259, His331, Ala332, Ser333, Gln355, Thr358, Glu362, Glu389, Lys489, Phe490, His491, Thr496, Tyr498 and Tyr501) – see Fig. 3b – and 14 amino acids for S2-LST (Trp257, Gln259, Ser260, Glu262, His331, Asp354, Ser357, Thr358, Glu389, Glu431, Lys432, Lys489, Tyr501 and Phe505) – see Fig. 3c.
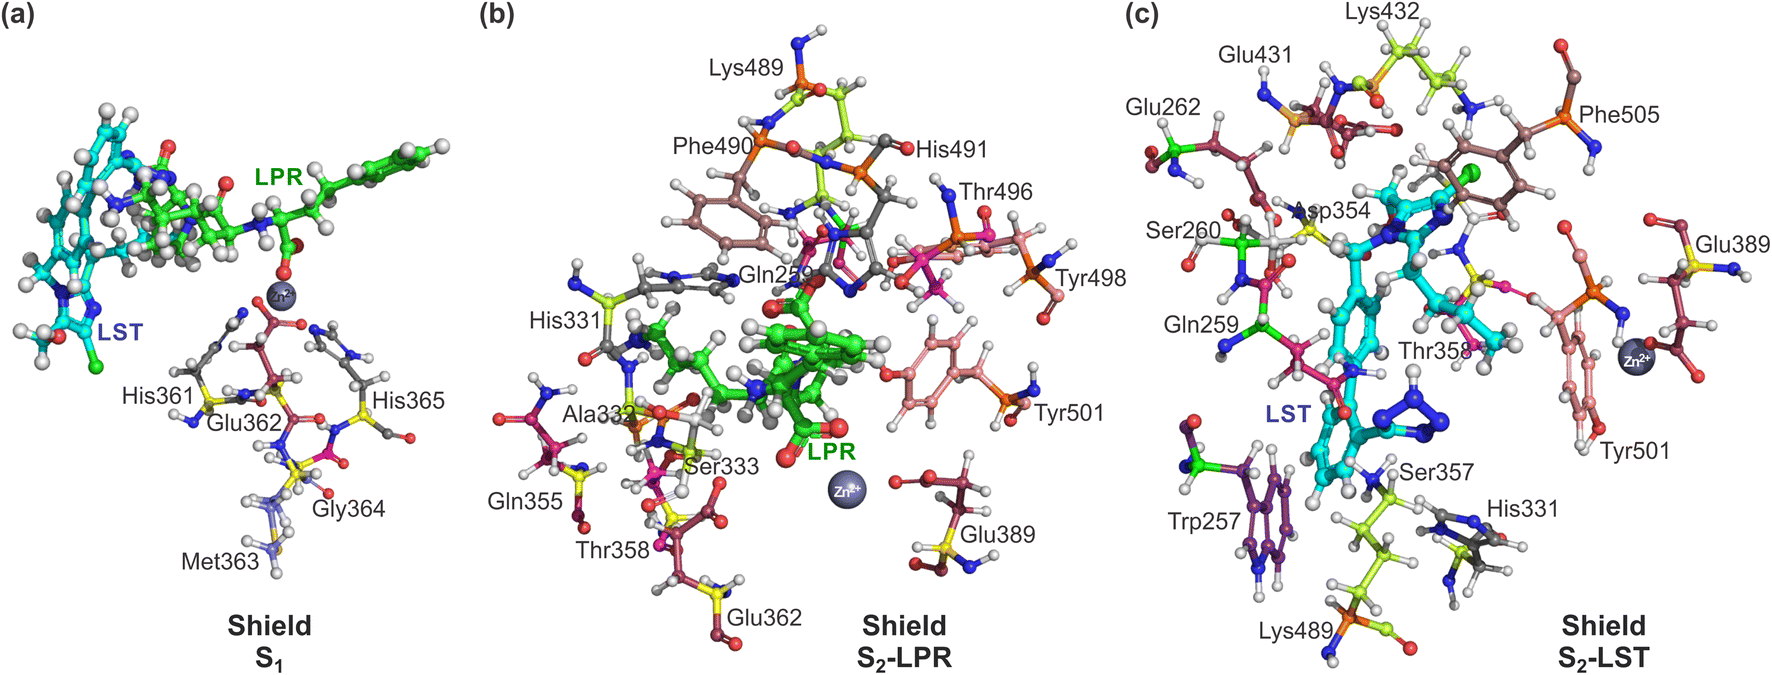 | ||
| Fig. 3 Ball and stick representation of lisinopril (LPR) and losartan (LST) with amino acid shield S1, S2-LPR and S2-LST. Superposition in the same orientation with the zinc binding pocket of the sACE, (a) shield S1, formed by 5 amino acids (His361, Glu362, Met363, Gly364 and His365) for LPR and LST; (b) shield formed by amino acid residues within 3 Å with 14 amino acids for S2-LPR (Gln259, His331, Ala332, Ser333, Gln355, Thr358, Glu362, Glu389, Lys489, Phe490, His491, Thr496, Tyr498 and Tyr501); and (c) shield formed by amino acid residues within 3 Å with 14 amino acids for S2-LST (Trp257, Gln259, Ser260, Glu262, His331, Asp354, Ser357, Thr358, Glu389, Glu431, Lys432, Lys489, Tyr501 and Phe505). The carbons of each of the ligands are colored differently (LPR in green and LST in light blue) and non-carbon atoms are colored according to atom type (oxygen in red, nitrogen in blue, chloride in green and zinc ion in grey). All residues are labeled appropriately. The figure was drawn using PyMOL16 (PyMOL Molecular Graphics System; https://www.pymol.org). | ||
For both shields (S1 and S2) the amino acids residues were used in all the calculations of the interaction energy to obtain a better description of the sACE ligands with sACE protein. Except when the amino acid of interest (Ai) was that present in the shields, it was considered as in eqn (2). Following the same procedures described in the previous published work for statin-HMG-CoA reductase,20 the total energy between L and Ai was estimated as in eqn (1).
3 Results and discussion
3.1 Losartan interacts with sACE enzyme according to in silico studies
Losartan is a well-known AT1 antagonist used as an oral anti-hypertensive drug, but its actions on ACE activity is still unclear. ACE is involved in blood pressure control by catalyzing the conversion of Ang I into the vasoconstriction Ang II and degrading the vasodilator peptide bradykinin (BK). AngII interacts with AT1 receptors, which are part of the group of receptors coupled to protein G, increasing the production of IP3 and DAG by phospholipase C, besides triggering intracellular calcium signaling. Losartan blocks AT1 receptors and intracellular calcium signaling promoting vasodilatation.ACE inhibitors have different chemical structures allowing them to interact with the binding site, enzymes in general, specifically and with greater (smaller) affinity. Based on this, the development of new antihypertensive drugs should take into account structural information from model systems such as carboxypeptidase,37 AnCE,20 ACEt,21 sACE,15 etc., which can contribute decisively to the development of more potent and specific inhibitors with fewer side effects. Here, we used crystallographic data of the sACE as a model system to describe the intermolecular interaction with two sACE ligands, LPR and LST.
To understand the relationship between LST and ACE, we first performed docking assays using sACE crystallographic data. We observed that LST can interact with sACE in the same binding pocket as LPR.
3.2 Molecular docking
At first, we performed a molecular docking analysis of the interaction of the losartan (LST) with the sACE. The best-ranked docking pose from LST in the sACE binding pocket via non-covalent interaction is shown in Fig. 4. Furthermore, Fig. 3a depicts the superposition of the ligands (LST and LPR) with the zinc binding pocket formed by the five amino acids (His361, Glu362, Met363, Gly364 and His365), which were used for the S1 shield.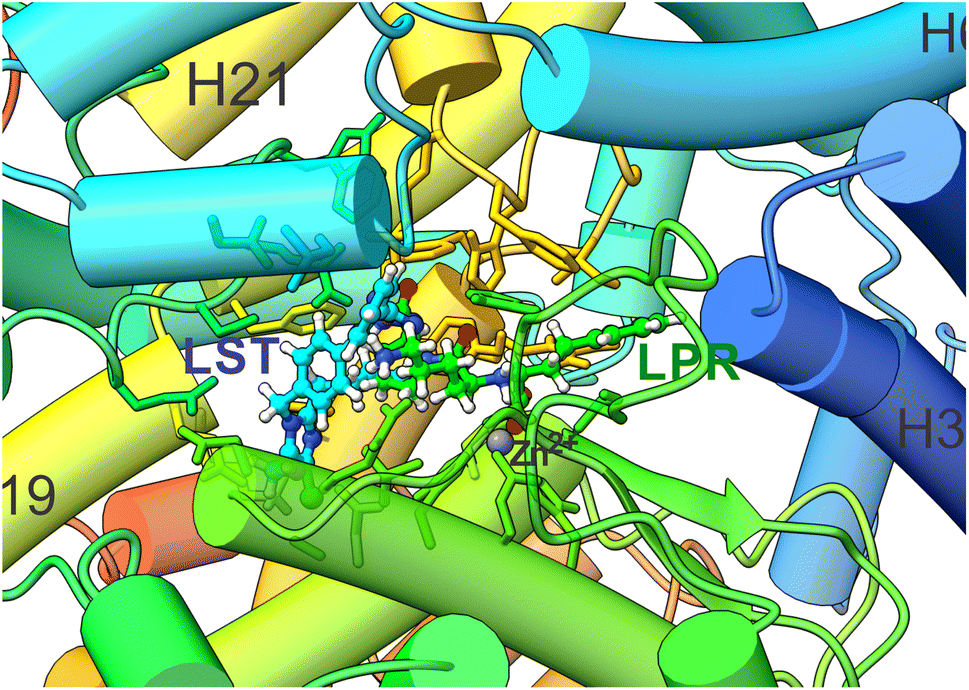 | ||
| Fig. 4 Cartoon representation of the structural superimposition of the binding of LPR (PDB 2C6N) and the best LST pose after flexible docking in the sACE binding pocket to sACE. The carbons of each of the ligands are colored differently (LPR in green and LST in light blue) and non-carbon atoms are colored by atom type (oxygen in red, nitrogen in blue, chloride in green and zinc ion in grey). The figure was performed using the UCSF Chimera 1.15 package (Resource for Biocomputing, Visualization, and Informatics at the University of California, San Francisco, https://www.cgl.ucsf.edu/chimera).28 | ||
3.3 MFCC
One of the most important aspects of this work is the determination of the interaction energy of each amino acid of the sACE protein with its respective ligands (LPR and LST) through the MFCC method. The application of fragmentation strategies allows discerning several properties of the drug–protein complex.24 From the results of the interaction energies of each amino acid with each ligand, the following results were obtained: (a) the total interaction energy of the ligand–sACE system, as well as the energy profile of each ligand (LPR and LST) with the sACE protein, represented in Fig. 5; (b) the interaction energy surface, see Fig. 6; and (c) the BIRD panel (Fig. 7), highlighting the key amino acids of the ligand–sACE interaction.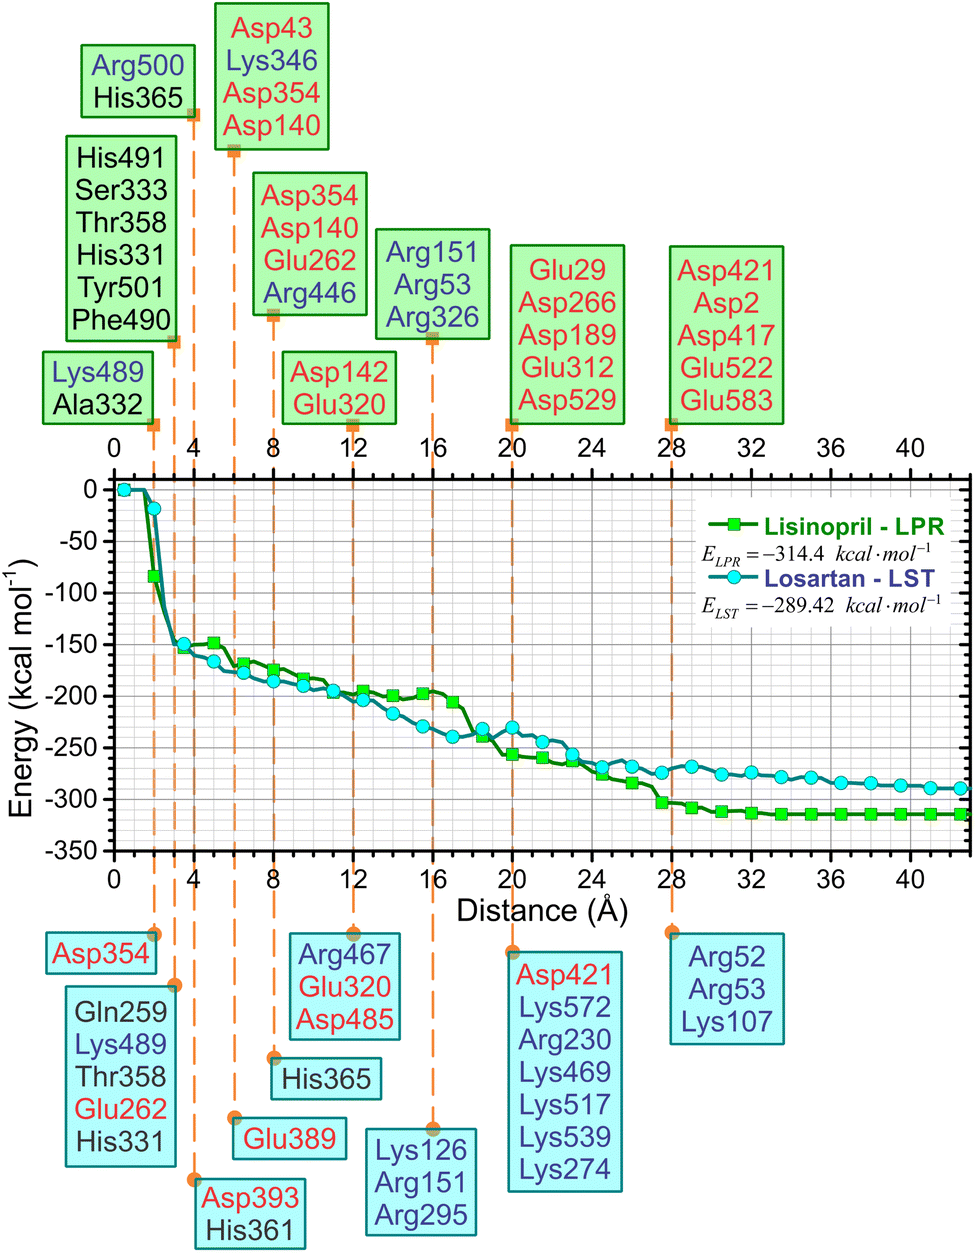 | ||
| Fig. 5 Total interaction energy of the LPR–sACE system (green solid squares) and LST–sACE system (light blue solid circles) as a function of the binding pocket radius using the MFCC method – key amino acids involved in the binding interaction are indicated for LPR–sACE (green rectangles, top) and LST–sACE (blue rectangles, bottom) grouped by the distance to the ligand indicated by the vertical dashed orange lines. Red (blue) color stands for negatively (positively) charged amino acids. | ||
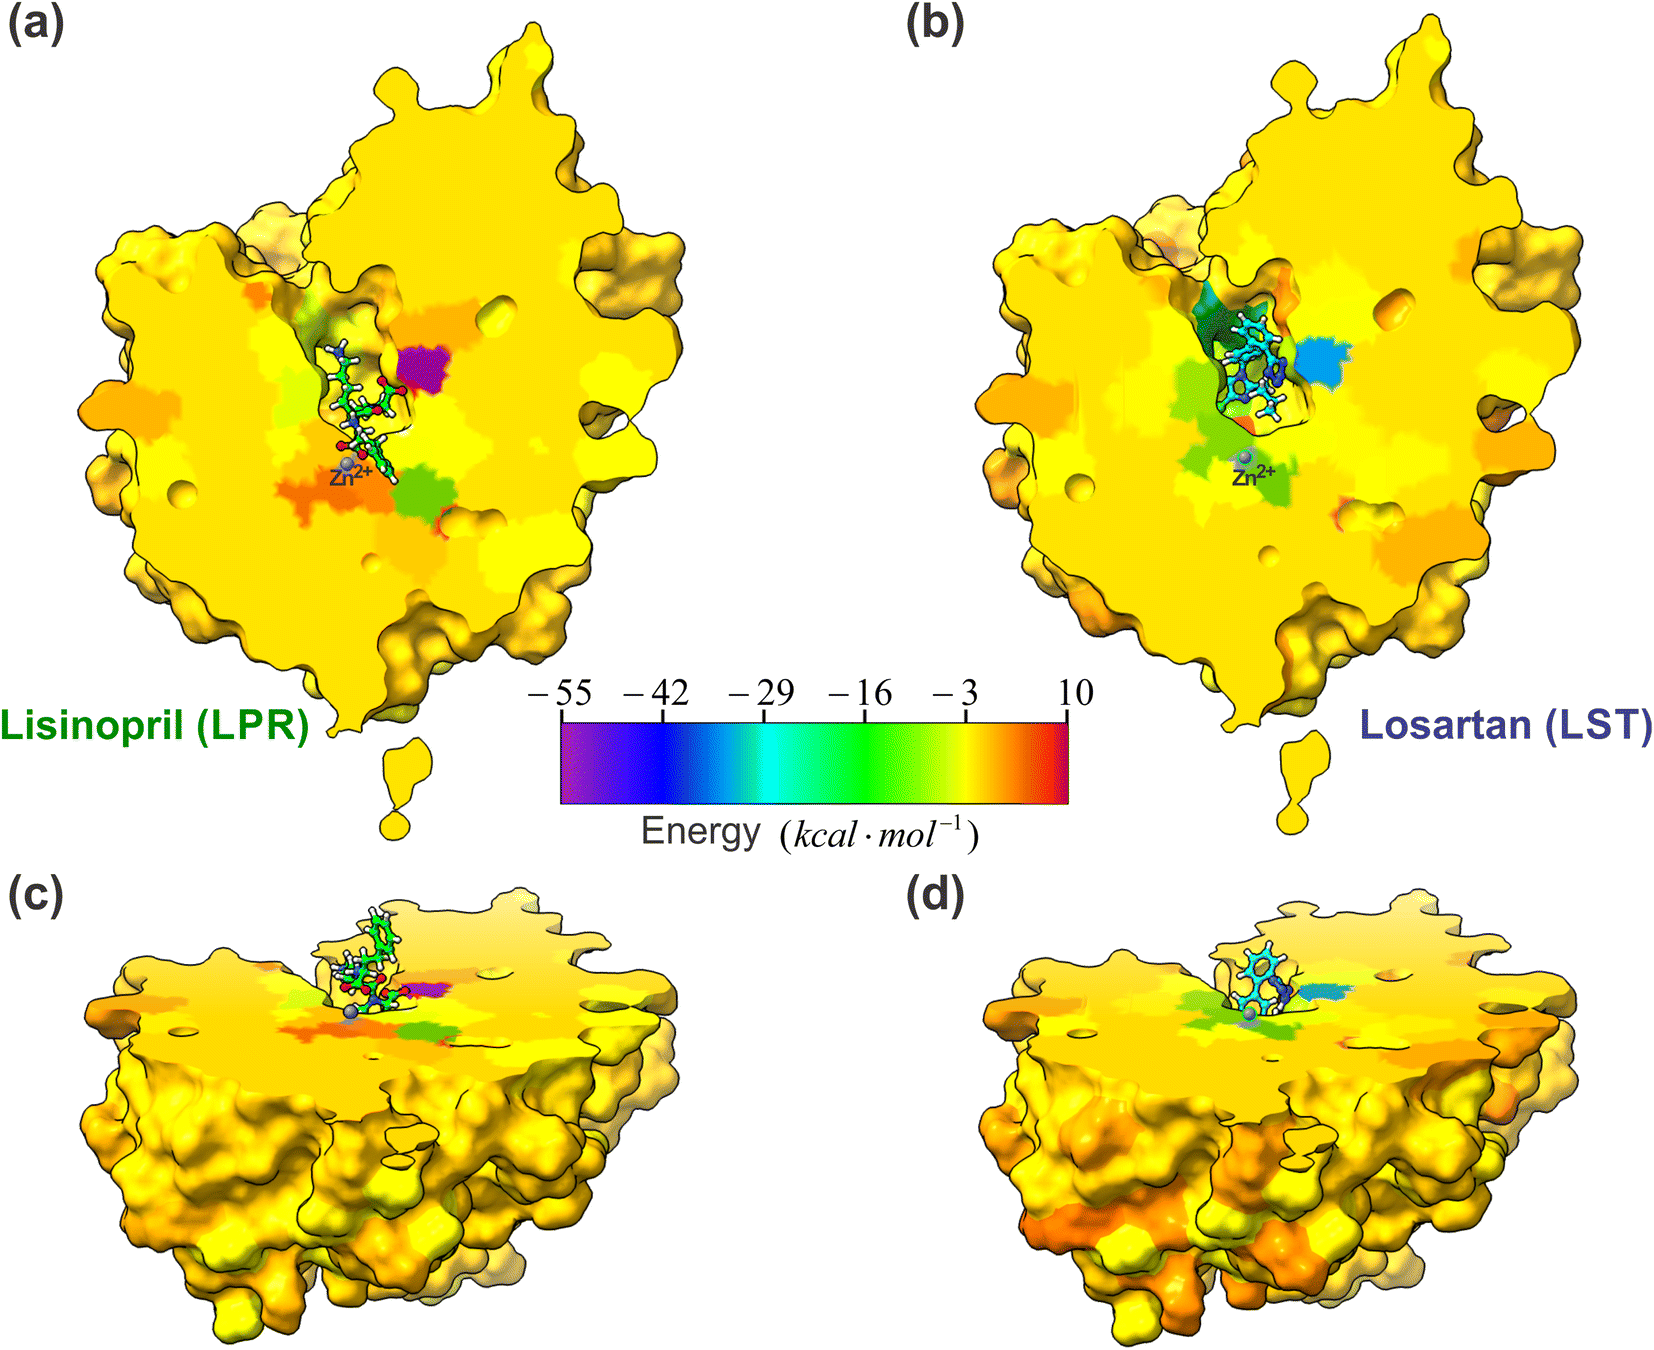 | ||
| Fig. 6 A projections of the interaction energy, Ei(L–Ai), with ligands (LPR and LST) and sACE for each amino acid are color-coded and mapped onto the molecular surface, according to the scale bar. The scale bar indicates that the interaction energy ranges between −55 kcal mol−1 (purple) and 10 kcal mol−1 (dark red). The sACE is displayed in the same orientation as LPR–sACE (a) and LST–sACE (b), with ligands shown in ball and stick representation. In (c) LST–sACE and (d) LPR–sACE the view is rotated by 60° along the x axis, as compared to (a) and (b), respectively, showing the surface along the protein. The carbons of each of the ligands are colored differently (LPR in green and LST in light blue) and non-carbon atoms are colored by atom type (oxygen in red, nitrogen in blue, chloride in green and zinc ion in grey). The figure was obtained using the UCSF Chimera 1.15 package (Resource for Biocomputing, Visualization, and Informatics at the University of California, San Francisco, https://www.cgl.ucsf.edu/chimera).28 | ||
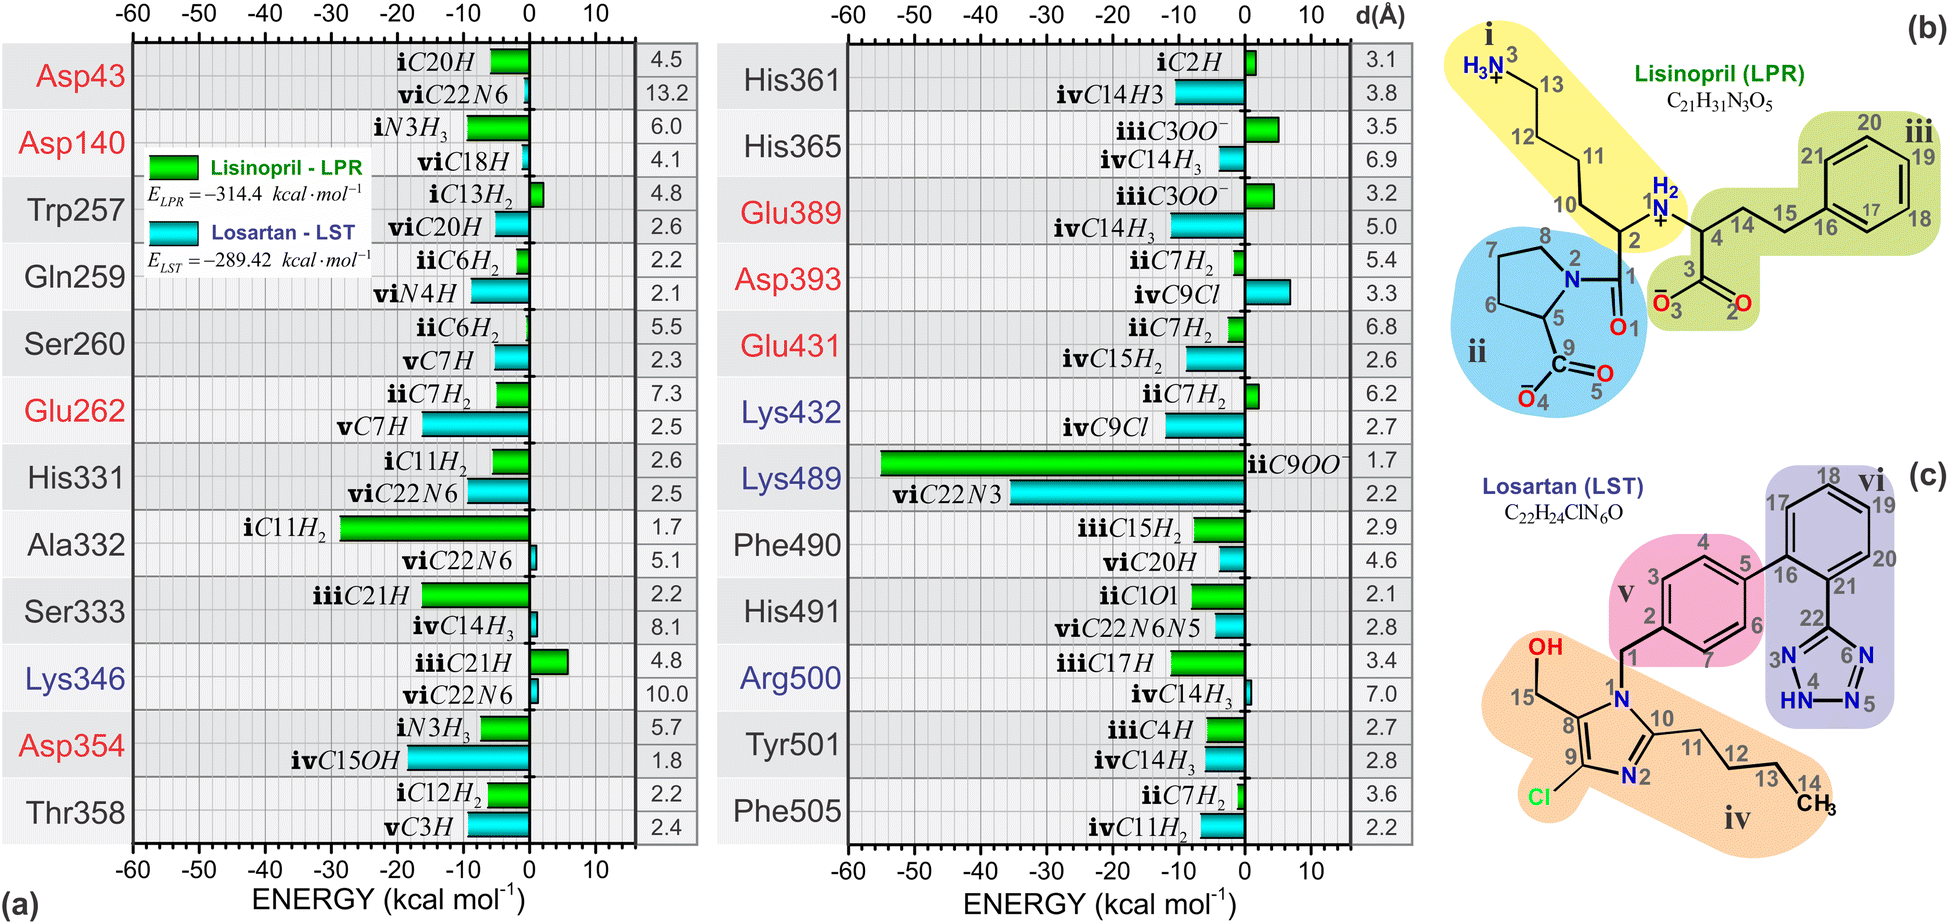 | ||
| Fig. 7 (a) Binding site, interaction energy and residue domain (BIRD) graphic panel with the main amino acid residues of sACE and their interaction energy contributions to LPR (green bars) and LST (light blue bars). The closest LPR and LST atoms are indicated at the side of each bar. Red (blue) color stands for negatively (positively) charged amino acid residues. The planar representation of the (b) LPR and (c) LST molecules are subdivided into three parts “i” (yellow), “ii” (green) and “iii” (blue) for LPR and “iv” (purple), “v” (pink) and “vi” (orange) for LST, with atoms labeled to facilitate the analysis of their interaction with the sACE target protein. | ||
Up to 2.0 Å, there is a strong increase in the interaction energy in modulus (decline in the graph line), caused by the interaction of the amino acid Asp354 with LST (light blue line) and the amino acids Lys489 and Ala332 with LPR (green line). The sum of the interaction energies of all the amino acids that are at a maximum distance of 3.0 Å from the ligands is responsible for the interaction energy of approximately −150 kcal mol−1 of both LST and LPR, caused mainly by the interaction with the amino acids Gln259, Lys489, Thr358, Glu262 and His331 with LST (light blue line) and His491, Ser333, Thr358, His331, Tyr501 and Phe490 with LPR (green line).
The interaction energies of amino acids that are more than 28 Å away from the ligand have little or no contribution to modify the total interaction energy of the ligand–sACE system for both LPR and LST.
Adding the interaction energies of the amino acids located within 19 Å from the ligand, shows that LST presents greater interaction energy than LPR. However, from the distance 20 Å onwards, LPR has higher interaction energy than LST, thus maintaining itself up to the sum of all interaction energies of the amino acids of the sACE protein.
This sharp decrease in the interaction energy is due to the ionic interaction between the zinc ions with charge +2 and the negative charge of the chemical group C3OO− with charged amino acids present in the binding pocket of the sACE. Furthermore, partial shielding of zinc ions far from the binding site must be taken into account to achieve an adequate picture of the stability of the antihypertensive ligand–sACE complex. The interaction energy ligand–sACE, which is the sum of individual energies from each amino acid residue, shows that LPR has a more attractive interaction energy with a difference of ΔE = 24.98 kcal mol−1.
Through BIRD (Fig. 7), it is possible to investigate the sACE residues with relevant interaction energy for stabilization and the relative position of the residues inside the binding pocket of the sACE inhibitors. Besides this, there is detailed quantitative information on individual residue–ligand interaction energies, allowing insights into the molecular mechanism in protein-ligand binding as well as yielding useful and practical tools for the rational design of the next generation of sACE inhibitors. The BIRD analysis demonstrated that the molecular structures of LPR and LST activate different residues within the binding pocket. We highlight the residue Lys489, which has strong interaction energy with both LPR and LST, with values exceeding 50 kcal mol−1 for LPR and 30 kcal mol−1 for LST. LPR forms a strong salt bridge between the group located in region “ii” (see Fig. 7b) and the group of Lys489 at a distant radius equal to 1.7 Å. On the other hand, LST forms a moderate hydrogen bond (2.2 Å) with Lys489 residue and the hydrogen connects to the atom located in region “vi” (see Fig. 7c).
The absolute value of the total sACE interaction energy suggests that LST is a potent sACE inhibitor molecule, with a direct correlation between sACE inhibitor potency and the total energy of interaction of the inhibitor with sACE. For the binding pockets with r = 8 Å and 16 Å the absolute value of E(r) suggests that LST is the most effective sACE inhibitor molecule. After stabilization of E(r) for r > 19 Å, the interaction energy indicates that LPR is the most potent sACE inhibitor than LST. Also, the total interaction energy suggests that LPR, with interaction energy equal to −314.4 kcal mol−1 is the most effective sACE inhibitor. However, the total interaction energy of LST is strong, equal to −289.42 kcal mol−1 (a difference of only 24.98 kcal mol−1).
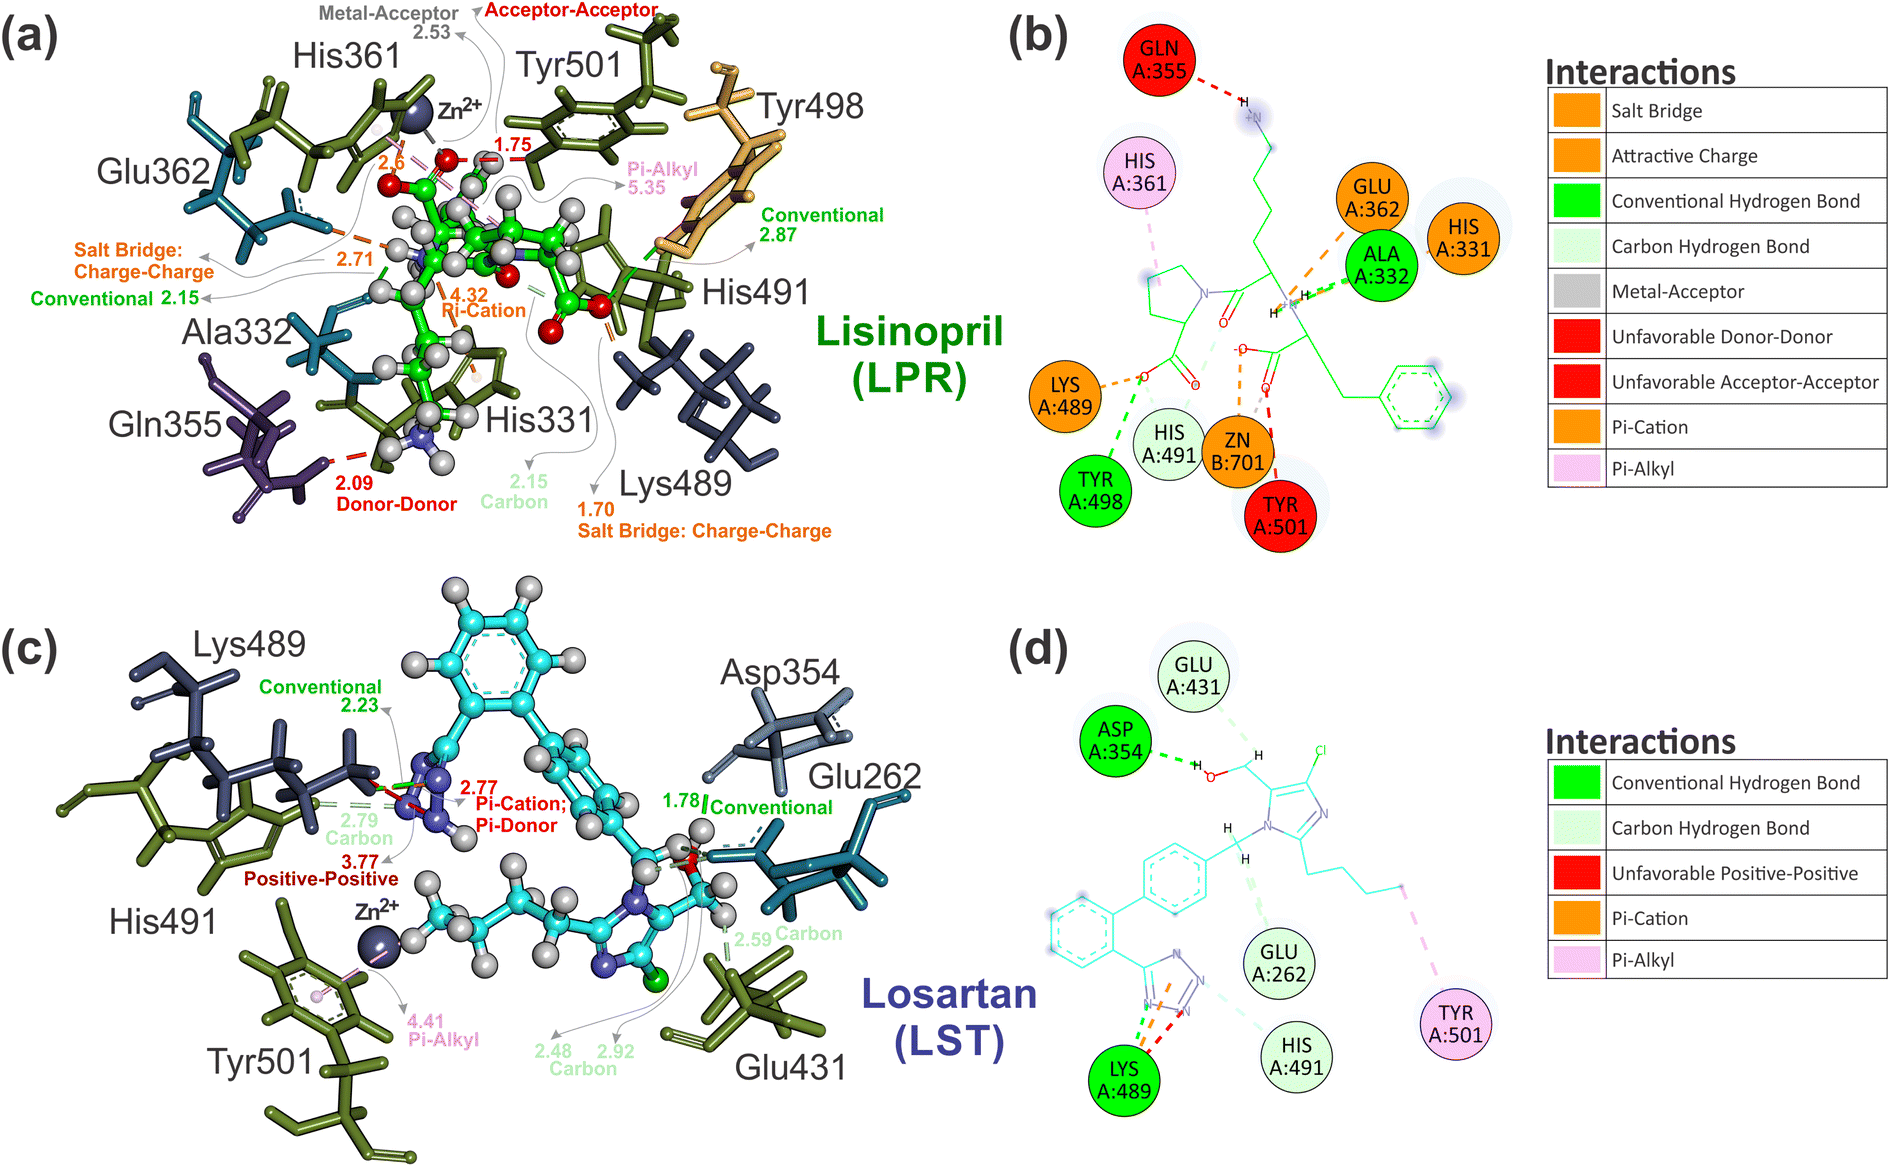 | ||
| Fig. 8 Three-dimensional interaction comparison between the crystallographic ligand pose of (a) LPR–sACE and the best ligand pose prediction of (c) LST–sACE, visualized by using the Discovery Studio software. The ligand represented in ball and stick format with carbons of each of the ligands are colored differently (LPR in green and LST in light blue) and non-carbon atoms are colored by atom type (oxygen in red, nitrogen in blue, chloride in green and zinc ion in grey). Also shown are the two-dimensional ligand interaction diagram of ligand pose, with (b) LPR and (d) LST presenting different interactions with the residues of sACE obtained from the crystallographic (LPR) and the best pose prediction of LST docking in sACE. Residues are labeled and the carbons of each of the ligands are colored differently (LPR in green and LST in light blue). Non-carbon atoms are colored by atom type (oxygen in red, nitrogen in blue, chloride in green and zinc ion in grey). The figure was obtained using the Discovery Studio Visualizer software (Discovery studio modeling environment, Version 19.1; https://www.accelrys.com).40 | ||
4 Conclusions
Hypertension is one of the biggest causes of premature death around the world and this problem tends to worsen in the coming years. This chronic disease may be treated with several agents, including beta-blockers, diuretics, and angiotensin-converting enzyme (ACE) inhibitors, in addition, to lifestyle changes that include dietary interventions.The renin–angiotensin system (RAS) has been demonstrated to be a key element in blood pressure regulation, thus, the study of the mechanism of action of antihypertensive drugs on other targets present in this system can help to elucidate the efficiency and side effects of some drugs that act on the RAS.
From experimental evidence that losartan can block sACE obtained by Guimarães et al.,17 we used in silico experimentation to show details at the molecular level of the interaction between losartan and this enzyme, for that, we used crystallographic data from the lisinopril–sACE complex, deposited with PDB ID 2C6N.15
To understand how losartan inhibits sACE, we first determined the most likely conformation of losartan in the sACE enzyme through docking simulations which showed that the losartan molecule shares the same binding site as the sACE inhibitor lisinopril.
Furthermore, using the MFCC method using density functional theory (DFT/LDA), the interaction energies of LPR and LST with the sACE enzyme were estimated to be approximately −304 kcal mol−1 and −289 kcal mol−1, respectively. This result suggests that losartan is an affinity for the somatic ACE binding site of the same order as the lisinopril drug. The results of the interactions energies obtained through the MFCC (LDA/DFT) present good correlation with the experimental data of IC50 obtained through competitive inhibition assays carried out by Guimarães et al.17 Also, the MFCC method allowed us to determine the most important amino acids in stabilizing each molecule within the binding site. For example, the amino acid Lys489 is essential for the stabilization of both drugs, as it makes a salt bridge bond of approximately −55 kcal mol−1 with the LPR and makes a hydrogen bond with the LST of approximately −35 kcal mol−1.
Another important result that we can highlight in this work was presented in Fig. 6, where we plot the interaction energy on a 2D surface obtained from a cut made in the somatic ACE enzyme to show how the three-dimensional structure of a drug can interact differently with the target. This interaction map can be made at different levels of the enzyme binding site, which can provide important information for the research and development of new drugs.
The quantum biochemistry techniques used in this work contribute to explaining and unraveling new mechanisms of action of losartan that are already widely used in medicine today. In addition, the present work reinforces the role of computational simulations at the quantum level as a valuable tool for understanding and developing new drugs. To conciliate the production of more efficient drugs and the necessity to decrease their cost of development, the use of relatively cheap computational simulations is very promising.
Author contributions
Eveline M. Bezerra, Erika C. de Alvarenga and Roner F. da Costa conceived of the present idea. Eveline M. Bezerra, Roner F. da Costa and Ricardo P. dos Santos planned and carried out the simulations. Umberto L. Fulco and Jeanlex S. de Sousa analysed the data. Valder N. Freire and Eudenilson L. Albuquerque supervised the project. All authors contributed to the analysis and discussed the results and to the final manuscript.Conflicts of interest
There are no conflicts to declare.Acknowledgements
The authors would like to thank the Brazilian System of High-Performance Processing (Sistema Nacional de Processamento de Alto Desempenho, SINAPAD), especially CENAPAD-UFC. R. P. S received financial support from Conselho Nacional de Desenvolvimento Científico e Tecnológico (CNPq) Projects 151182/2013-2 and 447592/2014-9. E. M. B. received financial support from FAPERN/CAPES and CNPq project 311563/2017-1 and 159352/2018-5. R. F. da Costa received financial support from CNPq-Universal project 434821/2018-7. E. C. A. is supported by PROPE/UFSJ, and grant from FAPEMIG [Rede Mineira de Pesquisa e Inovação para Bioengenharia de Nanosistemas (RED-00282-16), and APQ-02026-18].Notes and references
- WHO, World Health Organization, 2021, https://www.who.int/news-room/fact-sheets/detail/hypertension Search PubMed.
- T. Nogrady and D. F. Weaver, Medicinal Chemistry: A Molecular and Biochemical Approach, Oxford University Press, USA, 3rd edn, 2005, p. 672 Search PubMed.
- G. Rajeev and G. Soneil, Indian J. Med. Res., 2010, 132, 531–542 Search PubMed.
- P. J. Cullen and P. J. Lockyer, Nat. Rev. Mol. Cell Biol., 2002, 3, 339–348 CrossRef CAS.
- L. Wei, F. Alhenc-Gelas, P. Corvol and E. Clauser, J. Biol. Chem., 1991, 266, 9002–9008 CrossRef CAS.
- Z. N. Esmail and P. S. Loewen, Ann. Pharmacother., 1998, 32, 1096–1098 CrossRef CAS PubMed.
- S. Andersen, L. Tarnow, F. Cambien, P. Rossing, T. R. Juhl, J. Deinum and H.-H. Parving, Kidney Int., 2002, 62, 192–198 CrossRef CAS PubMed.
- T. Takezako, H. Unal, S. S. Karnik and K. Node, Mol. Pharmacol., 2015, 88, 488–501 CrossRef CAS PubMed.
- F. D. Fuchs, Expert Rev. Cardiovasc. Ther., 2004, 2, 771–775 CrossRef CAS PubMed.
- M. R. Law, J. K. Morris and N. J. Wald, BMJ, 2009, 338, b1665 CrossRef CAS.
- The ALLHAT Officers and Coordinators for the ALLHAT Collaborative Research Group, J. Am. Med. Assoc., 2002, 288, 2981–2997 CrossRef.
- N. S. Beckett, R. Peters, A. E. Fletcher, J. A. Staessen, L. Liu, D. Dumitrascu, V. Stoyanovsky, R. L. Antikainen, Y. Nikitin, C. Anderson, A. Belhani, F. Forette, C. Rajkumar, L. Thijs, W. Banya and C. J. Bulpitt, N. Engl. J. Med., 2008, 358, 1887–1898 CrossRef CAS PubMed.
- B. Dahlöf, P. S. Sever, N. R. Poulter, H. Wedel, D. G. Beevers, M. Caulfield, R. Collins, S. E. Kjeldsen, A. Kristinsson, G. T. McInnes, J. Mehlsen, M. Nieminen, E. O'Brien and J. Östergren, Lancet, 2005, 366, 895–906 CrossRef.
- F. D. Fuchs, Lancet, 2002, 359, 2203 CrossRef.
- H. R. Corradi, S. L. Schwager, A. T. Nchinda, E. D. Sturrock and K. R. Acharya, J. Mol. Biol., 2006, 357, 964–974 CrossRef CAS.
- L. L. C. Schrödinger, PyMOL The PyMOL Molecular Graphics System, Version 1.8, 2015, https://pymol.org/2/ Search PubMed.
- P. B. Guimarães, É. C. Alvarenga, P. D. Siqueira, E. J. Paredes-Gamero, R. A. Sabatini, R. L. Morais, R. I. Reis, E. L. Santos, L. G. Teixeira, D. E. Casarini, R. P. Martin, S. I. Shimuta, A. K. Carmona, C. R. Nakaie, M. G. Jasiulionis, A. T. Ferreira, J. L. Pesquero, S. M. Oliveira, M. Bader, C. M. Costa-Neto and J. B. Pesquero, Hypertension, 2011, 57, 965–972 CrossRef PubMed.
- E. C. de Alvarenga, M. d. C. Fonseca, C. C. Carvalho, R. M. Florentino, A. França, E. Matias, P. B. Guimarães, C. Batista, V. Freire, A. K. Carmona, J. B. Pesquero, A. M. de Paula, G. Foureaux and M. d. F. Leite, PLoS One, 2016, 11, e0165371 CrossRef.
- D. W. Zhang, X. H. Chen and J. Z. H. Zhang, J. Comput. Chem., 2003, 24, 1846–1852 CrossRef CAS PubMed.
- R. F. da Costa, V. N. Freire, E. M. Bezerra, B. S. Cavada, E. W. S. Caetano, J. L. de Lima Filho and E. L. Albuquerque, Phys. Chem. Chem. Phys., 2012, 14, 1389–1398 RSC.
- I. L. Barroso-Neto, J. P. C. Marques, R. F. da Costa, E. W. S. Caetano, B. S. Cavada, C. Gottfried and V. N. Freire, J. Phys. Chem. B, 2012, 116, 3270–3279 CrossRef CAS PubMed.
- J. X. Lima Neto, U. L. Fulco, E. L. Albuquerque, G. Corso, E. M. Bezerra, E. W. S. Caetano, R. F. da Costa and V. N. Freire, Phys. Chem. Chem. Phys., 2015, 17, 13092–13103 RSC.
- D. S. Dantas, J. I. N. Oliveira, J. X. Lima Neto, R. F. da Costa, E. M. Bezerra, V. N. Freire, E. W. S. Caetano, U. L. Fulco and E. L. Albuquerque, RSC Adv., 2015, 5, 49439–49450 RSC.
- E. L. Albuquerque, U. L. Fulco, E. W. S. Caetano and V. N. Freire, Quantum Chemistry Simulation of Biological Molecules, Cambridge University Press, 2021 Search PubMed.
- P. Dauber-Osguthorpe, V. A. Roberts, D. J. Osguthorpe, J. Wolff, M. Genest and A. T. Hagler, Proteins: Struct., Funct., Genet., 1988, 4, 31–47 CrossRef CAS.
- J. J. P. Stewart, J. Mol. Model., 2013, 19, 1–32 CrossRef CAS PubMed.
- O. Trott and A. J. Olson, J. Comput. Chem., 2009, 31, 455–461 Search PubMed.
- E. F. Pettersen, T. D. Goddard, C. C. Huang, G. S. Couch, D. M. Greenblatt, E. C. Meng and T. E. Ferrin, J. Comput. Chem., 2004, 25, 1605–1612 CrossRef CAS PubMed.
- B. Delley, J. Chem. Phys., 1990, 92, 508–517 CrossRef CAS.
- F. Ortmann, F. Bechstedt and W. G. Schmidt, Phys. Rev. B, 2006, 73, 205101 CrossRef.
- B. Delley, J. Chem. Phys., 2000, 113, 7756–7764 CrossRef CAS.
- G. Zanatta, I. L. Barroso-Neto, V. B. Junior, M. F. Dutra, E. M. Bezerra, R. F. da Costa, E. W. S. Caetano, B. S. Cavada, V. N. Freire and C. Gottfried, J. Proteomics Bioinf., 2012, 05, 155–162 CAS.
- G. Zanatta, G. Nunes, E. M. Bezerra, R. F. da Costa, A. Martins, E. W. S. Caetano, V. N. Freire and C. Gottfried, ACS Chem. Neurosci., 2014, 5, 1041–1054 CrossRef CAS PubMed.
- G. Zanatta, G. Della Flora Nunes, E. M. Bezerra, R. F. da Costa, A. Martins, E. W. S. Caetano, V. N. Freire and C. Gottfried, ACS Chem. Neurosci., 2016, 7, 1331–1347 CrossRef CAS PubMed.
- T. C. d. S. Ribeiro, R. F. da Costa, E. M. Bezerra, V. N. Freire, M. L. Lyra and V. Manzoni, New J. Chem., 2014, 38, 2946–2957 RSC.
- R. A. Saraiva, P. A. Nogara, R. F. Costa, E. M. Bezerra, H. N. Veras, I. R. Menezes, U. L. Fulco, E. L. Albuquerque, V. N. Freire and J. B. Rocha, Comput. Toxicol., 2018, 7, 9–19 CrossRef.
- G. L. Patrick, An Introduction to Medicinal Chemistry, OUP Oxford, United Kingtdom, 6th edn, 2017, p. 912 Search PubMed.
- M. Akif, D. Georgiadis, A. Mahajan, V. Dive, E. D. Sturrock, R. E. Isaac and K. R. Acharya, J. Mol. Biol., 2010, 400, 502–517 CrossRef CAS PubMed.
- D. S. BIOVIA, Discovery studio modeling environment, Version 19.1, 2019, https://www.accelrys.com Search PubMed.
Footnote |
| † These authors contributed equally to this work. |
| This journal is © The Royal Society of Chemistry 2022 |