 Open Access Article
Luminescence properties and energy transfer of the near-infrared phosphor Ca3In2Ge3O12:Cr3+,Nd3+
Tao Wang*a,
Lingwei Caob,
Zhijun Wang b and
Panlai Li
 *b
*b
aCollege of Science, China University of Petroleum (East China), Qingdao 266580, China. E-mail: twang@upc.edu.cn
bCollege of Physics Science & Technology, Hebei University, Baoding 071002, China. E-mail: li_panlai@126.com
First published on 5th October 2022
Abstract
The double doping strategy based on energy transfer is an effective way to regulate the NIR spectral distribution. In this work, Ca3In2Ge3O12:xNd3+ (CIG:xNd3+) and Ca3−xIn1.93Ge3O12:0.07Cr3+,yNd3+ (CIG:0.07Cr3+,yNd3+) phosphors are successfully prepared via a high-temperature solid-state method. CIG:0.07Cr3+ shows broadband emission centered at 804 nm, which covers most of the excitation peaks of Nd3+ ions. Under excitation at 480 nm, Cr3+ can provide effective energy transfer to Nd3+. In addition, CIG:0.07Cr3+,0.15Nd3+ has good temperature stability, and maintains 68.98% of the room-temperature intensity at 150 °C. The phosphors can convert short-wave photons to long-wave photons and enhance solar cell utilization, demonstrating the potential application of this material in solar spectral conversion technology.
1 Introduction
Generally, the absorption spectrum of an instrument in the near-infrared (NIR) region is mainly due to the multiplication and combination of hydrogen-containing groups such as –CH, –NH and –OH, and these absorption bands are mainly distributed in the range of 700–1500 nm.1–4 Therefore, NIR light can be used in security and surveillance, modern agriculture, the security and safety of international products and medical diagnosis. In order to achieve comprehensive and accurate detection, a broadband emission with uniform intensity is required. NIR phosphor-converted LEDs (NIR pc-LEDs) are one of the most promising NIR light sources with significant advantages such as long life, high efficiency, low cost, compactness and spectral tunability, and the choice of NIR phosphor plays a key role in the device performance. Currently, the lowest cost and highest efficiency commercial LED chips are blue chips.5–7 If a NIR phosphor is combined with blue chips, a phosphor-converted NIR LED can be developed, whose emission can be adjusted on demand by the NIR phosphor, which also has the advantages of high efficiency, long service life and compact structure. It is one of the most promising NIR light sources. Therefore, it is crucial to develop efficient NIR broadband emitting phosphors that can be excited by blue LED cores.8,9To meet the broadband emission and high efficiency requirements of pc-LEDs, high-performance NIR emitting materials doped with Cr3+ ions are often required in the NIR region.10–15 They have been of interest to researchers for applications in material analysis, fluorescent labeling, solar cells and biomedical monitoring.16 Taking solar cells as an example, silicon solar cells have a forbidden bandwidth of 1.1 eV (∼1100 nm), which has a better utilization rate for photons with energy slightly higher than the forbidden bandwidth and low lattice heat loss. The selection of suitable NIR light-emitting materials can improve the photovoltaic efficiency of solar cells by converting UV light, which is more distributed in sunlight but less utilized by solar cells, into NIR light, which can be used efficiently. Among the many NIR luminescent materials, fluorescent materials doped with rare earth ions account for a large proportion. Trivalent rare earth ions are selected in a suitable combination to meet the fluorescence requirements from the UV band all the way to the IR band, which have abundant energy levels.17,18 Zhu et al. reported Cr3+-doped AlP3O9 displaying broadband NIR emission from 650–1000 nm with ∼76% luminescence internal quantum efficiency (IQE).19 KGaP2O7 exhibits a broadband NIR emission peak at 815 nm when Cr3+ is added in a weak crystal field environment.20 In addition, the garnet-structured Gd3Y0.5In0.5Ga4O12 phosphor displayed a broadband NIR emission peak at 760 nm, and broadband emission at 650–1050 nm was achieved by adjusting the six-coordinated crystal field environment occupied by Cr3+ with an IQE of 81.8%.21 Although these materials are suitable for the NIR region, they are not well suited to the application requirements. After a series of exploratory studies, it was found that transition metal ions or rare earth ions in the NIR range could be doped into a suitable substrate to obtain phosphors that could convert light from short-wave to long-wave photons. When applied to solar cells, these can improve the utilization of short-wave photons to a certain extent, which in turn improves the photovoltaic conversion efficiency of solar cells.22 Dong et al. synthesized a series of LaGaO3:Cr3+,Ln3+ (Ln = Yb, Nd, Er) phosphors to achieve efficient NIR emission from c-Si solar cells through energy transfer.23
In this work, Ca3In2Ge3O12:xNd3+ (CIG:xNd3+) and Ca3−xIn1.93Ge3O12:0.07Cr3+,yNd3+ (CIG:0.07Cr3+,yNd3+) phosphors were successfully prepared. Because there is a large overlap between the solar spectral energy distribution and the excitation spectrum of Cr3+, CIG:Cr3+ might convert the most intensive energy distribution in the solar spectral energy distribution to a long emission at around 800 nm. Nd3+ has high luminescence intensity and its emission wavelength at around 1100 nm matches the strongest point of the response curve of c-Si solar cells.24,25 Spectral conversion materials with excitation at 480 nm and emission at 1100 nm were synthesized using the energy transfer of Cr3+ → Nd3+. This may be of great significance for the development of rare earth ions and their applications in new energy fields.
2 Experimental
2.1 Synthesis
A series of CIG:Cr3+/Nd3+ phosphors were successfully synthesized by a high-temperature solid-state method. CaCO3, In2O3, GeO2, Cr2O3 and Nd2O3 were weighed as raw materials and then mixed and ground in an agate mortar. The mixture was sintered at 1250 °C for 6 h in air. After cooling, the mixture was ground to a powder using an agate mortar and then tested.2.2 Characterization
XRD patterns were obtained on a Bruker D8 Advance X-ray diffractometer at 40 kV and 40 mA with Cu-Kα (λ = 1.54056 Å) irradiation. The specific test parameters are as follows: scan range = 10°–80°, time per steps = 0.15, steps = 3000. Rietveld refinement of the measured XRD data was performed using the GENERAL STRUCTURE ANALYSIS SYSTEM (GSAS) software.26 The photoluminescence excitation (PLE) and photoluminescence emission (PL) spectra were recorded on a HORIBA Fluorolog-3 fluorescence spectrometer with a 450 W Xe lamp as the excitation source, and the temperature spectra were tested with an external device. The diffuse reflectance spectra were measured on a Hitachi U-4100, using BaSO4 as a standard reference.3 Results and discussion
3.1 Crystal structure and phase identification
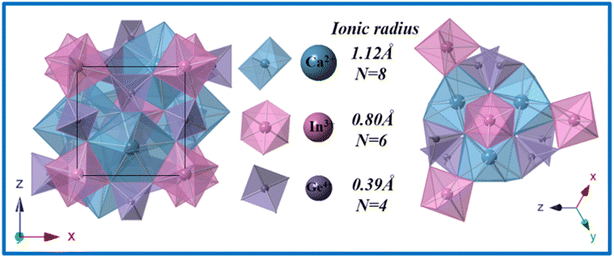
As shown in Fig. 1, CIG exhibits a garnet structure, the space group is Ia![[3 with combining macron]](https://www.rsc.org/images/entities/char_0033_0304.gif) d, and it is a symmetric cubic structure with the lattice parameters a = b = c = 12.58 Å, α = β = γ = 90°, and Z = 8. Ca2+ (R = 1.12 Å) combines with O2− to form CaO8 dodecahedra, while In3+ (R = 0.80 Å) and Ge4+ (R = 0.39 Å) ions occupy the six-coordinated octahedral site and the four-coordinated tetrahedral site, respectively. In addition, as shown in the oblique tangent diagram of the cell, each dodecahedron is connected to six octahedra by a common edge and each tetrahedron is connected to four octahedra by a common vertex. The flexible structure provides a rich coordination environment for the activator.
d, and it is a symmetric cubic structure with the lattice parameters a = b = c = 12.58 Å, α = β = γ = 90°, and Z = 8. Ca2+ (R = 1.12 Å) combines with O2− to form CaO8 dodecahedra, while In3+ (R = 0.80 Å) and Ge4+ (R = 0.39 Å) ions occupy the six-coordinated octahedral site and the four-coordinated tetrahedral site, respectively. In addition, as shown in the oblique tangent diagram of the cell, each dodecahedron is connected to six octahedra by a common edge and each tetrahedron is connected to four octahedra by a common vertex. The flexible structure provides a rich coordination environment for the activator.
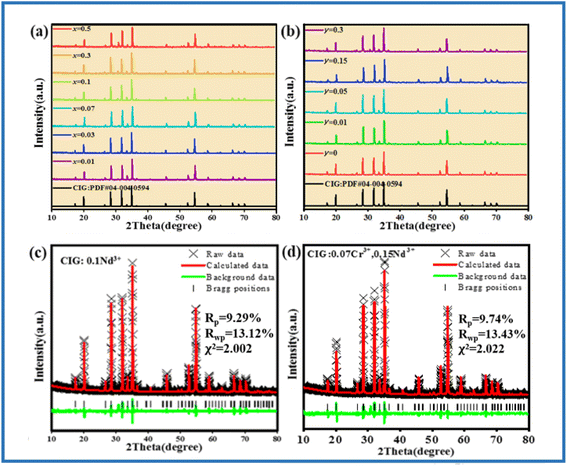
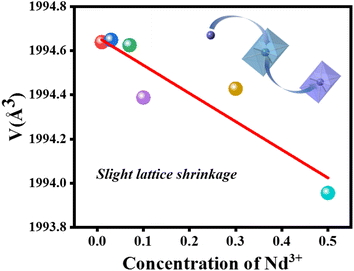
The XRD patterns of CIG:xNd3+ (x = 0.01, 0.03, 0.07, 0.1, 0.3, 0.5) and CIG:0.07Cr3+,yNd3+ (y = 0.01, 0.05, 0.15, 0.3) are presented in Fig. 2. The main diffraction peaks of all the samples are well consistent with the standard diffraction cards of PDF #04-004-0594, suggesting the samples are all pure phases. XRD refinement was conducted for the samples using the GSAS software, and the results of CIG:0.1Nd3+ and CIG:0.07Cr3+,0.15Nd3+ are displayed in Fig. 2c and d. It is clearly seen that the measured values match well with the calculated results, and the obtained refinement parameters χ2 < 10, Rp < 10%, and Rwp < 15% are within the error range, which justify the refinement results. More detailed refinement results of CIG:xNd3+ (x = 0.01, 0.03, 0.07, 0.1, 0.3, 0.5) are given in Table 1. The space group, crystal phase, α/β/γ and other crystal parameters of the six samples correspond to each other, and the doping of Nd3+ does not change the lattice parameters of CIG. As the ionic radius of Ca2+ (1.12 Å, CN = 8) is close to that of Nd3+ (1.11 Å, CN = 8), the cell parameters a/b/c and the cell volume V do not change significantly. This subtle change is difficult to monitor only by the macroscopic characterization of XRD, which is also confirmed by the lack of significant change in the XRD diffraction peaks with increasing Nd3+ concentration (Fig. 2a). Nevertheless, a slight downward trend in cell volume was observed through more careful refinement of the data (the cell parameters are retained to six decimal places). As shown in Fig. 3, the fitting results demonstrate a slight shrinkage of the lattice and eventually a decrease in cell volume with the incorporation of the smaller Nd3+.
| CIG:0.01Nd3+ | CIG:0.03Nd3+ | CIG:0.07Nd3+ | CIG:0.1Nd3+ | CIG:0.3Nd3+ | CIG:0.5Nd3+ | |
|---|---|---|---|---|---|---|
| Space group | Ia![[3 with combining macron]](https://www.rsc.org/images/entities/char_0033_0304.gif) d d |
Ia![[3 with combining macron]](https://www.rsc.org/images/entities/char_0033_0304.gif) d d |
Ia![[3 with combining macron]](https://www.rsc.org/images/entities/char_0033_0304.gif) d d |
Ia![[3 with combining macron]](https://www.rsc.org/images/entities/char_0033_0304.gif) d d |
Ia![[3 with combining macron]](https://www.rsc.org/images/entities/char_0033_0304.gif) d d |
Ia![[3 with combining macron]](https://www.rsc.org/images/entities/char_0033_0304.gif) d d |
| Symmetry | Cubic | Cubic | Cubic | Cubic | Cubic | Cubic |
| V (Å3) | 1994.639 | 1994.649 | 1994.625 | 1994.388 | 1994.428 | 1993.955 |
| a/b/c (Å) | 12.587933 | 12.587964 | 12.587914 | 12.587415 | 12.587500 | 12.586505 |
| α/β/γ (deg) | 90 | 90 | 90 | 90 | 90 | 90 |
| χ2 | 2.002 | |||||
| Rp (%) | 8.13 | 9.57 | 9.96 | 9.29 | 9.61 | 9.98 |
| Rwp (%) | 12.26 | 13.06 | 13.59 | 13.12 | 14.87 | 14.97 |
3.2 Luminescence properties of CIG:Nd3+
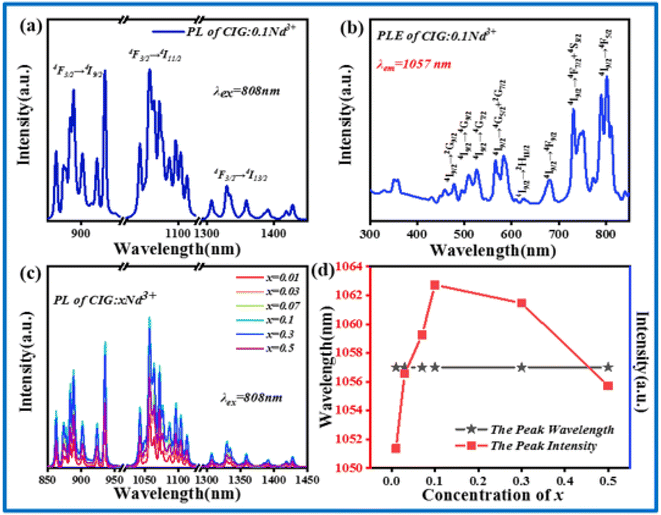
Fig. 4a shows the PL spectrum excited by an 808 nm laser. CIG:0.1Nd3+ emits NIR light in the range of 850–1450 nm with a peak at 1057 nm. The three peak positions from left to right correspond to the 4F3/2 → 4I9/2, 4F3/2 → 4I11/2, and 4F3/2 → 4I13/2 transitions of Nd3+.27 The emission band covers the biology first window and biology second window of the NIR light range. Fig. 4b presents the excitation spectra of 1057 nm; there are many excitation bands that correspond to the 4I9/2 → 2G9/2, 4I9/2 → 4G9/2, 4I9/2 → 4G7/2, 4I9/2 → 4G5/2 + 2G7/2, 4I9/2 → 2H11/2, 4I9/2 → 4F9/2, 4I9/2 → 4F7/2 + 4S3/2 and 4I9/2 → 4F5/2 transitions at 200–800 nm.27 The optimum excitation is located at 800 nm, which is similar to the position of the emission spectrum of CIG:0.07Cr3+ and provides the necessary conditions for the energy transfer from Cr3+ to Nd3+.28 Fig. 4c presents the PL spectra of CIG:Nd3+ under 808 nm excitation, and all the samples exhibit broad emission in the range of 850–1450 nm. As shown in Fig. 4d, the emission intensity first increases and then decreases with increasing doping concentration and reaches a maximum at x = 0.1, while the peak position does not change with the increase in the doping concentration.3.3 Luminescence properties and energy transfer of CIG:Cr3+,Nd3+
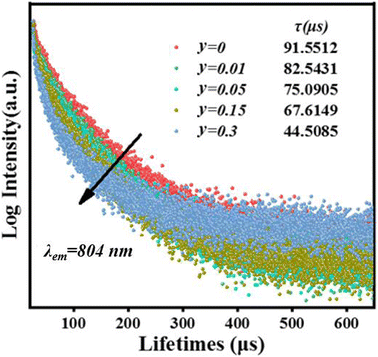
As shown in Fig. 5a, the PL spectrum of CIG:0.07Cr3+ overlaps with the two strongest excitation peaks of CIG:0.1Nd3+, indicating that Nd3+ will effectively absorb the light of Cr3+, which is necessary to generate energy transfer from Cr3+ to Nd3+. Meanwhile, the PLE spectrum of CIG:0.07Cr3+ shows the most intense absorption band at 480 nm, while the excitation of CIG:0.1Nd3+ is very weak at 480 nm, indicating that the excitation of Nd3+ luminescence in CIG:0.07Cr3+,yNd3+ will mainly originate from the emission of Cr3+ under 480 nm excitation. As displayed in Fig. 5b, the intensity of the 1057 nm peak increases and then decreases with an increase in the Nd3+ doping concentration, and the intensity of the Cr3+ peak decreases continuously. The emission intensity reaches a maximum at 0.15 Nd3+. The decay curves of Cr3+ are shown in Fig. 6, and the lifetime of Cr3+ can be calculated using eqn (1) and (2). The results show that the lifetime of Cr3+ decreases with the increase in the Nd3+ doping concentration, indicating that Cr3+ → Nd3+ energy transfer occurs.28| I = I0 + A1exp(−t/τ1) + A2exp(−t/τ2) | (1) |
| τ* = (A1τ21 + A2τ22)/(A1τ1 + A2τ2) | (2) |
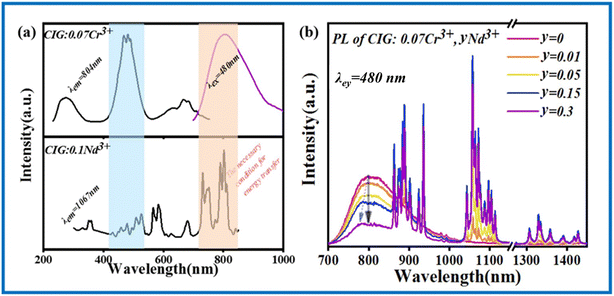 | ||
| Fig. 5 (a) PLE and PL spectra of CIG:0.07Cr3+ and CIG:0.1Nd3+. (b) The emission spectra of CIG:0.07Cr3+,yNd3+ (y = 0.01, 0.05, 0.15, 0.3) upon 480 nm excitation. | ||
With the increase in the doping concentration, the distance between Nd3+ gets smaller and the non-radiative jump becomes larger. The luminescence intensity of Nd3+ reaches its highest when the concentration and the energy transfer reach a balance. Meanwhile, there is a slight blue shift of the Cr3+ emission peak, which is due to the substitution of Nd3+ for Ca2+ suppressing the substitution of Cr3+ for Ca2+, and the dodecahedral lattice long-wave luminescence of Cr3+ is reduced.
The energy transfer process of Cr3+/Nd3+ in CIG can be explained as follows. When the sample is excited by 480 nm light, the photoelectrons located on the 4A2(4F) energy level of Cr3+ transition upward to multiple excitation bands. Then, these photoelectrons fall to the lowest excited state 4T2(4F) through non-radiative transition and the photoelectrons transition downward from the lowest excited state to the ground state, which results in NIR emission at 804 nm. This transition is matched with the excitation of Nd3+. The photoelectrons in the ground state of Nd3+ ions (4I9/2) are excited to transition upward to multiple excitation bands, and these photoelectrons then fall to the lowest excited state 4F3/2 through non-radiative transition. The photoelectrons transition downward from the lowest excited state to the ground state, producing three emissions 4F3/2 → 4I9/2, 4F3/2 → 4I11/2 and 4F3/2 → 4I13/2. The three emission bands correspond to the peak positions of 889 nm, 1057 nm, and 1339 nm, which are the energy transfer processes of Cr3+ → Nd3+ in CIG:0.07Cr3+,Nd3+. In order to investigate the energy transfer, Fig. 7 shows the emission intensity and energy transfer efficiency of Cr3+ and Nd3+. The efficiency of energy transfer can be obtained by the following equation:29
 | (3) |
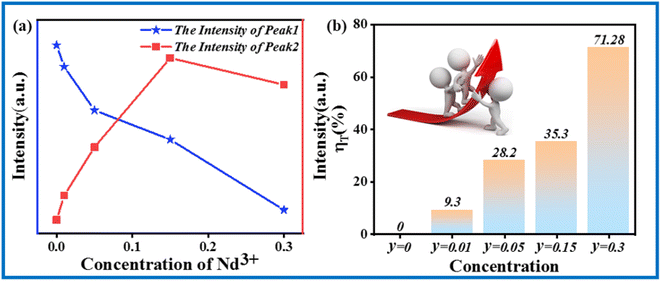 | ||
| Fig. 7 (a) Emission intensities of Cr3+ and Nd3+ in CIG:0.07Cr3+,yNd3+ (y = 0.01, 0.05, 0.15, 0.3). (b) Energy transfer efficiency with different Nd3+ concentrations. | ||
IS represents the emission intensity of Cr3+ for different Nd3+ doping concentrations, and IS0 represents the emission intensity of Cr3+ when y is 0. With the increase in the doping concentration, the energy transfer efficiency of Cr3+ → Nd3+ gradually increases to 71.28%, indicating that it is feasible to transfer the energy at 480 nm to the long-wavelength region via the energy transfer of Cr3+ → Nd3+. In order to investigate the mechanism of energy transfer, Blasse proposed the strategy to distinguish the exchange interaction and electrical multipolar interaction in energy transfer using the critical distance Rc of the activator and sensitizer. If the critical distance Rc < 5 Å, exchange interaction plays a major role, and if Rc > 5 Å, multipolar interaction will dominate, and the critical distance can be calculated by the following equation:30
 | (4) |
 | (5) |
 is shown in Fig. 8, the curves of which are fitted linearly. When n = 8, the fit R2 is the highest, indicating that the fit is the best and most appropriate. In summary, the type of energy transfer for Cr3+ → Nd3+ is a dipole–quadrupole interaction (multipolar interaction).
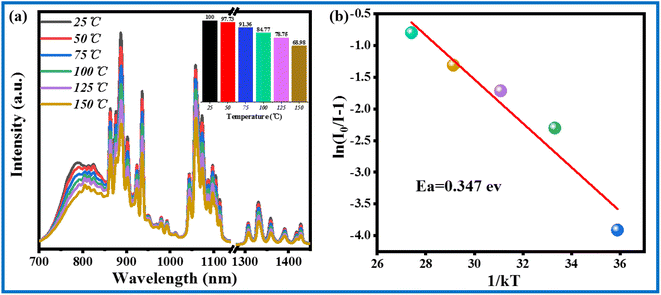
Slightly different from a pc-LED, a solar cell usually operates at temperatures below 80 °C. The temperature stability of commercial phosphors is critical to their application performance. Fig. 9a presents the thermal spectra of CIG:0.07Cr3+,0.15Nd3+ at 25–150 °C. The integrated intensity ratio at 75 °C can reach 91.36% of that at room temperature. In addition, the integrated intensity of CIG:0.07Cr3+,0.15Nd3+ at 150 °C can still reach 68.98% of that at room temperature, as calculated by the integrated area. As displayed in Fig. 9b, the thermal quenching activation energy of CIG:0.07Cr3+,0.15Nd3+ was further calculated using the Arrhenius equation (eqn (6)).33,34
 | (6) |
The ln[(I0/I) − 1] and 1/KT relations were fitted to a straight line, and the absolute value of the slope of the line is the thermal quenching activation energy Ea. The value of Ea was calculated to be 0.374 eV, which indicates that the phosphor has good temperature stability and commercial value.
3.4 Ca2.85In1.93Ge3O12:0.07Cr3+,0.15Nd3+ application prospects in solar spectral conversion technology
Fig. 10a shows the potential application of CIG:0.07Cr3+,0.15Nd3+ in solar spectral conversion technology. Solar spectrum AM 1.5 does not correspond to the peak position of the spectral response curve of c-Si solar cells.35 In order to avoid such energy loss and improve the efficiency of solar cells, the CIG:0.07Cr3+,0.15Nd3+ phosphor can be introduced. It is noted that the best excitation of Cr3+ in the visible region is consistent with the peak position of the solar spectrum AM 1.5, and the phosphor emission is consistent with the strongest part of the spectral response curve of the c-Si solar cell by the energy transfer of Cr3+ → Nd3+; thus, it has the potential to convert short-wave photons into long-wave photons and enhance the efficiency of solar cells. As displayed in Fig. 10b, by putting a thin layer of high-transmittance CIG:0.07Cr3+,0.15Nd3+ on the EVA film of a crystalline silicon cell, some short-wave photons are converted into long-wave photons, and more photons are absorbed in the best spectral response of the c-Si solar cell, thus obtaining better photoelectric conversion efficiency.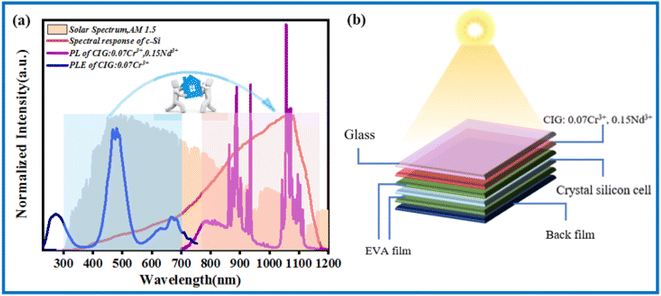 | ||
| Fig. 10 (a) Spectral response curves of CIG:0.07Cr3+,0.15Nd3+ with solar spectrum AM 1.5 and c-Si solar cells. (b) Application of CIG:0.07Cr3+,0.15Nd3+ in silicon-based solar cells. | ||
4 Conclusions
In summary, CIG:0.1Nd3+ and CIG:0.07Cr3+,0.15Nd3+ phosphors are successfully synthesized via a high-temperature solid-state method. The physical phase structure, luminescence properties, energy transfer mechanisms, thermal stability and the future applications are investigated in detail. The XRD and refinement results show that the obtained phosphors were all pure phases. The energy transfer from Cr3+ to Nd3+ was demonstrated by comparing the excitation and emission spectra of CIG:0.07Cr3+,yNd3+ (y = 0.01, 0.05, 0.15, 0.3) and the decay curve of Cr3+ ions. The energy transfer efficiency is calculated to be 71.28%. CIG:0.07Cr3+,0.15Nd3+ possesses excellent temperature stability, reaching 91.36% and 68.98% of the intensity at room temperature at 75 °C and 150 °C, respectively. The activation energy is calculated to be 0.374 eV. Finally, the application of the CIG:0.07Cr3+,0.15Nd3+ phosphor in solar cells is demonstrated. This phosphor has the potential to convert short-wave photons into long-wave photons and improve the efficiency of solar cells, and thus has broad application prospects.Conflicts of interest
The authors declare no conflict of interest.Acknowledgements
The work is supported by the National Natural Science Foundation of China (No. 61805285).References
- Y. Gu, Z. Guo, W. Yuan, M. Kong, Y. Liu, Y. Liu, Y. Gao, W. Feng, F. Wang, J. Zhou, D. Jin and F. Li, High-sensitivity imaging of time-domain near-infrared light transducer, Nat. Photonics, 2019, 13(8), 525–531 CrossRef CAS.
- Z. Pan, Y. Y. Lu and F. Liu, Sunlight-activated long-persistent luminescence in the near-infrared from Cr3+-doped zinc gallogermanates, Nat. Mater., 2011, 11(1), 58–63 CrossRef.
- M. Ferrari and V. Quaresima, A brief review on the history of human functional near-infrared spectroscopy (fNIRS) development and fields of application, Neuroimage, 2012, 63(2), 921–935 CrossRef PubMed.
- A. T. Eggebrecht, S. L. Ferradal, A. Robichaux-Viehoever, M. S. Hassanpour, H. Dehghani, A. Z. Snyder, T. Hershey and J. P. Culver, Mapping distributed brain function and networks with diffuse optical tomography, Nat. Photonics, 2014, 8(6), 448–454 CrossRef CAS.
- E. Matioli, S. Brinkley, K. M. Kelchner, Y.-L. Hu, S. Nakamura, S. DenBaars, J. Speck and C. Weisbuch, High-brightness polarized light-emitting diodes, Light: Sci. Appl., 2012, 1(8), e22 CrossRef.
- Y. Wang, Z. Wang, G. Wei, Y. Yang, S. He, J. Li, Y. Shi, R. Li, J. Zhang and P. Li, Ultra-Broadband and high efficiency Near-Infrared Gd3ZnGa5-2GeO12: Cr3+ (x = 0–2.0) garnet phosphors via crystal field engineering, Chem. Eng. J., 2022, 437(1), 135346 CrossRef CAS.
- W. T. Huang, C. L. Cheng, Z. Bao, C. W. Yang, K. M. Lu, C. Y. Kang, C. M. Lin and R. S. Liu, Broadband Cr3+, Sn4+-Doped Oxide Nanophosphors for Infrared Mini Light-Emitting Diodes, Angew. Chem., Int. Ed., 2019, 58(7), 2069–2072 CrossRef CAS PubMed.
- Y. Yan, M. Shang, S. Huang, Y. Wang, Y. Sun, P. Dang and J. Lin, Photoluminescence Properties of AScSi2O6: Cr3+ (A = Na and Li) Phosphors with High Efficiency and Thermal Stability for Near-Infrared Phosphor-Converted Light-Emitting Diode Light Sources, ACS Appl. Mater. Interfaces, 2022, 14(6), 8179–8190 CrossRef CAS.
- H. Jiang, L. Chen, G. Zheng, Z. Luo, X. Wu, Z. Liu, R. Li, Y. Liu, P. Sun and J. Jiang, Ultra-Efficient GAGG: Cr3+ Ceramic Phosphor-Converted Laser Diode: A Promising High-Power Compact Near-Infrared Light Source Enabling Clear Imaging, Adv. Opt. Mater., 2022, 10(11), 2102741 CrossRef CAS.
- L. Zhang, S. Zhang, Z. Hao, X. Zhang, G.-h. Pan, Y. Luo, H. Wu and J. Zhang, A high efficiency broad-band near-infrared Ca2LuZr2Al3O12: Cr3+ garnet phosphor for blue LED chips, J. Mater. Chem. C, 2018, 6(18), 4967–4976 RSC.
- R. Martin-Rodriguez, R. Valiente, F. Rodriguez and M. Bettinelli, Temperature and pressure dependence of the optical properties of Cr3+-doped Gd3Ga5O12 nanoparticles, Nanotechnology, 2011, 22(26), 265707 CrossRef CAS.
- T. Liu, H. Cai, N. Mao, Z. Song and Q. Liu, Efficient near-infrared pyroxene phosphor LiInGe2O6: Cr3+ for NIR spectroscopy application, J. Am. Ceram. Soc., 2021, 104(9), 4577–4584 CrossRef CAS.
- D. Hayashi, A. M. van Dongen, J. Boerekamp, S. Spoor, G. Lucassen and J. Schleipen, A broadband LED source in visible to short-wave-infrared wavelengths for spectral tumor diagnostics, Appl. Phys. Lett., 2017, 110, 233701 CrossRef.
- H. Cai, S. Liu, Z. Song and Q. Liu, Tuning luminescence from NIR-I to NIR-II in Cr3+-doped olivine phosphors for nondestructive analysis, J. Mater. Chem. C, 2021, 9(16), 5469–5477 RSC.
- E. T. Basore, W. Xiao, X. Liu, J. Wu and J. Qiu, Broadband Near-Infrared Garnet Phosphors with Near-Unity Internal Quantum Efficiency, Adv. Opt. Mater., 2020, 8(12), 2000296 CrossRef CAS.
- M. Zhao, S. Liu, H. Cai, F. Zhao, Z. Song and Q. Liu, Efficient broadband near-infrared phosphor Sr2ScSbO6: Cr3+ for solar-like lighting, Sci. China Mater., 2021, 65(3), 748–756 CrossRef.
- W. T. Huang, T. Y. Su, M. H. Chan, J. Y. Tsai, Y. Y. Do, P. L. Huang, M. Hsiao and R. S. Liu, Near-Infrared Nanophosphor Embedded in Mesoporous Silica Nanoparticle with High Light-Harvesting Efficiency for Dual Photosystem Enhancement, Angew. Chem., Int. Ed., 2021, 60(13), 6955–6959 CrossRef CAS PubMed.
- D. Liu, G. Li, P. Dang, Q. Zhang, Y. Wei, H. Lian, M. Shang, C. C. Lin and J. Lin, Simultaneous Broadening and Enhancement of Cr3+ Photoluminescence in LiIn2SbO6 by Chemical Unit Cosubstitution: Night-Vision and Near-Infrared Spectroscopy Detection Applications, Angew. Chem., Int. Ed., 2021, 60(26), 14644–14649 CrossRef CAS PubMed.
- D. C. Huang, X. G. He, J. R. Zhang, J. Hu, S. S. Liang, D. J. Chen, K. Y. Xu and H. M. Zhu, Efficient and thermally stable broadband near-infrared emission from near zero thermal expansion AlP3O9: Cr3+ phosphors, Inorg. Chem. Front., 2022, 9(8), 1692–1700 RSC.
- J. Zhong, C. Li, W. Zhao, S. You and J. Brgoch, Accessing High-Power Near-Infrared Spectroscopy Using Cr3+-Substituted Metal Phosphate Phosphors, Chem. Mater., 2022, 34(1), 337–344 CrossRef CAS.
- Y. Wang, Z. J. Wang, G. H. Wei, Y. B. Yang, S. X. He, J. H. Li, Y. W. Shi, R. Li, J. W. Zhang and P. L. Li, Highly Efficient and Stable Near-Infrared Broadband Garnet Phosphor for Multifunctional Phosphor-Converted Light-Emitting Diodes, Adv. Opt. Mater., 2022, 10(11), 2200415 CrossRef CAS.
- K. Li and R. Van Deun, Ca3La2Te2O12:Mn4+, Nd3+, Yb3+: an efficient thermally-stable UV/visible–far red/NIR broadband spectral converter for c-Si solar cells and plant-growth LEDs, Mater. Chem. Front., 2019, 3(3), 403–413 RSC.
- L. Zhang, L. Dong, B. Shao, S. Zhao and H. You, Novel NIR LaGaO3: Cr3+, Ln3+ (Ln = Yb, Nd, Er) phosphors via energy transfer for C-Si-based solar cells, Dalton Trans., 2019, 48(30), 11460–11468 RSC.
- P. K. Tawalare, V. B. Bhatkar, S. K. Omanwar and S. V. Moharil, Near-infrared emitting Ca5 (PO4)3Cl: Eu2+, Nd3+ phosphor for modification of the solar spectrum, Luminescence, 2018, 33(7), 1288–1293 CrossRef CAS.
- K. Li and R. Van Deun, Enhancing the energy transfer from Mn4+ to Yb3+ via a Nd3+ bridge role in Ca3La2W2O12: Mn4+, Nd3+, Yb3+ phosphors for spectral conversion of c-Si solar cells, Dyes Pigm., 2019, 162, 990–997 CrossRef CAS.
- J. H. O'Donnell, R. B. Von Dreele, M. K. Y. Chan and B. H. Toby, A scripting interface for GSAS-II, J. Appl. Crystallogr., 2018, 51(4), 1244–1250 CrossRef.
- S. He, L. L. Zhang, J. N. Zhang, Z. D. Hao, H. Wu, H. J. Wu, Y. S. Luo, G. H. Pan, F. Liu and J. H. Zhang, Cr3+ and Nd3+ co-activated garnet phosphor for NIR super broadband pc-LED application, Mater. Res. Bull., 2022, 151, 111797 CrossRef CAS.
- H. Lin, T. Yu, G. Bai, M.-K. Tsang, Q. Zhang and J. Hao, Enhanced energy transfer in Nd3+/Cr3+ co-doped Ca3Ga2Ge3O12 phosphors with near-infrared and long-lasting luminescence properties, J. Mater. Chem. C, 2016, 4(16), 3396–3402 RSC.
- X. Luo, X. Yang and S. Xiao, Conversion of broadband UV-visible to near infrared emission by LaMgAl11O19: Cr3+, Yb3+ phosphors, Mater. Res. Bull., 2018, 101, 73–82 CrossRef CAS.
- G. BLASSE, Energy transfer between inequivalent Eu2+ ions, J. Solid State Chem., 1986, 62(2), 207–211 CrossRef CAS.
- D. L. Dexter and J. H. Schulman, Theory of Concentration Quenching in Inorganic Phosphors, J. Chem. Phys., 1954, 22(6), 1063–1070 CrossRef CAS.
- R. Reisfeld, E. Greenberg, R. Velapoldi and B. Barnett, Luminescence Quantum Efficiency of Gd and Tb in Borate Glasses and the Mechanism of Energy Transfer between Them, J. Chem. Phys., 1972, 56(4), 1698–1705 CrossRef CAS.
- Y. Zhou, C. Li and Y. Wang, Crystal-Field Engineering Control of an Ultraviolet-Visible- Responsive Near-Infrared-Emitting Phosphor and Its Applications in Plant Growth, Night Vision, and NIR Spectroscopy Detection, Adv. Opt. Mater., 2022, 10(8), 2102246 CrossRef CAS.
- H. Zhang, J. Zhong, F. Du, L. Chen, X. Zhang, Z. Mu and W. Zhao, Efficient and Thermally Stable Broad-Band Near-Infrared Emission in a KAlP2O7:Cr3+ Phosphor for Nondestructive Examination, ACS Appl. Mater. Interfaces, 2022, 14(9), 11663–11671 CrossRef CAS PubMed.
- G. Nofuentes, B. Garcia-Domingo, J. V. Munoz and F. Chenlo, Analysis of the dependence of the spectral factor of some PV technologies on the solar spectrum distribution, Appl. Eng., 2014, 113, 302–309 CrossRef CAS.
| This journal is © The Royal Society of Chemistry 2022 |

