 Open Access Article
Multiple fluorescence response behaviours to proteins/bacteria and selective antibacterial activity of cetylpyridinium chloride (CPC)-based cationic carbon dots†
Cheng Yanga and
Hao Xie *b
*b
aCollege of Biological Science and Agriculture, Qiannan Normal University for Nationalities, Duyun 558000, Guizhou, China
bSchool of Chemistry, Chemical Engineering and Life Sciences, Wuhan University of Technology, Wuhan 430070, China. E-mail: h.xie@whut.edu.cn
First published on 12th August 2022
Abstract
Direct interaction between carbon dots (CDs) and biomolecules leads to changes in the chemical and physical status as well as properties of CDs, which can have various biological and biomedical applications. In this work, the surface of CDs was modified with cetylpyridinium chloride (CPC) to facilitate interactions between CDs and biomolecules. Multiple fluorescence response behaviours of CPC-based CDs were observed towards several proteins (bovine serum albumin, lysozyme, protamine, and hemoglobin) and bacterial cells (Escherichia coli and Staphylococcus aureus). Electrostatic attraction and hydrogen bonding were involved in inducing aggregation of CDs and fluorence enhancement. An inner filter effect might also occur to reduce fluorescence of CDs when interacting with proteins. Selective antibacterial activity of CPC-based CDs was observed towards Gram positive bacterium Staphylococcus aureus. This work provides potential to develop CD-based techniques for detecting and visualizing proteins/bacteria as well as selective antibacterial agents towards Gram-positive bacteria.
Introduction
Nanomaterials with novel functions attract significant attention from researchers in a variety of fields. Carbon dots (CDs) are a type of nanomaterial with excellent fluorescence properties, tunable surface functionalities, high biocompatibility, low toxicity and simple and versatile synthetic routes.1–7 These properties provide CDs with great potential in biological or biomedical applications such as bioimaging,8–13 biosensors,14–16 photothermal/photodynamic therapy,17,18 and antibacterial agents.19–21 CDs are often composed of a nucleus of sp2/sp3 hybridized C atoms with the average particle size less than 10 nm.4 Abundant surface groups with H, O, N atoms endow carbon dots with good water solubility and diverse biological applications.4,22Biomolecules such as proteins, nucleic acids, and lipids are key players in biological processes and responsible for biological functions. Structural changes of biomolecules can alternate biological functions and result in significant impacts on individuals.22 The size and surface properties of CDs allow direct and precise interactions between CDs and biomacromolecules. Therefore, one can take advantages of CDs to disturb the structure and function of biomolecules.23–26 Previous studies showed that interactions between proteins and CDs could result in changes of protein structure,23 protein fibrillation properties,24 or enzyme activity.25,26 CDs can also be used as fluorescence probes to label biomolecules.16,22 Researchers exploited fluorescence quenching or enhancement of CDs after interacting with proteins and showed potentials of these CDs as measurable molecular probes for detecting and imaging biomolecules.22,31
Synthesis of CDs has be achieved by taking advantages of various methods such as chemical oxidation, laser ablation, electrochemical method, hydrothermal, solvothermal and microwave-assisted reactions.3 Properties and functions of CDs are affected by precursors and methods using for synthesizing.4 Cetylpyridinium chloride (CPC) is a kind of cationic surfactant and has been used as the carbon precursor for synthesizing CDs at ambient conditions.27,28,33 The CPC-based CDs are with good dispersity and homogeneity, low toxicity, as well as excellent fluorescence properties. These CPC-based CDs have been attempted for imaging eukaryotic cells as well as detecting and analysing iodine.27,28
However, interactions between CPC-based CDs and biomacromolecules as well as fluorescence characteristics are not clear, which obstruct further applications of CPC-based CDs in biological systems. In addition, CPC is positively charged and interacts with the negatively charged microbial cell surfaces, which will destroy the integrity of cell membrane and lead to the death of microbial cells. It provides CPC with broad-spectrum antimicrobial activity. Therefore, it is interested that whether CPC-based CDs still remain antimicrobial activity and can be used as an antibacterial agent or bioimaging agent for bacterial cells.
This work aims to investigate the interactions between CPC-based CDs and proteins/bacterial cells. The CPC-based CDs were synthesized by using a one-pot approach and characterized by means of TEM, FTIR and XPS. Fluorescence response behaviours of CPC-based CDs were explored upon interacting with several proteins (bovine serum albumin, lysozyme, protamine, and hemoglobin) and bacterial cells (Escherichia coli and Staphylococcus aureus). Selective antibacterial activity of CPC-based CDs to bacteria was also examined. The present work brings insight into the interactions between CPC-based CDs and proteins/bacterial cells, which is essential and fundamental for practical applications of CDs in biological systems.
Results and discussion
Characterization of CPC-based carbon dots
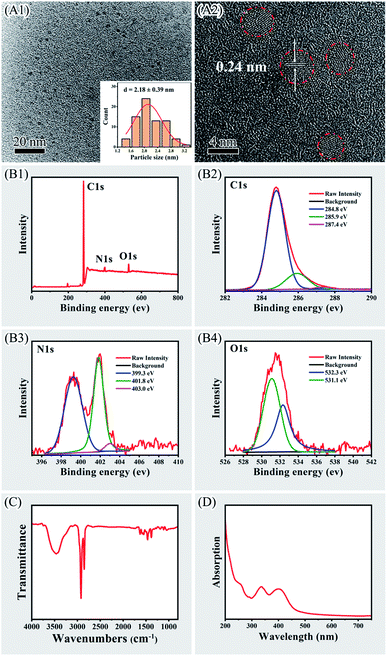
CPC-based CDs were synthesized according to previous reports.27,28 Morphology of as-prepared CPC-based CDs were visualized with TEM, which showed that the CDs were near spherical and well dispersed from each other (Fig. 1, panel A1). The size distribution histogram and Gaussian fitting curve (Fig. 1, panel A1, inset) suggested that the size of CDs was 2.18 ± 0.39 nm with a relatively narrow size distribution. The HR-TEM image of the CDs (Fig. 1, panel A2) indicated the lattice spacing of 0.24 nm.The composition and chemical state of carbon, oxygen and nitrogen elements in the CDs were analyzed with X-ray photoelectron spectroscopy (XPS). Typical peaks of C 1s, N 1s and O 1s elements were identified at 284, 400 and 530 eV in the XPS spectrum (Fig. 1, panel B1). The content of C, N, and O was 92.18%, 4.1%, and 3.72%, respectively. The band of C 1s at 284 eV was deconvoluted into three peaks, corresponding to C–C (284.8 eV), C–O/C–N (285.9 eV), and C![[double bond, length as m-dash]](https://www.rsc.org/images/entities/char_e001.gif) O (287.4 eV),27 which implied the presence of carboxylic and hydroxyl groups on the surface of the CDs (Fig. 1, panel B2). The N 1s band at 400 eV were deconvoluted into three peaks at 399.3, 401.8 eV and 403.0 eV, representing C–N–C structure such as pyridine type, positively charged quaternary ammonium group –N+–(C)3 and N–H, respectively (Fig. 1, panel B3).27,42 These nitrogen-containing structure could be pyridine ring or quaternary ammonium moiety originated from CPC. The O 1s band at 530 eV was deconvolved into two peaks at 531.1 eV and 532.3 eV, representing C–O and C
O (287.4 eV),27 which implied the presence of carboxylic and hydroxyl groups on the surface of the CDs (Fig. 1, panel B2). The N 1s band at 400 eV were deconvoluted into three peaks at 399.3, 401.8 eV and 403.0 eV, representing C–N–C structure such as pyridine type, positively charged quaternary ammonium group –N+–(C)3 and N–H, respectively (Fig. 1, panel B3).27,42 These nitrogen-containing structure could be pyridine ring or quaternary ammonium moiety originated from CPC. The O 1s band at 530 eV was deconvolved into two peaks at 531.1 eV and 532.3 eV, representing C–O and C![[double bond, length as m-dash]](https://www.rsc.org/images/entities/char_e001.gif) O, respectively (Fig. 1, panel B4).27,43 It implied the presence of oxygen-containing groups such as carboxylic and hydroxyl groups on the surface of CDs.
O, respectively (Fig. 1, panel B4).27,43 It implied the presence of oxygen-containing groups such as carboxylic and hydroxyl groups on the surface of CDs.
Surface groups of the CDs were verified with Fourier transform infrared spectroscopy (FTIR, Fig. 1, panel C). Broad absorption was observed around 3450 cm−1 that was attributed to the O–H/N–H stretching.27 Strong absorption observing at 2921 cm−1 and 2850 cm−1 were attributed to the stretching vibrations of C–H from CH3 and CH2 moieties corresponding to CH3 and CH2 moieties in CPC.27,28 The absorption observing at 1628 cm−1 was probably due to the vibrations of C![[double bond, length as m-dash]](https://www.rsc.org/images/entities/char_e001.gif) N.40 The absorption observing at 1465 cm−1 and 1380 cm−1 were assigned to the characteristic absorption of the pyridine ring.40,41 These results confirmed the presence of pyridinium rings and the aliphatic carbon deriving from CPC on the surface of the CDs. Since CPC comprised a cationic quaternary ammonium moiety, it provides positive charge on the surface of CDs. This was verified with the observation that the zeta potential of the CDs was 19.7 ± 2.1 mV in phosphate buffer (20 mM, pH 7.0). UV-vis spectrometry of the CDs revealed two absorbance peaks at 336 and 400 nm corresponding to the π–π* and n–π* transitions, respectively (Fig. 1, panel D).27 The absorption peak near 256 nm was corresponding to CPC residues on surface of CDs.27,33 Previous study showed that the quantum yield of the CDs was about 7.2% in H2O.27
N.40 The absorption observing at 1465 cm−1 and 1380 cm−1 were assigned to the characteristic absorption of the pyridine ring.40,41 These results confirmed the presence of pyridinium rings and the aliphatic carbon deriving from CPC on the surface of the CDs. Since CPC comprised a cationic quaternary ammonium moiety, it provides positive charge on the surface of CDs. This was verified with the observation that the zeta potential of the CDs was 19.7 ± 2.1 mV in phosphate buffer (20 mM, pH 7.0). UV-vis spectrometry of the CDs revealed two absorbance peaks at 336 and 400 nm corresponding to the π–π* and n–π* transitions, respectively (Fig. 1, panel D).27 The absorption peak near 256 nm was corresponding to CPC residues on surface of CDs.27,33 Previous study showed that the quantum yield of the CDs was about 7.2% in H2O.27
Photoluminescence of CPC-based CDs
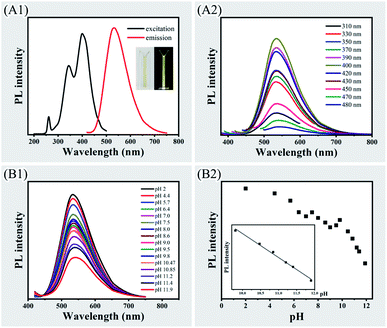
Although CPC-based CDs exhibited more than one excitation band, the maximum exciting wavelength was at 400 nm (Fig. 2, panel A1). When exciting at wavelength of 400 nm, the emission wavelength presented at 536 nm (Fig. 2, panel A1). The aqueous solution of dispersed CDs presented as a light-yellow transparent liquid and have yellow-green emission under UV light (Fig. 2, panel A1, inset). When the CDs was excited under various exciting wavelength in the range of 310–430 nm, the emission peaks remained almost the same at 536 nm (Fig. 2, panel A2). Slight redshifts of the emission peaks were observed with the exciting wavelength at 450–480 nm.The influence of pH was investigated on photoluminescence emission. The emission peak of CDs was slightly shifted along with the change of pH value (Fig. 2, panel B1). There was significant reduction of the PL intensity along with decreasing concentrations of protons. The photoluminescence emission quenching was steadier at the range of pH 4.4–9.8 than pH 9.8–11.9 (Fig. 2, panels B1 and B2). The plots of PL intensity exhibited a good linearity (r = 0.99) over the pH ranging from 9.8–11.9 (Fig. 2, panel B2, inset). The pH dependency of the PL emission was due to proton transfer mechanism.44,45 XPS and FTIR analysis revealed that there were pyridyl group on the surface of the CDs, where the pyridinic nitrogen interact with protons and can be protonated. The protons then transfer from the protonated nitrogen to the conjugated carbon structure and it enhances the fluorescence. Saturation of nitrogen sites to proton occurs when pH value is decreasing, which leads to less interactions of protons with CDs. This explains higher PL intensity was observed at high pH range than low pH range.
Fluorescence response behaviours of bovine serum albumin (BSA) to CPC-based CDs
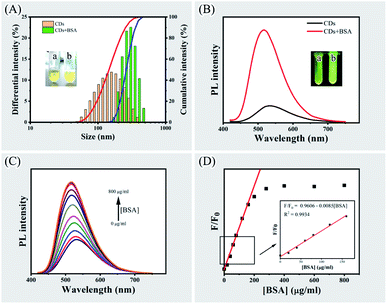
When mixing BSA with CPC-based CDs at a relatively high density (that is, 0.3 mg of CDs and 1.6 mg of BSA in 400 μL phosphate buffer pH 7.0), aggregation occurred and the solution immediately changed from clear to cloudy. Dynamic light scattering measurement showed that the size of particles in CDs solution and BSA solution was 170.2 ± 74.0 nm and 5.8 ± 0.9 nm. After mixing CDs with BSA at relatively low density, the particle size was increased to 290.1 ± 67.3 nm, implying the formation of CDs-BSA aggregates (Fig. 3, panel A).Under UV light, the fluorescence changed from yellow to green and the brightness increased significantly after mixing CDs with BSA (Fig. 3, panel B). Fluorescence spectrometry showed that the PL intensity increased approximately 6-fold and the emission peak had a blueshift from 535 nm to 515 nm after mixing CDs with BSA. The aggregation induced emission enhancement (AIEE) was due to the decrease of non-radiative rate and the increase of radiative rate since aggregation hampers rotational vibration of surface groups and increase the extent of π-conjugation of fluorescent materials.1 Similar phenomena of blue-shift and enhancement of PL emission were observed in nanomaterial aggregation systems such as silver nanoclusters and gold nanoclusters.30,32
Mixing CDs with increasing amount of BSA led to increasing PL intensity and blue-shifts of the emission peak from 535 nm to 515 nm (Fig. 3, panels C and D). The plots of relative PL intensity F/F0 (F and F0 refer to PL intensity with or without addition of BSA) against the concentration of BSA exhibited a good linearity (r = 0.993) with BSA concentrations ranging from 0 to 160 μg mL−1 (Fig. 3, panel D, inset). Raising the concentration of BSA over 280 μg mL−1 did not significantly increase PL intensity, indicating interaction between the CDs and BSA has reached a saturation level.
Interaction between CPC-based CDs and BSA was confirmed by quenching BSA fluorescence with increasing amount of the CDs. BSA exhibits strong PL emission at 342 nm under exciting at 284 nm owing to tryptophan, tyrosine and phenylpropane amino acid residues. The CPC-based CDs do not have PL emission under exciting at 284 nm (Fig. S1, panel A, see ESI†). When mixing BSA with the CDs, it was observed that the PL emission of BSA at 342 nm were significantly quenched (Fig. S1, panel B, see ESI†). This was due to inner filter effect (IFE).16,34 The UV-vis spectra showed CDs has absorption peak at 344 and 400 nm that overlap with the emission spectrum of the BSA (Fig. S1, panel C, see ESI†). When exciting at 284 nm, the PL emission of BSA was absorbed by CDs and led to the fluorescence quenching of BSA.
Multiple fluorescence response behaviours of lysozyme, protamine and hemoglobin to CPC-based CDs
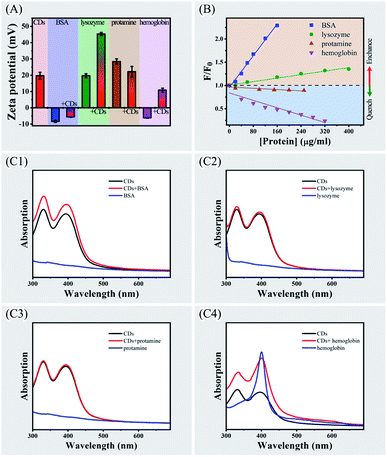
Interactions between several proteins (lysozyme, protamine and hemoglobin) and CPC-based CDs were investigated as well as fluorescence response behaviours of these proteins to CPC-based CDs. The zeta potential of CDs was measured as 19.7 ± 2.1 mV in phosphate buffer at pH 7.0 (Fig. 4, panel A). There were significant changes of zeta potentials upon mixing with proteins except protamine that did not affect zeta potential of CDs. This observation indicated that there were strong interactions between CDs and BSA, or lysozyme, or hemoglobin. While there was weak or no interaction between CDs and protamine.Fluorescence spectroscopy of the CDs were then compared before and after mixing with these proteins. Similar to BSA, lysozyme enhanced PL emission of the CDs and exhibited slight blue shift (Fig. S2, panel A, see ESI†). While protamine slightly quenched PL emission of the CDs without wavelength change (Fig. S2, panel B, see ESI†). Hemoglobin strongly quenched the PL emission of the CDs and exhibited blue shift (Fig. S2, panel C, see ESI†). The plots of relative PL intensity F/F0 against concentrations of the four proteins exhibited a good linearity with protein concentrations ranging from 0 to 400 μg mL−1 (Fig. 4, panel B). Although both BSA and lysozyme enhanced PL intensity of the CDs, the enhancement by BSA is higher than that of lysozyme. Protamine did not significantly affect the PL intensity of CDs, implying there was no strong interactions between the two agents. The differential fluorescence responses of the four proteins to CDs implied the complexity of protein–CDs interactions.
The protein–CDs interactions were then analyzed by using UV-vis absorption spectrometry (Fig. 4, panels C1–C4). BSA, lysozyme and protamine did not have obvious adsorption in the range of 300–700 nm. While hemoglobin exhibited a strong absorption peak at 400 nm. When mixing CDs with BSA or hemoglobin, a broad absorption enhancement was observed in the range of 300–550 nm in comparing with CDs alone. While for lysozyme or protamine, there was no significant enhancement of the absorption of the CDs. Other researchers also observed strong and broad absorption enhancement in other metal nanocluster aggregation system, which might be ascribed to the closely interacted nanoparticles of the aggregation.30,32 Therefore, there could be strong aggregation of CDs inducing by BSA or hemoglobin.
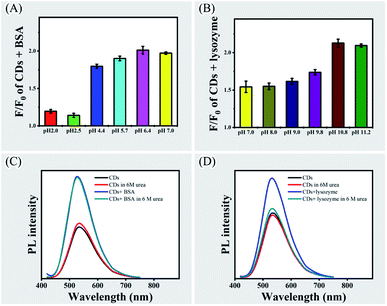
Since the surface of CPC-based CDs contains positively charged groups, two proteins (BSA with isoelectric point of 4.7 and lysozyme with isoelectric point of 10.7) were compared for their ability in enhancing PL emission of CDs in various pH (Fig. 5, panels A and B). There was significant increase of PL emission of CDs when increasing pH above the isoelectric points of the two proteins, which suggested electrostatic interaction is an important factor in promoting aggregations of CDs by proteins.
It was observed that lysozyme had influence in increasing PL emission of CDs below its isoelectric point. Therefore, other factors might also affect aggregations of CDs. FTIR and XPS spectrometry showed that there were oxygen-containing groups such as carboxylic and hydroxyl groups and nitrogen-containing group such as amino group or pyridine group on the surface of the CDs. The amino acid residues of proteins could be involved in forming hydrogen bonds with oxygen-containing groups or nitrogen-containing group on CDs. In the present study, high concentration of urea was used to break hydrogen bonds46 and the PL emission of CDs with BSA or lysozyme was analyzed in the presence of 6 M urea at pH 7.0 (Fig. 5, panels C and D). It was found that urea did not affect PL emission of the CDs or CDs with BSA. While the PL emission of CDs with lysozyme was strongly inhibited by urea. This observation suggested that hydrogen bond can be another factor in mediating interactions between CDs and lysozyme.
Unlike BSA and lysozyme, the presence of hemoglobin strongly quenched the fluorescence of the CDs. Zeta potential value of hemoglobin was −6.1 ± 0.2 mV, implying electrostatic attractive force made the major contribution to interactions between hemoglobin and CDs. UV-vis spectra of hemoglobin showed a strong absorption peak at 400 nm that did not present in other three proteins (Fig. S3, see ESI†). This absorption peak overlaps with the excitation spectrum of the CDs, indicating there was an inner filter effect (IFE) between hemoglobin and the CDs.16,35 When exciting at 400 nm, the excitation light was absorbed by hemoglobin, which weakened excitation energy, leading to fluorescence quenching of CDs. Since fluorescence quenching was significant at very low concentrations of hemoglobin, it provides the potential to develop facile and ultrasensitive IFE-based fluorescent assay for detecting hemoglobin.
Differential fluorescence response behaviours of bacteria to CPC-based CDs
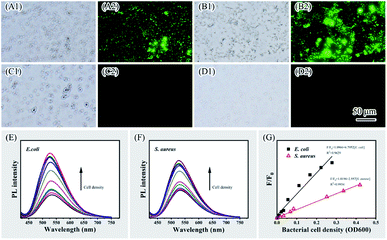
Direct interactions between nanomaterials (such as AuNPs, QDs or CDs) and bacterial cells leading to fluorescence changes of nanomaterials or physiological property changes of the bacteria can be taken advantages for bacteria imaging or detection, as well as antibacterial purposes.19,20,47–49 In the present study, interactions were also examined between CPC-based CDs and two types of bacterial cells (that is, Gram-negative bacterium Escherichia coli and Gram-positive bacterium Staphylococcus aureus). Although these two bacteria are distinct in surface composition, there are negatively charged biomolecules such as lipopolysaccharides, teichoic acid or proteins on the cell surface. Strong interactions between these molecules and positively charged CDs facilitated adsorption of CDs on bacterial surface that was observed by using fluorescence microscopy when the two types of bacterial cells were incubated with CDs (Fig. 6, panels A1, A2, B1, B2, C1, C2, D1 and D2). Under blue light excitation, both E. coli and S. aureus cells exhibited bright green fluorescence. Owing to the strong electrostatic attractive interaction between cell surface and CDs, labelling bacterial cells with CDs was achieved within 5 minutes, which provided a convenient approach for quick fluorescence imaging of bacterial cells.When examining with fluorescence spectrometry, emission enhancement and blueshift were observed when adding increasing amount of E. coli or S. aureus cells to CDs solution (Fig. 6, panels E and F). The AIEE of CDs was induced by surface components of bacterial cells. The relative fluorescence intensity F/F0 exhibited a linear response to the E. coli or S. aureus cell density within a certain range (Fig. 6, panel G). Although they both enhanced the emission, the enhancement by E. coli is significantly higher than S. aureus. The complexity and diversity of surface molecules on cell surface may lead to differential emissive response behaviours of bacterial cells when interacting with CDs. It provides potentials to take advantages of CDs as a fluorescent probe for detecting and distinguishing different kind of bacteria.
Selective antibacterial activity of CPC-based CDs
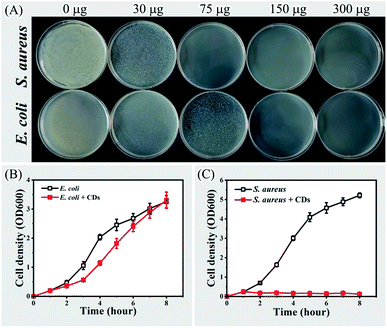
It is common for cationic carbon dots to have antibacterial effects.19,20,49 Since drug-resistant bacterial infection is a serious global problem, it is extremely useful to develop effective antimicrobial agents for specific types of bacteria, especially Gram-positive bacteria.36–39 In the present study, the selective antibacterial activity of CPC-based CDs was tested by inhibiting the growth of E. coli or S. aureus. When cultivating bacterial cells with various amounts of CDs on solid LB medium, it was observed that the growth of E. coli was completely inhibited by 150 μg of CDs (Fig. 7, panel A). While it only required 75 μg of CDs to inhibit the growth of S. aureus. When cultivating in liquid LB medium, the growth of E. coli was delayed in the presence of 2 μg mL−1 CDs. However, the growth of S. aureus was completely inhibited under the same condition (Fig. 7, panels B and C).The selective antibacterial activity of CPC-based CDs could be attributed to the difference of interacting mechanisms between CPC-based CDs and Gram-positive/Gram-negative bacteria. Gram-negative bacteria such as E. coli have an extra outer membrane with lipopolysaccharides in comparing with that of Gram-positive bacteria such as S. aureus. FTIR and XPS spectrometry showed there were alkyl chains and positively charged quaternary ammonium group on the surface of CPC-based CDs. The alkane chain endowed the CDs with hydrophobic properties and the quaternary ammonium group endowed the CDs with positive charged. When interacting with Gram-positive bacteria, CPC-based CDs will adsorb on the peptidoglycan layer of Gram-positive bacteria through electrostatic adsorption. The CDs will then penetrate the cell wall and interact with the cell membrane through hydrophobic interactions, which will lead to the death of the bacteria. For Gram-negative bacteria, lipopolysaccharides on cell surface are cross-linked under the effects of divalent cations. It prevents hydrophobic molecules such as CPC-based CDs from approaching phospholipids.36,39 Therefore, Gram-positive bacteria are sensitive to lipophilic molecules than Gram-negative bacteria.50 Previous reports of antibacterial agents containing quaternary ammonium groups with alkyl chains also showed that these agents could selectively kill Gram-positive bacteria.36,39,51,52 Therefore, CPC-based CDs is a potential selective antibacterial agent for Gram-positive bacteria.
Experimental
Materials
Cetylpyridinium chloride monohydrate (CPC), bovine serum albumin BSA-V (BSA), lysozyme, protamine from salmon, bovine hemoglobin (Hb) and urea were obtained from Shanghai Macklin Biochemical Co., Ltd Hydrochloric acid (HCl), NaOH, NaH2PO4·2H2O and Na2HPO4·12H2O were purchased from Sinopharm Chemical Reagent Co., Ltd.Synthesis and characterization of cationic carbon dots
Cationic carbon dots were one-step synthesized at room temperature.27,28 Typically, 0.36 g of NaOH was dissolved in 5 mL deionized water, and 0.268 g of CPC was dissolved in 50 mL deionized water. The two solutions were mixed and shaken for 5 minutes. Then the mixture was left to stand at room temperature for 6 hours. The reaction was terminated by supplying with 1 M HCl to the solution until the pH decreased to 7.0. The solution was transferred to dialysis bag (the molecular weight cut-off of 1 kDa) to dialyze against de-ionised water for 48 hours. The synthesized CDs were obtained by vacuum freeze-drying and stored at −20 °C.Transmission electron microscopic (TEM) images of as prepared CDs were acquired on a JEOL JEM-2100F transmission electron microscope (Japan) with an accelerating voltage of 200 kV. XPS spectra were measured on a ESCALAB 250Xi spectrometer (Thermo Fisher, USA). FTIR spectrometry was performed on a Bruker INVENIO-S FTIR spectrometer (Bruker, USA). The dynamic light scattering (DLS) and zeta potentials were measured on Malvern Zetasizer Nano ZS90 (Malvern Instruments, UK).
Fluorescence and UV-vis spectrometry
All fluorescence measurements were performed on a F97Pro fluorescence spectrophotometer (Shanghai Lengguang Technology, China). UV-vis spectra were recorded on a Macy UV-1800 UV Visible Spectrophotometer (Macylab Instruments, China).For testing influences of proteins on fluorescence change and UV-vis adsorption of CDs, proteins were dissolved in phosphate buffer (20 mM, pH 7.0) at a concentration of 40 mg mL−1. Different amounts of proteins were then mixed with 1 mL phosphate buffer (20 mM, pH 7.0) containing 20 μL CDs. The fluorescence emission exciting at 400 nm was recorded.
For testing influences of bacteria on fluorescence change of CDs, bacterial cells were diluted in phosphate buffer (20 mM, pH 7.0). Different amounts of bacterial cells were then mixed with 1 mL phosphate buffer (20 mM, pH 7.0) containing 20 μL CDs and the PL emission exciting at 400 nm was recorded.
Bacterial cultivation and fluorescence microscopy
Two bacterial strains Escherichia coli DH5α and Staphylococcus aureus were cultured in Luria-Bertani (LB) medium with shaking for eight hours at 37 °C and harvested by centrifugation at 8000g for 5 minutes.For fluorescence microscopy imaging, bacterial cells were treated with CDs for 5 minutes and harvested by centrifugation. After washing with phosphate buffer (20 mM, pH 7.0), the cells were subjected to analysis with an inverted fluorescence microscope (CKX53, Olympus, Japan). Emissions were examined under blue-excitation.
Antibacterial test
For testing effects of CDs on bacteria growing on solid surface, aliquots of bacterial suspension in phosphate buffer (pH 7.0) were mixed with various amounts of CDs and spread on LB agar plates. The plates were then incubated at 30 °C for 24 hours to allow bacterial growth.For testing effects of CDs on bacteria growing in liquid media, single colony of E. coli or S. aureus was inoculated in LB medium, followed by shaking overnight at 37 °C. Then, 0.5 mL overnight cell culture was used to inoculate 50 mL cultures in LB medium. After 1 hour of shaking at 37 °C, 100 μg of the CDs were added into the cultures. Cell growth was monitored by measuring cell density at OD600.
Conclusions
CDs is a powerful tool for visualizing and detecting biomolecules as well as other biological purposes. In the present work, a one-pot synthesized CDs with the cationic surfactant cetylpyridinium chloride as the precursors was examined for interacting with proteins (that is, BSA, lysozyme, protamine and hemoglobin) as well as bacteria (that is, S. aureus and E. coli). Fluorescence emission enhancement of CDs was observed when interacting with BSA or lysozyme. Electrostatic attraction between CDs and BSA or lysozyme contributed to aggregation induced emission enhancement (AIEE) of the CDs.29,30,32 The formation of hydrogen bonds between CDs and lysozyme is another factor leading to AIEE. No significant effects of protamine on PL emission of CDs, implying there was weak or no interaction between the two agents. There was significant fluorescence quench of CDs when interacting with hemoglobin, which could be due to inner filter effect.16,35 AIEE of CDs was also observed when interacting with bacterial cells. The emission enhancement inducing by E. coli was higher than that by S. aureus. In addition, selective antibacterial activity of CPC-based CDs was observed on Gram-positive bacteria S. aureus.The present study revealed multiple fluorescence response behaviours to proteins/bacteria as well as selective antibacterial activity of CPC-based CDs. It provides potentials to develop CDs-based techniques for quick detecting and distinguishing proteins/bacteria as well as a selective antibacterial agent for Gram-positive bacteria.
Author contributions
Cheng Yang: conceptualization, methodology, investigation, formal analysis, writing – original draft. Hao Xie: conceptualization, validation, visualization, writing – review & editing, funding acquisition, supervision.Conflicts of interest
There are no conflicts to declare.Acknowledgements
This work was financially supported by the National Natural Science Foundation of China (31771032, 51911530153).References
- M. L. Liu, B. B. Chen, C. M. Li and C. Z. Huang, Sci. China: Chem., 2019, 62(8), 968–981 CrossRef CAS.
- W. Su, H. Wu, H. M. Xu, Y. Zhang, Y. C. Li, X. H. Li and L. N. Fan, Mater. Chem. Front., 2020, 4(3), 821–836 RSC.
- S. Y. Lim, W. Shen and Z. Gao, Chem. Soc. Rev., 2015, 44(1), 362–381 RSC.
- L. Ethordevic, F. Arcudi, M. Cacioppo and M. Prato, Nat. Nanotechnol., 2022, 17(2), 112–130 CrossRef PubMed.
- M. L. Liu, B. B. Chen, C. M. Li and C. Z. Huang, Green Chem., 2019, 21(3), 449–471 RSC.
- L. Rodrigues, A. Sonsin, C. Barbosa, D. Oliveira, E. Fonseca, C. Dornelas, A. Ribeiro and L. Costa, J. Nanopart. Res., 2021, 23, 262 CrossRef CAS.
- A. Sonsin, S. Nascimento, I. Albuquerque, E. Silva, J. Rocha, R. Oliveira, C. Barbosa, S. Souza and E. Fonseca, RSC Adv., 2021, 11(5), 2767–2773 RSC.
- D. Y. Zhang, Y. Zheng, H. Zhang, L. He, C. P. Tan, J. H. Sun, W. Zhang, X. Peng, Q. Zhan, L. N. Ji and Z. W. Mao, Nanoscale, 2017, 9(47), 18966–18976 RSC.
- J. H. Liu, R. S. Li, B. Yuan, J. Wang, Y. F. Li and C. Z. Huang, Nanoscale, 2018, 10(36), 17402–17408 RSC.
- R. S. Li, P. F. Gao, H. Z. Zhang, L. L. Zheng, C. M. Li, J. Wang, Y. F. Li, F. Liu, N. Li and C. Z. Huang, Chem. Sci., 2017, 8(10), 6829–6835 RSC.
- S.-F. Ou, Y.-Y. Zheng, S.-J. Lee, S.-T. Chen, C.-H. Wu, C.-T. Hsieh, R.-S. Juang, P.-Z. Peng and Y.-H. Hsueh, Crystals, 2021, 11(7), 789 CrossRef CAS.
- A. F. Sonsin, E. C. O. Silva, A. L. X. Marques, L. Silva, S. M. S. Nascimento, S. T. Souza, A. U. Borbely, C. Barbosa and E. J. S. Fonseca, Nanotechnology, 2022, 33(23), 235708 CrossRef.
- T. Deng, R. Zhang, J. Wang, X. Song, F. Bao, Y. Gu and D. Deng, Part. Part. Syst. Charact., 2018, 35(9), 1800190 CrossRef.
- I. P.-J. Lai, S. G. Harroun, S.-Y. Chen, B. Unnikrishnan, Y.-J. Li and C.-C. Huang, Sens. Actuators, B, 2016, 228465–228470 Search PubMed.
- G. L. Li, W. H. Kong, M. Zhao, S. M. Lu, P. W. Gong, G. Chen, L. Xia, H. Wang, J. M. You and Y. N. Wu, Biosens. Bioelectron., 2016, 79, 728–735 CrossRef CAS PubMed.
- A. Barati, M. Shamsipur and H. Abdollahi, Biosens. Bioelectron., 2015, 71470–71475 Search PubMed.
- E. B. Kang, J. E. Lee, Z. A. I. Mazrad, I. In, J. H. Jeong and S. Y. Park, Nanoscale, 2018, 10, 2512–2523 RSC.
- N. Xia, D. Wu, T. Sun, Y. Wang, X. Ren, F. Zhao, L. Liu and X. Yi, Sens. Actuators, B, 2021, 327, 128913 CrossRef CAS.
- X. Hao, L. Huang, C. Zhao, S. Chen, W. Lin, Y. Lin, L. Zhang, A. Sun, C. Miao, X. Lin, M. Chen and S. Weng, Mater. Sci. Eng., C, 2021, 123111971 Search PubMed.
- H. J. Jian, R. S. Wu, T. Y. Lin, Y. J. Li, H. J. Lin, S. G. Harroun, J. Y. Lai and C. C. Huang, ACS Nano, 2017, 11(7), 6703–6716 CrossRef CAS PubMed.
- X. Dong, W. Liang, M. J. Meziani, Y. P. Sun and L. Yang, Theranostics, 2020, 10(2), 671–686 CrossRef CAS PubMed.
- Z. L. Peng, X. Han, S. H. Li, A. O. Al-Youbi, A. S. Bashammakh, M. S. El-Shahawi and R. M. Leblanc, Coord. Chem. Rev., 2017, 343, 256–277 CrossRef CAS.
- S. Huang, H. Qiu, S. Lu, F. Zhu and Q. Xiao, J. Hazard. Mater., 2015, 28518–28526 Search PubMed.
- S. H. Li, L. Y. Wang, C. C. Chusuei, V. M. Suarez, P. L. Blackwelder, M. Micic, J. Orbulescu and R. M. Leblanc, Chem. Mater., 2015, 27(5), 1764–1771 CrossRef CAS.
- J. B. Essner, R. N. McCay, C. J. Smith, S. M. Cobb, C. H. Laber and G. A. Baker, J. Mater. Chem. B, 2016, 4(12), 2163–2170 RSC.
- J. Ahlawat and M. Narayan, ACS Sustainable Chem. Eng., 2022, 10(14), 4610–4622 CrossRef CAS.
- B. Zheng, T. Liu, M. C. Paau, M. Wang, Y. Liu, L. Liu, C. Wu, J. Du, D. Xiao and M. M. F. Choi, RSC Adv., 2015, 5(15), 11667–11675 RSC.
- M. Wang, B. Zheng, F. Yang, J. Du, Y. Guo, J. Dai, L. Yan and D. Xiao, Analyst, 2016, 141(8), 2508–2514 RSC.
- Z. X. Liu, Z. L. Wu, M. X. Gao, H. Liu and C. Z. Huang, Chem. Commun., 2016, 52(10), 2063–2066 RSC.
- W. X. Wang, Y. Wu and H. W. Li, J. Colloid Interface Sci., 2017, 505577–505584 Search PubMed.
- S. Pandit, S. Mondal and M. De, J. Mater. Chem. B, 2021, 9(5), 1432–1440 RSC.
- A. Yahia-Ammar, D. Sierra, F. Merola, N. Hildebrandt and X. Le Guevel, ACS Nano, 2016, 10(2), 2591–2599 CrossRef CAS.
- O. Kozák, K. K. R. Datta, M. Greplová, V. Ranc, J. Kašlík and R. Zbořil, J. Phys. Chem. C, 2013, 117(47), 24991–24996 CrossRef.
- Q. Q. Li, M. J. Wen, Y. S. Zhang, Z. S. Guo, X. Bai, J. X. Song, P. Liu, Y. Y. Wang and J. L. Li, J. Hazard. Mater., 2022, 423, 127132 CrossRef CAS.
- G. Li, H. Fu, X. Chen, P. Gong, G. Chen, L. Xia, H. Wang, J. You and Y. Wu, Anal. Chem., 2016, 88(5), 2720–2726 CrossRef CAS PubMed.
- J. Yang, G. Gao, X. Zhang, Y.-H. Ma, X. Chen and F.-G. Wu, Carbon, 2019, 146827–146839 CAS.
- T. Feng, H. Lu, X. Ye, C. Nie, J. Zhang, L. Yu, H. Jin, P. Li and W. Huang, Sci. China Mater., 2021, 65(1), 237–245 CrossRef.
- J. Liang, W. Li, J. Chen, X. Huang, Y. Liu, X. Zhang, W. Shu, B. Lei and H. Zhang, ACS Appl. Bio Mater., 2021, 4(9), 6937–6945 CrossRef CAS PubMed.
- X. Ye, T. Feng, L. Li, T. Wang, P. Li and W. Huang, Acta Biomater., 2021, 12529–12540 Search PubMed.
- Y.-X. Sun, W.-Z. Zhang, J. Li, Y. Zhang and W.-K. Dong, Inorg. Chim. Acta, 2022, 531, 120723 CrossRef CAS.
- B. Dey, M. W. Ahmad, G. Sarkhel, D.-J. Yang and A. Choudhury, Mater. Sci. Semicond. Process., 2022, 142, 106500 CrossRef CAS.
- C. Zhao, X. Wang, L. Yu, L. Wu, X. Hao, Q. Liu, L. Lin, Z. Huang, Z. Ruan, S. Weng, A. Liu and X. Lin, Acta Biomater., 2022, 138528–138544 Search PubMed.
- W. Lu, X. Qin, S. Liu, G. Chang, Y. Zhang, Y. Luo, A. M. Asiri, A. O. Al-Youbi and X. Sun, Anal. Chem., 2012, 84(12), 5351–5357 CrossRef CAS PubMed.
- H. Ehtesabi, Z. Hallaji, S. Najafi Nobar and Z. Bagheri, Mikrochim. Acta, 2020, 187(2), 150 CrossRef CAS PubMed.
- Z. Qian, J. Ma, X. Shan, H. Feng, L. Shao and J. Chen, Chemistry, 2014, 20(8), 2254–2263 CrossRef CAS PubMed.
- P. Gao, S. Chen, S. Liu, H. Liu, Z. Xie and M. Zheng, ACS Appl. Mater. Interfaces, 2021, 13(47), 56456–56464 CrossRef CAS.
- S. C. Hayden, G. Zhao, K. Saha, R. L. Phillips, X. Li, O. R. Miranda, V. M. Rotello, M. A. El-Sayed, I. Schmidt-Krey and U. H. Bunz, J. Am. Chem. Soc., 2012, 134(16), 6920–6923 CrossRef CAS.
- C. Yang, H. Xie, Q. C. Li, E. J. Sun and B. L. Su, J. Colloid Interface Sci., 2015, 450388–450395 Search PubMed.
- P. Li, F. Han, W. Cao, G. Zhang, J. Li, J. Zhou, X. Gong, G. Turnbull, W. Shu, L. Xia, B. Fang, X. Xing and B. Li, Appl. Mater. Today, 2020, 19, 100601 CrossRef.
- E. Lien, C. Hansch and S. M. Anderson, J. Med. Chem., 1968, 11(3), 430 CrossRef CAS PubMed.
- J. Yang, X. Zhang, Y. H. Ma, G. Gao, X. Chen, H. R. Jia, Y. H. Li, Z. Chen and F. G. Wu, ACS Appl. Mater. Interfaces, 2016, 8(47), 32170–32181 CrossRef CAS.
- X. Zhang, X. Chen, J. Yang, H.-R. Jia, Y.-H. Li, Z. Chen and F.-G. Wu, Adv. Funct. Mater., 2016, 26(33), 5958–5970 CrossRef CAS.
Footnote |
| † Electronic supplementary information (ESI) available. See https://doi.org/10.1039/d2ra04084k |
| This journal is © The Royal Society of Chemistry 2022 |

