 Open Access Article
Creative Commons Attribution 3.0 Unported Licence
MultiShapeC, an algorithm to assess concentration in multi-shape nanoparticle samples: nanosilver, a case study†
Rodrigo Nicolás Núñez ab,
Alicia Viviana Veglia
 ab and
Natalia Lorena Pacioni
 *ab
*ab
aUniversidad Nacional de Córdoba, Facultad de Ciencias Químicas, Departamento de Química Orgánica, Haya de la Torre y Medina Allende s/n, Ciudad Universitaria, X5000HUA Córdoba, Argentina. E-mail: nataliap@fcq.unc.edu.ar; n.lpacioni@unc.edu.ar; Tel: +54-351-5353867 ext. 55374
bConsejo Nacional de Investigaciones Científicas y Técnicas (CONICET), INFIQC, Córdoba, Argentina
First published on 20th September 2022
Abstract
Shape, size, and dispersity play a crucial role in the calculation of colloidal nanoparticle concentrations, which results in remarkable differences in the determination of parameters like Stern–Volmer constants. In this work, we propose an algorithm named MultiShapeC to include the variability in shapes and polydispersity in the concentration calculation. This algorithm was validated using the quenching of carbazole fluorescence emission by silver nanoparticles.
Introduction
Engineered nanomaterials are undoubtedly relevant to different research areas. Since their discovery, these materials have shown many intriguing physicochemical properties leading to several applications in catalysis,1–4 biomedicine,5–9 sensing,10–15 electronics,16–18 and optics.19–23Anisotropic metallic particles, such as silver and gold nanorods, caught a particular interest for light-related applications since they exhibit two plasmon resonance bands.24,25 These extinction bands are the longitudinal surface plasmon resonance (LSPR), related to electron oscillations along the particle's length, and the transverse one (TSPR), corresponding to electron oscillations along their width. The position of LSPR and TSPR can be finely tuned by controlling the aspect ratio of the particles.26,27
In the case of silver nanorods (AgNR), synthetic protocols usually involve both chemical28–33 and physical methods.34 However, these methodologies require templates as directors to control the shape of the resulting nanoparticles.28,30,31,33 One of the most common synthetic routes for obtaining AgNR is the seed-mediated growth method.28,31,35,36 This procedure comprises seed nanoparticles that are added to a growth solution containing cetyltrimethylammonium bromide (CTAB) – a cationic surfactant – and a mild reductant like ascorbic acid. CTAB forms rod-shaped micelles in aqueous solutions that act as soft templates to shape the particles.28,36–38 While most of those syntheses effectively control the shape, dimension, and yield of the particles, removing the surfactants from the surface would entail harsh post-synthesis treatments, thus making applications that demand analyte adsorption on the surface of the nanoparticle an arduous task.
Characterization of nanomaterials is essential to obtain reliable information about effects attributed to the nanoparticle and avoid misleading results. The accurate determination of their concentration is one of the most critical parameters, mainly because nanoparticles (NP) are frequently obtained with a certain degree of polydispersity,39 indeed when it is possible to get highly uniform NP, for example, nanospheres.40,41 A few publications discuss this major challenge in nanoscience, focusing on polydispersity.42,43 However, the calculation of NP concentration in multi-shape samples remains generally underestimated due to overlooking each shape's contribution to the total NP concentration. To overcome this limitation, in this work, we present Multiple Shape Corrector (MultiShapeC), an algorithm to estimate the total concentration of NP more accurately by also considering the NP proportions by morphology and size.
To accomplish this goal, we chose silver nanoparticles as the case study. First, we developed an experimental protocol to obtain multi-shaped AgNP in a controllable manner through a seedless and surfactant-less synthetic methodology. The proposed method consists of a one-pot, two-sequential step process. The first step, occurring at lower temperatures, leads to the in situ formation of the silver nanospheres nuclei that then grow as rod-shaped particles during a second step at higher temperatures due to the addition of a strictly controlled amount of sodium hydroxide. Once the nanoparticles were characterized, we used MultiShapeC to calculate the total NP concentration. Finally, as a case study, we compared the impact of the AgNP concentration calculation (MultiShapeC vs. the average size method) on the determination of Stern–Volmer constants.
Experimental
Instrumentation
Absorption spectra were obtained using quartz cells (1 cm path-length) in a UV-vis Shimadzu 1800 spectrophotometer working in the (200–800) nm wavelength range. The pH was controlled using an Orion (Boston, MA, USA) model 720A pH-meter with a Ross combination pH electrode. Previously, the pH meter was calibrated with standard buffers at pH = 4.008, 6.994, and 9.136. An Eppendorf Centrifuge 5804 was employed for centrifugation, and a TEM-Jeol 1120 electron microscope, 80 kV accelerating voltage, was used for obtaining Transmission Electron Microscopy (TEM) images. Fluorescence measurements were done using a Cary Eclipse fluorescence spectrophotometer (Agilent) with a Peltier temperature controller set at 25.0 °C. Data analysis was performed using Origin 8.0®.Materials and methods
Silver nitrate ≥99% (Biopack), sodium borohydride (Tetrahedron), trisodium citrate (Anedra), sodium hydroxide (Cicarelli), sodium acetate (Anedra), acetic acid (Cicarelli), 3,3′,5,5′-tetramethylbenzidine ≥99% (TMB, Aldrich) and carbazole (CZL, Sigma) were all analytical grade and used as received. All experiments were conducted in water, Milli-Q quality (resistivity, 25 °C: 18.2 MΩ cm).![[thin space (1/6-em)]](https://www.rsc.org/images/entities/char_2009.gif) 585 rcf for 30 min, 20 min, and 15 min, respectively, followed by redispersion in deionized water and stored at 4 °C for further use.
585 rcf for 30 min, 20 min, and 15 min, respectively, followed by redispersion in deionized water and stored at 4 °C for further use.MultiShapeC algorithm for concentration calculation in multi-shaped nanoparticle samples
Based on the work by Lazurko et al.,42 a modified algorithm is proposed for the estimation of nanoparticle concentration in polydisperse and multi-shaped systems. For example, in a colloidal dispersion of spherical nanoparticles (NS), the total concentration of any given NP system ([NS]) satisfies the equation| [NS]∫F(s)g(s)ds = [S] | (1) |
| [NS]∫F(s)g(s)ds + [NR]∫∫M(a,b)L(a,b)dadb | (2) |
Then, using the Riemann sum and the Trapezoidal rule to approximate the integrals, we obtain the equation
 | (3) |
The number of precursor atoms in any nanoparticle of specific dimensions, F(s) and M(a,b), can be calculated using the volume of the particles and atoms according to the equation,
 | (4) |
 | (5) |
The MultiShapeC algorithm has been incorporated in a fillable spreadsheet for gold and silver nanospheres and nanorods, available as additional material (see the ESI† for the tutorial on how to use it).
In order to evaluate the impact of using MultiShapeC vs. the average size method for the NP concentration calculation, we studied the interaction between AgNP and carbazole by fluorescence quenching.40 Different aliquots of AgNR–AgNS (0–1.35 nM) were mixed with a fixed concentration of carbazole (100 nM), and the fluorescence emission spectra of the mixtures were recorded between 350 nm and 600 nm. Fluorescence intensities were corrected as in our previous work by considering inner filter effects.40
Results and discussion
Synthesis and characterization of silver nanoparticles
Spheres and rods AgNP were synthesized using a one-pot and sequential two reductants methodology inspired by Caswell et al.46 and Agnihotri et al.47 Initially, sodium borohydride reduced Ag+ at 60 °C, followed by a second reduction step at 90 °C mainly due to sodium citrate which also plays an essential role as the stabilizing agent. During the first reduction, the mixture of reactants became deep yellow as AgNS formed. Then, after adding sodium hydroxide (pH > 11) and increasing the temperature, the solution took a green-grayish appearance, as shown in Fig. 1. In this second step, the previously formed Ag0 nuclei act as seeds for the growth of nanorods resulting from the reduction of Ag+ excess by the citrate anion at high temperatures.46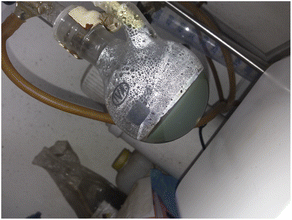 | ||
| Fig. 1 Picture showing the appearance of the reaction crude after the addition of NaOH, and temperature increase to 90 °C. | ||
After the centrifugation process, the resuspended pellet presented a green color, attributed to the presence of AgNR, while the supernatant remained yellow due to the presence of nanospheres. The UV-vis spectrum presented the two bands corresponding to the transversal (higher energy absorption) and longitudinal (lower energy absorption) surface plasmons resonance (SPR) modes, characteristic of AgNR (Fig. 2).24,25
Factors like reactant's molar ratio, pH, time, and temperature were screened to find the optimal conditions for synthesizing the bi-shaped samples of AgNP. Temperature over 95 °C, hydroxide concentration higher than 0.1 M, and citrate near 8 mM, all lead to a precipitate on the flask walls, attributed to the high activity of citrate as a reductant under these conditions.48
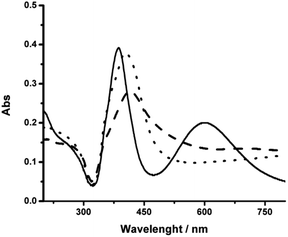
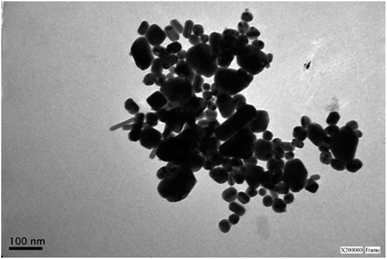
Then, the formation of AgNR was evaluated at different NaOH concentrations, maintaining all other experimental conditions constant. Fig. 2 shows the UV-vis spectra of silver particles formed using NaOH concentration from 1 mM to 3 mM. Above 3 mM, irreversible particle flocculation was always observed. Remarkably, at 1.8 mM NaOH (pH ∼ 11.25), the colloidal dispersion presented two extinction bands at 387 nm and 602 nm, respectively (Fig. 2), in agreement with the expected transversal and longitudinal SPR for AgNR.35,49 The presence of NR was confirmed by TEM (Fig. 3). When the hydroxide concentration was 1 mM or 3 mM, no longitudinal SPR appeared, and much of the extinction above 500 nm was ascribed to light scattering from large nanoparticle agglomerates. These results indicated that rod particle formation was highly dependent on the concentration of hydroxide anions during the growth step produced in the second reduction by citrate.
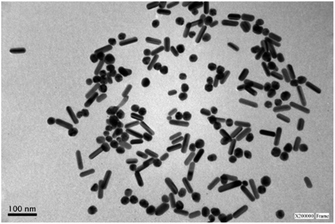 | ||
| Fig. 3 Representative TEM image of a sample of silver nanoparticles after centrifugation showing the presence of rods and spheres. See Fig. S3† for size distribution histograms. | ||
The reaction yield was determined using the spectrophotometric method for the in situ quantification of unreacted Ag+ in the presence of AgNP.44 Thus, using the method of standard additions (MOSA), we found that the amount of unreacted Ag+ before centrifugation was below the detection limit (3.5 μM), which means with a 95% confidence level that at least 99.7% of Ag+ was reduced to silver particles (see ESI†).
Fig. 3 shows a representative TEM image (after centrifugation) of AgNR obtained using 1.8 mM NaOH. The rod-shaped particles had an average length of 54 nm (standard deviation, sd = 9 nm) and an average width of 18 nm (sd = 2 nm). Also, nanospheres are observed. These AgNS presented an average diameter of 26 nm (sd = 3 nm), close to the nanorods' width (see Fig. S3† in the ESI for size distribution histograms). As the position of the plasmon resonance bands is related to the particle dimensions, the nanospheres absorption band appeared in the same region as the transversal surface plasmon band of the rods. Therefore, the spectra for each type of nanoparticle were overlapped in the 300–450 nm region. The UV-vis spectra displayed a higher absorbance at 387 nm than the band at 603 nm because of the simultaneous interaction of rods and spheres with light. While different approaches were applied to achieve better separation of spherical and rod-shaped nanoparticles after the synthetic procedure (step centrifugation, gravity precipitation), the significant similarity in sizes of both types of particles made the process only partially successful. The best results led to obtaining 47% of spheres and 53% of rods.
Generally, the particle morphology can be explained by the selective ion adsorption like chloride and bromide on facets during the crystal growth.50,51 In our case, in a similar fashion, as reported in the synthesis of silver nanowires,46,52 citrate and hydroxide anions are also likely to act as shape directors to obtain the nanorods. For example, under similar experimental conditions, Murph et al.52 found that silver nuclei turned into nanowires due to the oriented coupling phenomena.53
Although our results do not discriminate the mechanism for rod formation, the synthetic methodology is reproducible.
The stability of the mixture of nanoparticles was determined by following the UV-vis spectral changes for 90 days since the colloidal solution was prepared and stored. The absorption spectra observed in Fig. 4 show no changes at 30 days compared with the initial time, indicating the nanoparticles have not undergone any significant morphological or aggregation changes during a month. However, as the aging time increased (more than two months), the colloidal particles began settling at the vessels' bottom. They turned in green brownish, indicating particle aggregation and reshaping of the silver nanorods to quasi-spherical particles, attributed mainly to Ostwald ripening. The formation of large aggregates was corroborated by TEM observing particles larger than 100 nm in size (Fig. 5) and by the increased scattering above 700 nm and depleting the absorption around 400 nm observed in the UV-vis spectrum (Fig. 4).
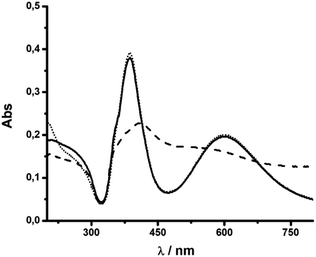 | ||
| Fig. 4 Stability of an AgNR sample followed by UV-visible spectroscopy at different times in days: 0 (…), 30 (—) and 90 (---). | ||
Estimation of nanoparticle concentration in a multi-shape and polydisperse sample
So far, the concentration of nanoparticles in polydisperse systems can be calculated when only spherical particles are present.42 When introducing a new morphology that presents a two-dimensional size distribution, as nanorods, it is necessary to adapt these models to calculate the volume of each particle and the probability of finding a particle of specific dimensions between all the NP. In that sense, we propose the MultiShapeC algorithm (eqn (3)) to estimate the concentration of nanoparticles in a colloidal system independently of shape and size distributions, even in mixtures, using TEM data. Table 1 shows a comparison between nanoparticle concentrations obtained using the MultiShapeC algorithm, which considers the mixture of spheres and rod particles with their corresponding polydispersity, and a method that only considers the average size of the particles.| Method | |||
|---|---|---|---|
| Average sizea | MultiShapeCb | ||
| a Using [NP] = [S]/N; [S] is the Ag+ concentration and N is the ratio volume NP/volume Ag atom. In parenthesis, the error was estimated assuming the standard deviation from the mean of nanoparticle size to be proportional to the concentration.b Using eqn (3). The error (in parenthesis) was estimated using error propagation. | |||
| Nanosilver concentration (nM) | Mixture | 8.5 (1.1) | 0.370 (0.004) |
| Rods | 4.5 (0.6) | 0.196 (0.002) | |
| Spheres | 4.0 (0.5) | 0.174 (0.002) | |
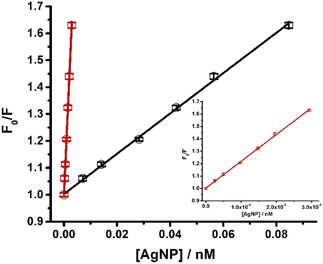
The quenching of the carbazole fluorescence emission by silver nanoparticles illustrates how the calculation of nanoparticle concentration in solution affects the study of the interaction between nanostructures and molecules (Fig. 6). This quenching responded to the Stern–Volmer equation.
 | (6) |
Conclusions
In summary, we developed an algorithm, MultiShapeC, to calculate the concentration of polymorphic and polydisperse nanoparticle samples using TEM data. MultiShapeC was validated using silver particles containing rods and spheres as a case study. In addition, a seedless, surfactant-less, one-pot synthetic method was developed to produce samples containing nanorods (aspect ratio: 3) and nanospheres at a reproducible 1![[thin space (1/6-em)]](https://www.rsc.org/images/entities/char_2009.gif) :
:![[thin space (1/6-em)]](https://www.rsc.org/images/entities/char_2009.gif) 1 proportion. Then, the impact of the nanoparticle concentration calculation on the determination of parameters like the Stern–Volmer constant was demonstrated. MultiShapeC renders a more realistic estimation of the actual colloidal nanoparticle concentrations, improving the determination of concentration-dependent parameters.
1 proportion. Then, the impact of the nanoparticle concentration calculation on the determination of parameters like the Stern–Volmer constant was demonstrated. MultiShapeC renders a more realistic estimation of the actual colloidal nanoparticle concentrations, improving the determination of concentration-dependent parameters.
Conflicts of interest
The authors declare that they do not have any conflicts of interest that could have influenced the outcomes of this work.Acknowledgements
This research was supported in part by grants from the ANPCyT (PICT 2013-1989), the SECYT-UNC (Res. 266/16, 113/17 and 411/18, and the CONICET PIP 2017-2019 11220170100505CO. R. N. N. is a grateful recipient of graduated fellowship from CONICET. A. V. V. and N. L. P. are research members of the CONICET, Argentina.References
- L. Zhang, R. Huang, W. Liu, H. Liu, X. Zhou and D. Xing, Biosens. Bioelectron., 2016, 86, 1–7 CrossRef CAS PubMed.
- C. Ray and T. Pal, J. Mater. Chem. A, 2017, 5, 9465–9487 RSC.
- A. Elhage, A. E. Lanterna and J. C. Scaiano, Chem. Sci., 2019, 10, 1419–1425 RSC.
- T.-Y. Liang, H.-H. Chen and D.-H. Tsai, Fuel Process. Technol., 2020, 201, 106335 CrossRef CAS.
- E. Alarcon, K. Udekwu, M. Skog, N. Pacioni, K. Stamplecoskie, M. González-Béjar, N. Polisetti, A. Wickham, A. Richter-Dahlfors, M. Griffith and J. Scaiano, Biomaterials, 2012, 33, 4947–4956 CrossRef CAS PubMed.
- T. h. I. Shaheen, M. E. El-Naggar, J. S. Hussein, M. El-Bana, E. Emara, Z. El-Khayat, M. M. G. Fouda, H. Ebaid and A. Hebeish, Biomed. Pharmacother., 2016, 83, 865–875 CrossRef CAS.
- M. J. Rupar, P. Golusinski, W. Golusinski and M. M. Masternak, Rep. Pract. Oncol. Radiother., 2019, 24, 544–550 CrossRef PubMed.
- L. Chen and J. Liang, Mater. Sci. Eng. C, 2020, 112, 110924 CrossRef CAS.
- E. I. Alarcon and M. Ahumada, Nanoengineering Materials for Biomedical Uses, Springer International Publishing, Switzerland, 2019 Search PubMed.
- J. Fraire, V. Sueldo Ocello, L. Allende, A. Veglia and E. Coronado, J. Phys. Chem. C, 2015, 119, 8876–8888 CrossRef CAS.
- G. G. Carbone, A. Serra, A. Buccolieri and D. Manno, Heliyon, 2019, 5, e02887 CrossRef PubMed.
- W. Yang, Y. Zhang, Y. Zhang, W. Deng and X. Fang, Adv. Funct. Mater., 2019, 29, 1905923 CrossRef CAS.
- M. Dolci, J.-F. Bryche, J. Moreau, C. Leuvrey, S. Begin-Colin, G. Barbillon and B. P. Pichon, Appl. Surf. Sci., 2020, 527, 146773 CrossRef CAS.
- M. Baghayeri, M. Nodehi, A. Amiri, N. Amirzadeh, R. Behazin and M. Z. Iqbal, Anal. Chim. Acta, 2020, 1111, 49–59 CrossRef CAS PubMed.
- T. Yan, Z. Li, F. Cao, J. Chen, L. Wu and X. Fang, Adv. Mater., 2022, 34, 2201303 CrossRef CAS.
- M. Rashad, A. A. A. Darwish and S. E. AlGarni, J. Magn. Magn. Mater., 2019, 491, 165577 CrossRef CAS.
- Y. Zou, Z. Guo, L. Ye, Y. Cui, X. Wang, L. Zhao and K. Yu, J. Alloys Compd., 2019, 803, 527–537 CrossRef CAS.
- A. I. Titkov, O. A. Logutenko, A. M. Vorobyev, T. A. Borisenko, N. V. Bulina, A. S. Ulihin, S. G. Baev, V. P. Bessmeltsev and N. Z. Lyakhov, Mater. Today, 2020, 25, 447–450 CAS.
- L. Li, Y. Hao, J. Guo, Y. Wang and L. Yu, Chem. Phys. Lett., 2018, 711, 178–183 CrossRef CAS.
- S. Pagidi, R. Manda, S. S. Bhattacharyya, K. J. Cho, T. H. Kim, Y. J. Lim and S. H. Lee, Composites, Part B, 2019, 164, 675–682 CrossRef CAS.
- L. Zhang, Y. Tang and L. Tong, iScience, 2020, 23, 100810 CrossRef PubMed.
- T. Yan, S. Cai, Z. Hu, Z. Li and X. Fang, J. Phys. Chem. Lett., 2021, 12, 9912–9918 CrossRef CAS PubMed.
- Y. Chen, L. Su, M. Jiang and X. Fang, J. Mater. Sci. Technol., 2022, 105, 259–265 CrossRef.
- S. Link and M. El-Sayed, J. Phys. Chem. B, 1999, 103, 8410–8426 CrossRef CAS.
- C. J. Murphy, A. M. Gole, S. E. Hunyadi and C. J. Orendorff, Inorg. Chem., 2006, 45, 7544–7554 CrossRef CAS PubMed.
- D. Shajari, A. Bahari, P. Gill and M. Mohseni, Opt. Mater., 2017, 64, 376–383 CrossRef CAS.
- H. Xu, C. Kan, C. Miao, C. Wang, J. Wei, Y. Ni, B. Lu and D. Shi, Photonics Res., 2017, 5, 27 CrossRef CAS.
- N. R. Jana, L. Gearheart and C. J. Murphy, Chem. Commun., 2001, 617–618 RSC.
- B. Pietrobon, M. McEachran and V. Kitaev, ACS Nano, 2009, 3, 21–26 CrossRef CAS PubMed.
- R. Dong, W. Tsai and J. Lin, Eur. Polym. J., 2011, 47, 1383–1389 CrossRef CAS.
- S. Bhattacharya and J. Biswas, Nanoscale, 2011, 3, 2924 RSC.
- J. Patarroyo, A. Genç, J. Arbiol, N. G. Bastús and V. Puntes, Chem. Commun., 2016, 52, 10960–10963 RSC.
- X. Zhuo, X. Zhu, Q. Li, Z. Yang and J. Wang, ACS Nano, 2015, 9, 7523–7535 CrossRef CAS.
- M. Šubr, M. Petr, V. Peksa, O. Kylián, J. Hanuš and M. Procházka, J. Nanomater., 2015, 2015, 729231 Search PubMed.
- J. Zhang, M. Langille and C. Mirkin, Nano Lett., 2011, 11, 2495–2498 CrossRef CAS PubMed.
- C. R. Rekha, V. U. Nayar and K. G. Gopchandran, J. Sci.: Adv. Mater. Devices, 2018, 3, 196–205 Search PubMed.
- W. Zhang, G. Hu, W. Zhang, X. Qiao, K. Wu, Q. Chen and Y. Cai, Phys. E, 2014, 64, 211–217 CrossRef CAS.
- W. Zhang, X. Qiao, Q. Chen, Y. Cai and H. Chen, Appl. Surf. Sci., 2012, 258, 5909–5913 CrossRef CAS.
- N. L. Pacioni, in Handbook of Ecomaterials, ed. L. M. T. Martínez, O. V. Kharissova and B. I. Kharisov, Springer International Publishing, Cham, 2019, pp. 2327–2342 Search PubMed.
- R. Núñez, A. Veglia and N. Pacioni, Michochem. J., 2018, 141, 110–117 CrossRef.
- M. A. Molina Torres, E. M. Pachón Gómez, M. A. Fernández, A. V. Veglia and N. L. Pacioni, J. Mol. Liq., 2019, 284, 110–116 CrossRef CAS.
- C. Lazurko, M. Ahumada, F. Valenzuela-Henríquez and E. I. Alarcon, Nanoscale, 2018, 10, 3166–3170 RSC.
- K. Goel, M. Zuñiga-Bustos, C. Lazurko, E. Jacques, C. Galaz-Araya, F. Valenzuela-Henriquez, N. L. Pacioni, J.-F. Couture, H. Poblete and E. I. Alarcon, ACS Appl. Mater. Interfaces, 2019, 11, 17697–17705 CrossRef CAS.
- R. Gonzalez-Fuenzalida, Y. Moliner-Martinez, M. Gonzalez-Bejar, C. Molins-Legua, J. Verdu-Andres, J. Perez-Prieto and P. Campins-Falco, Anal. Chem., 2013, 85, 10013–10016 CrossRef CAS PubMed.
- M. Ahumada, E. Lissi, A. M. Montagut, F. Valenzuela-Henríquez, N. L. Pacioni and E. I. Alarcón, Analyst, 2017, 142, 2067–2089 RSC.
- K. Caswell, C. Bender and C. Murphy, Nano Lett., 2003, 3, 667–669 CrossRef CAS.
- S. Agnihotri, S. Mukherji and S. Mukherji, RSC Adv., 2014, 4, 3974–3983 RSC.
- X. Dong, X. Ji, H. Wu, L. Zhao, J. Li and W. Yang, J. Phys. Chem. C, 2009, 113, 6573–6576 CrossRef CAS.
- K. Stamplecoskie and J. Scaiano, J. Am. Chem. Soc., 2010, 132, 1825–1827 CrossRef CAS PubMed.
- M. Pileni, Nat. Mater., 2003, 2, 145–150 CrossRef CAS.
- A. Filankembo, S. Giorgio, I. Lisiecki and M. Pileni, J. Phys. Chem. B, 2003, 107, 7492–7500 CrossRef CAS.
- S. E. H. Murph, C. J. Murphy, A. Leach and K. Gall, Cryst. Growth Des., 2015, 15, 1968–1974 CrossRef.
- R. L. Penn and J. F. Banfield, Am. Mineral., 1998, 1077–1082 CrossRef CAS.
Footnote |
| † Electronic supplementary information (ESI) available: Quantification of unreacted Ag+, size distribution histograms, and tutorial for using MultiShapeC. A fillable spreadsheet is also included as part of the ESI.See https://doi.org/10.1039/d2ra04078f |
| This journal is © The Royal Society of Chemistry 2022 |

