 Open Access Article
Synthesis of polyaspartic acid-capped 2-aminoethylamino acid as a green water treatment agent and study of its inhibition performance and mechanism for calcium scales†
Yong-Hong Caia,
Jia-Li Zhaoa,
Xin-Yu Guoab,
Xiao-Juan Zhanga,
Ran-Ran Zhanga,
Shao-Rong Maa,
Ya-Min Cheng *a,
Zhong-Yan Cao
 *a and
Ying Xu
 *abc
*abc
aCollege of Chemistry and Chemical Engineering, Henan University, Kaifeng 475004, China. E-mail: chengyamin@henu.edu.cn; zycao@henu.edu.cn; hdccxu@126.com
bEngineering Research Center for Water Environment and Health of Henan, Zhengzhou University of Industrial Technology, Zhengzhou 451150, China
cCentral Philippine University, Iloilo 5003, Philippines
First published on 30th August 2022
Abstract
Polyaspartic acid (PASP), a well-known green scale inhibitor for industrial water treatment, might be decomposed with prolonged duration, and its anti-scaling performance against CaCO3 and CaSO4 is diminished at a low concentration (<10 mg L−1) and a high temperature. With semi-ethylenediaminetetraacetic acid (EDTA) tetrasodium salt as the mimicking model, novel phosphorus-free PASP-capped 2-aminoethylamino acid (PASP–ED2A) containing side chains bearing multi-functional groups is rationally designed and successfully prepared via the ring-opening reaction of cheap poly(succinimide) under mild reaction conditions with the assistance of readily available 2-aminoethyl amino acid. The static scale inhibition method is used to evaluate the scale inhibition performance of the as-synthesized PASP derivative. Scanning electron microscopy, X-ray diffraction, and X-ray photoelectron spectroscopy are utilized to monitor the crystallization process of calcium carbonate and calcium sulfate scales, and density functional theory calculations are conducted to shed light on the relationship between the molecular structure and scale inhibition mechanism of PASP–ED2A. Results show that the as-prepared PASP–ED2A shows better scale inhibition performance for CaCO3 and CaSO4 than PASP with a low concentration, a high temperature, and an extended duration. Particularly, PASP–ED2A with a concentration of 10 mg L−1 exhibits the best scale inhibition performance for CaCO3; its scale inhibition capacity is about two times as much as that of PASP. The reason lies in that the coordination atoms in the molecular structure of PASP–ED2A can chelate with Ca2+ to inhibit the combination of Ca2+ with anions and prevent the generation of CaCO3 and CaSO4 scales. The PASP–ED2A derivative can more efficiently retard the formation and growth of CaCO3 and CaSO4 crystal nuclei and exerts better inhibition performance against CaCO3 and CaSO4 scales than PASP.
1. Introduction
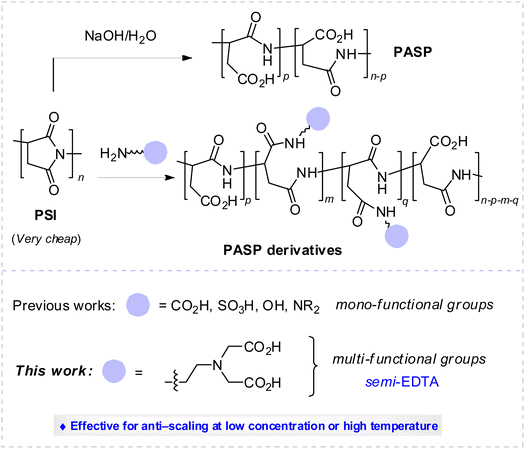
With the rapid development of industry and the increase of water consumption,1 water recycling has become an important means to save water resources. Reports demonstrate that industrially circulated cooling water accounts for 70–90% of the total industrial water consumption.2 However, the repeatedly used cooling water often contains increased contents of calcium and magnesium ions and is hence liable to scaling.3,4 This will not only cause the clogging and corrosion of heat exchange and production equipment but also reduce the heat transfer rate of the equipment, thereby adding to the production cost.5–9 Therefore, some researchers developed several techniques for inhibiting or remediating the scale formation and found that scale inhibitors could be of special significance in this respect.10–13 Among various scale inhibitors, polyaspartic acid (PASP) could be the most promising one, since it is cheap, non-toxic, phosphorous-free and biodegradable.14–18 Nevertheless, it exhibits relatively poor scale inhibition performance at a low concentration or high temperature over a prolonged duration, which limits its practical application in industry.19 In this sense, it is imperative to design and synthesize phosphorus-free PASP derivatives with desired antiscale performance under mild reaction condition. Two major strategies are currently available for that purpose. One is the copolymerization of L-aspartic acid, and another is the amino ring-opening modification of polysuccinimide (PSI). Both strategies afford functionalized PASP with improved antiscaling efficiency, thanks to the introduction of the side chains bearing functional groups (e.g., sulfonic (–SO3H), carboxylic (–CO2H), hydroxyl (–OH), and amino (–NR2)) that can be coordinated with Ca2+ (Scheme 1).20–22In practice, however, high concentrations of PASP derivatives are often necessary in order to achieve a satisfactory scale inhibition effect. Viewing that polymers with high chelation ability with Ca2+ might contribute to enhancing the anti-scaling performance, we envision the selective installation of side chains bearing polydentate coordination groups (carboxylic, amino, acylamido, etc.) might provide a new solution to further improve the scale inhibition performance. Since ethylenediaminetetraacetic acid (EDTA) tetrasodium salt is a very good chelating agent widely used for the quantitative detection of Ca2+, we anticipate that the installation of semi-EDTA to the side chain of the PASP derivative could provide novel antiscaling agents with greatly improved antiscale performance. With our continuing interest in this area, in the present research we prepare a PASP derivative bearing side chain containing multi-functional group (phosphorus-free PASP-capped 2-aminoethyl amino acid (denoted as PASP–ED2A)) by mimicking semi-EDTA under mild reaction condition (Scheme 1). This paper evaluates the scale inhibition performance of the as-synthesized PASP derivative by static scale inhibition method and observes the crystallization process of calcium scale by means of scanning electron microscopy, X-ray diffraction, and X-ray photoelectron spectroscopy. Besides, it aims at shedding light on the plausible scale inhibition mechanism of the PASP derivative based on density functional theory (DFT) calculations.
2. Materials and methods
2.1 Materials
Analytical reagents (AR) bromoacetic acid and ethylenediamine as well as industrial grade PSI (Mw = 7000) were provided by Shanghai Aladdin Biochemical Technology Company Limited (Shanghai, China). N-Acetylethylenediamine was purchased from Shanghai Shaoyuan Regent Company Limited (Shanghai, China). Anhydrous sodium sulfate (AR), ethylenediaminetetraacetic acid disodium salt (AR), anhydrous calcium chloride (AR), borax (AR) and potassium hydroxide (AR) were provided by Tianjin Kermel Chemical Reagent Company Limited (Tianjin China). Anhydrous sodium bicarbonate (AR) was purchased from Tianjin Deen Chemical Regent Company Limited (Tianjin, China). Anhydrous ethanol (AR) was obtained from Anhui Ante Food Company Limited (Suzhou, China). Deionized water (DI) prepared at our laboratory was used as the solvent and for rinsing as well.2.2 Synthesis of 2,2′-((2-aminoethyl)azanediyl)diacetic acid–polyaspartic acid (PASP–ED2A)
Certain amounts of N-acetylenediamine, bromoacetic acid and distilled water were placed in a 50 mL round bottom flask while a proper amount of sodium hydroxide solution (8 mol L−1) was dropwise added. The resultant solution was held at ambient condition for 3 days, followed by the addition of a proper amount of sodium hydroxide solution (5 mol L−1) and further reaction for additional 3 days. Upon completion of reaction, hydrochloric acid (5 mol L−1) was added to adjust the solution pH to about 8 thereby affording ED2A (Fig. 1).23Certain amounts of the aqueous solutions of PSI, ED2A and sodium hydroxide were placed in a 50 mL round bottom flask and stirred at 60 °C for 24 h in a water bath. At the end of reaction, the solution was poured in anhydrous ethanol to allow sedimentation, followed by holding at ambient condition as well as filtration and drying of the lower precipitate to obtain the crude product. The crude product was purified with a dialysis bag and then steamed to obtain a yellow solid, the target product PASP–ED2A with 53% yield (Fig. 2). Noteworthy, although seven days and extra industrial raw chemical reagents (such as ethylenediamine and bromoacetic acid) was needed to synthesis PASP–ED2A than that of PASP, the safe and easy-to-handle nature, as well as its better antiscaling performance makes it worth to do.
2.3 Characterization of PASP and PASP–ED2A
The structure of PASP and PASP–ED2A was characterized by Fourier transform infrared spectroscopy (VERTEX 70 FTIR spectrometer, Bruker Optics, Germany) and 1H nuclear magnetic resonance spectroscopy (1H NMR; AVANCE 400 MHz NMR spectrometer, Bruker Optics, Germany).2.4 Static scale inhibition tests
 | (1) |
 | (2) |
2.5 Surface analysis of scale crystal
A field emission scanning electron microscope (SEM, JSM-7610F, Japan Electronics Corporation) was used to observe the morphology of the scales. An X-ray powder diffractometer (XRD, D8 Advance, Bruker, Germany) was used to analyze the crystalline change of CaCO3 scale and CaSO4 scale. An X-ray photoelectron spectroscope (XPS, Thermo Scientific K-Alpha+, USA) was performed to explore the scale inhibition mechanism of PASP–ED2A derivative.2.6 Monitoring crystallization process of calcium scale
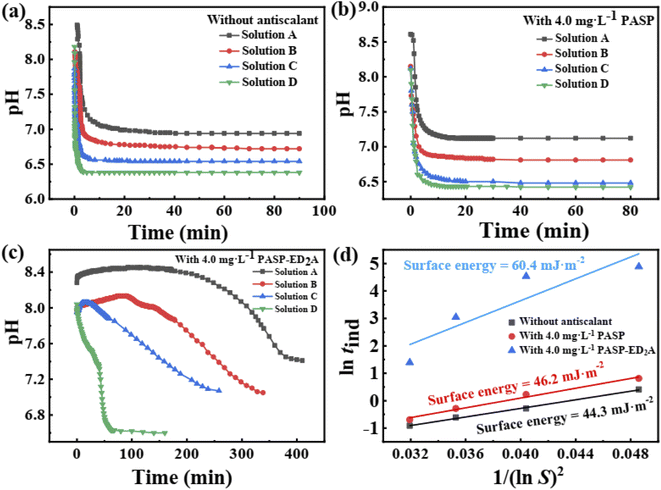
The pH curve of CaCO3 solution can reflect the scale inhibition performance of PASP–ED2A derivative to a certain extent.24 Prior to the experiments, CaCl2 solution and NaHCO3 solution of an equal concentration were prepared. The as-obtained CaCl2 solution and NaHCO3 solution were then mixed at pre-set volume fractions to afford the to-be-tested CaCO3 solutions with concentrations of 0.015, 0.020, 0.025, and 0.030 mol L−1 (denoted as solutions A, B, C, and D). Before the CaCl2 solution and NaHCO3 solution were mixed, their pH was adjusted to 8.9 with NaOH solution while the scale inhibitor was added to the NaHCO3 solution in advance. The mixed solution was stirred at (25.0 ± 0.1) °C and its pH was recorded at pre-set time intervals. The time when the pH started to drop sharply is recorded as tind. According to the theory of classic homogeneous nucleation, the relationship between tind and ln![[thin space (1/6-em)]](https://www.rsc.org/images/entities/char_2009.gif) S can be obtained from eqn (3):25,26
S can be obtained from eqn (3):25,26
 | (3) |
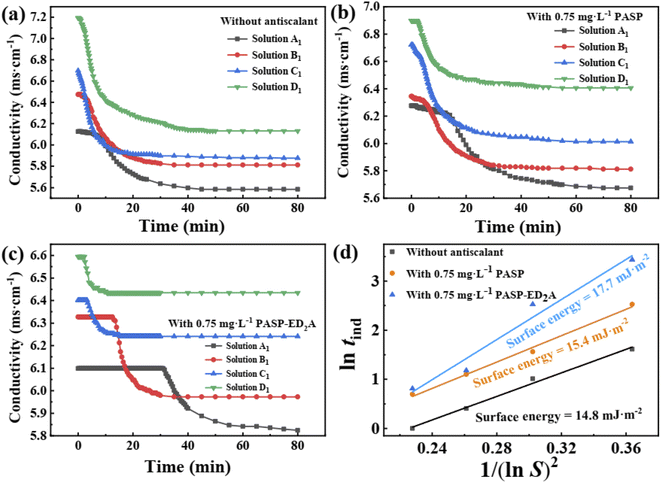
Similarly, the conductivity test of CaSO4 solution can reflect the performance of the scale inhibitor to a certain extent. In this case, CaCl2 solution and Na2SO4 solution with the same concentration were prepared in advance; and they were then mixed at pre-set volume fractions to obtain CaSO4 solutions with concentrations of 0.07, 0.08, 0.09, and 0.10 mol L−1 (denoted as solutions A1, B1, C1, and D1). Before the CaCl2 solution and Na2SO4 solution were mixed, their pH was adjusted to 8.9 with NaOH solution while the scale inhibitor was added to the Na2SO4 solution in advance. The mixed solution was stirred at (25.0 ± 0.1) °C, and its conductivity was recorded at pre-set time intervals. The time when the conductivity started to drop sharply is recorded as tind. According to the theory of classic homogeneous nucleation, the relationship between tind and ln![[thin space (1/6-em)]](https://www.rsc.org/images/entities/char_2009.gif) S can also be expressed by eqn (3).26,27
S can also be expressed by eqn (3).26,27
For the pH test of calcium carbonate, the supersaturation ratio (S) of the four tested solutions is 93.325, 144.544, 204.174, and 269.153, respectively, based on the calculation from Yang.29 For the conductivity test of calcium sulfate, the supersaturation ratio (S) of the four tested solutions is 5.248, 6.166, 7.079, and 8.128.
3. Results and discussion
3.1 Structural characterization of PASP and PASP–ED2A
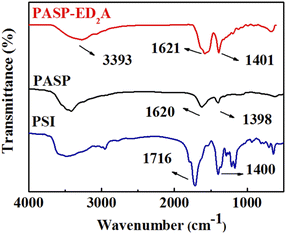
As shown in Fig. 3, the symmetric stretching vibration peaks of C–N bond and C![[double bond, length as m-dash]](https://www.rsc.org/images/entities/char_e001.gif) O bond in PSI are at 1400 cm−1 and 1716 cm−1, respectively. PASP–ED2A shows the stretching vibration peaks of N–H, C
O bond in PSI are at 1400 cm−1 and 1716 cm−1, respectively. PASP–ED2A shows the stretching vibration peaks of N–H, C![[double bond, length as m-dash]](https://www.rsc.org/images/entities/char_e001.gif) O and C–N in the amide bond at 3393 cm−1, 1621 cm−1 and 1401 cm−1. Noticeably, the dramatic change of vibration peak of carbonyl group from 1716 cm−1 to 1621 cm−1 (with broad signal) can be attributed to the fact that the formation of extra amide bond via ring-opening aminolysis. This is very similar to PASP (with two dramatic peaks at 1620 and 1398 cm−1), indicating that PSI reacts with ED2A to generate PASP–ED2A.
O and C–N in the amide bond at 3393 cm−1, 1621 cm−1 and 1401 cm−1. Noticeably, the dramatic change of vibration peak of carbonyl group from 1716 cm−1 to 1621 cm−1 (with broad signal) can be attributed to the fact that the formation of extra amide bond via ring-opening aminolysis. This is very similar to PASP (with two dramatic peaks at 1620 and 1398 cm−1), indicating that PSI reacts with ED2A to generate PASP–ED2A.
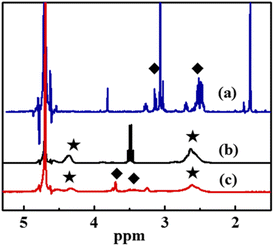
Fig. 4 shows the 1H NMR spectra of ED2A, PASP and PASP–ED2A in D2O. The two absorbance peaks of –CH2– in ED2A with an integration rate of 1![[thin space (1/6-em)]](https://www.rsc.org/images/entities/char_2009.gif) :
:![[thin space (1/6-em)]](https://www.rsc.org/images/entities/char_2009.gif) 1 appear at 2.50 ppm and 3.10 ppm (Fig. 4(a)), which indicates that ED2A is successfully synthesized. As depicted in Fig. 4(b), the broad peaks of –CH– and –CH2– of PASP molecular chain emerge at 2.60 ppm and 4.30 ppm (with an integration ratio of 2
1 appear at 2.50 ppm and 3.10 ppm (Fig. 4(a)), which indicates that ED2A is successfully synthesized. As depicted in Fig. 4(b), the broad peaks of –CH– and –CH2– of PASP molecular chain emerge at 2.60 ppm and 4.30 ppm (with an integration ratio of 2![[thin space (1/6-em)]](https://www.rsc.org/images/entities/char_2009.gif) :
:![[thin space (1/6-em)]](https://www.rsc.org/images/entities/char_2009.gif) 1), respectively. Besides, aside from the –CH– and –CH2– peaks of PASP, the as-synthesized PASP–ED2A shows the peaks of –CH2– in ED2A at 3.50 ppm and 3.80 ppm (Fig. 4(c)). These data can further confirm the successful synthesis of PASP–ED2A derivative.
1), respectively. Besides, aside from the –CH– and –CH2– peaks of PASP, the as-synthesized PASP–ED2A shows the peaks of –CH2– in ED2A at 3.50 ppm and 3.80 ppm (Fig. 4(c)). These data can further confirm the successful synthesis of PASP–ED2A derivative.
3.2 Scale inhibition efficiency towards CaCO3 and CaSO4
Fig. 5(a) shows the scale inhibition efficiency–concentration curves of PASP and PASP–ED2A towards CaCO3. In general, the scale inhibition efficiency of both scale inhibitors increases with the increase of their concentration and remains nearly unchanged at a certain concentration, showing an obvious “threshold effect”.30 Particularly, PASP–ED2A exhibits better scale inhibition performance against CaCO3 than PASP, especially at a low concentration of 5 mg L−1. This indicates that the introduction of coordination group-containing species into the side chain of PASP molecule contributes to greatly improving its scale inhibition performance. The reason might lie in that the coordination atoms of PASP–ED2A molecule can chelate with free Ca2+ in water to inhibit its sedimentation therein. | ||
| Fig. 5 Inhibition efficiency of PASP–ED2A and PASP towards CaCO3 scale versus (a) inhibitor concentration, (b) test temperature, and (c) test time. | ||
Since the test temperature has an important influence on the scale inhibition performance of scale inhibitor,5,31,32 the scale inhibition performance of PASP and PASP–ED2A is further evaluated in the test temperature range of 40–80 °C. As can be seen from Fig. 5(b), the scale inhibition efficiency of PASP and PASP–ED2A towards CaCO3 decreases with the increase of temperature; and the scale inhibition efficiency of PASP–ED2A is higher than that of PASP in the whole temperature range. For example, the scale inhibition efficiency of PASP decreases from 75.3% to 49.0% as the test temperature rises from 40 °C to 80 °C. Differing from PASP, the as-synthesized PASP–ED2A maintains a high inhibition efficiency of 100% at 40–50 °C, although the solubility of CaCO3 decreases with increasing temperature. Fig. 5(c) shows the inhibition efficiency–time curves of PASP and PASP–ED2A towards CaCO3 scale. The scale inhibition efficiency of PASP–ED2A decreases slowly with the extension of test time and is generally higher than that of PASP. Besides, PASP–ED2A retains a scale inhibition efficiency of 57.1% after 12 h of scale inhibition test, which indicates that PASP–ED2A has good time adaptability.
Fig. 6 shows the variations of the inhibition efficiency of PASP and PASP–ED2A towards CaSO4 scale with inhibitor concentration as well as test temperature and time. As shown in Fig. 6(a), the scale inhibition efficiency of PASP and PASP–ED2A increases sharply with increasing inhibitor concentration in the range of 1–6 mg L−1. This is because the increase of the inhibitor concentration refers to the increase of the amount of scale inhibition molecules in the solution and to the augmented coordination probability of Ca2+ by the inhibitor.
 | ||
| Fig. 6 Inhibition efficiency of PASP–ED2A and PASP towards CaSO4 scale versus (a) inhibitor concentration, (b) test temperature, and (c) test time. | ||
Fig. 6(b) shows the influence of test temperature on the scale inhibition efficiency. The scale inhibition efficiency of PASP and PASP–ED2A decreases significantly with the increase of temperature, which is because the crystallization rate of CaSO4 scale increases rapidly therewith; and PASP–ED2A exhibits a scale inhibition efficiency of 42.7% even at 90 °C, much higher than that of PASP (only 24.2%).
Fig. 6(c) shows the variation of the inhibition efficiency of PASP–ED2A and PASP against CaSO4 scale with test time. With the extension of time, the scale inhibition efficiency of PASP gradually decreases, and the scale inhibition efficiency of PASP–ED2A still remains at 100% even after 24 h of inhibition test. This indicates that PASP–ED2A has excellent resistance against CaSO4 scale.
3.3 Characterization of CaCO3 and CaSO4 scales
The SEM images of CaCO3 crystals in the absence and presence of the scale inhibitors are shown in Fig. 7. In the absence of the scale inhibitors, the CaCO3 crystal exhibits a very regular cubic structure. After adding PASP, the crystal structure of CaCO3 is destroyed; and its surface morphology becomes irregular while its structure becomes loose in association with the increase of particle size. After the addition of PASP–ED2A, the CaCO3 crystal appears as loose small particles with good access to dispersion. This could be because, on the one hand, the coordination groups in the molecular structure of PASP–ED2A can chelate with Ca2+, thereby inhibiting the production of CaCO3 crystal. On the other hand, PASP–ED2A can be adsorbed on the surface of CaCO3 crystal, thereby inhibiting its regular growth and adding to its looseness. At the same time, the scale inhibitor molecules with negative charge adsorbed on the surface of CaCO3 crystal could contribute to preventing the aggregation of CaCO3 particles, thereby yielding CaCO3 crystal with a reduced size. | ||
| Fig. 7 SEM images of CaCO3: (a) without scale inhibitor, (b) with 30 mg L−1 PASP, and (c) with 30 mg L−1 PASP–ED2A. | ||
Fig. 8 shows the SEM images of CaSO4 scales in the absence and presence of the scale inhibitors. In the absence of the agent, CaSO4 scale crystal presents a typical rectangular and tetragonal structure. After the addition of PASP, the surface of CaSO4 scale crystal becomes smooth. After the addition of PASP–ED2A, CaSO4 scale crystals grow into short rods and the surface becomes very rough. This may be due to the adsorption of PASP–ED2A on the surface of scale crystal, which leads to the change of scale morphology.
 | ||
| Fig. 8 SEM images of CaSO4: (a) without the scale inhibitor, (b) with 4 mg L−1 PASP, and (c) with 4 mg L−1 PASP–ED2A. | ||
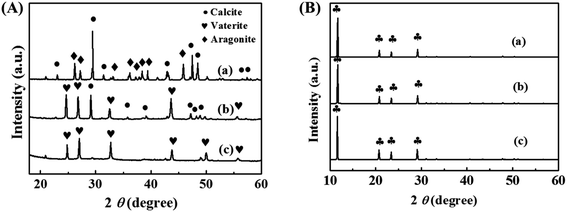
The effect of the scale inhibitor on the crystal structure of CaCO3 and CaSO4 scales is investigated by XRD. Fig. 9(A) shows the XRD patterns of CaCO3 scale without and with the addition of PASP and PASP–ED2A. The CaCO3 scale formed in the absence of the scale inhibitors mainly consists of calcite and aragonite. After the addition of PASP, the characteristic diffraction peaks of vaterite appear, and those of aragonite almost disappear. This indicates that the CaCO3 scale formed in the presence of PASP mainly consists of calcite and vaterite. After the addition of PASP–ED2A, the characteristic diffraction peak of the (110) facet of calcite disappears completely, possibly because the PASP–ED2A molecules adsorbed on the surface of CaCO3 particles via coordination contribute to effectively inhibiting the growth of CaCO3 crystal along the (110) plane.5,33–35 Therefore, the main configuration of calcium carbonate is vaterite after the addition of PASP–ED2A.
Fig. 9(B) shows the XRD patterns of CaSO4 scale after adding PASP and PASP–ED2A. It can be seen that the main crystal type of CaSO4 scale formed without the addition of the scale inhibitors is gypsum (CaSO4·2H2O); and the crystal pattern of CaSO4 scale obtained after the addition of PASP and PASP–ED2A remains unchanged. This, in combination with corresponding SEM analysis, demonstrates that the scale inhibitor PASP–ED2A can change the surface morphology of CaSO4 scale but has no influence on its crystal type.7,33,36,37
Fig. 10 shows the Ca 2p-XPS spectra of CaCO3 scales obtained with and without the addition of the scale inhibitors. The addition of PASP and PASP–ED2A leads to shift of the Ca 2p1/2 and Ca 2p3/2 peaks towards the low binding energy side by 0.18 eV and 0.30 eV, respectively. This indicates that PASP–ED2A can more strongly influence the chemical environment of Ca2+ in CaCO3 scale than PASP, which could be because PASP–ED2A is easier to dwell on the surface of CaCO3 via coordination adsorption.
 | ||
| Fig. 10 XPS spectra of Ca 2p in CaCO3 with different scale inhibitor. (a) Without antiscalant (b) with 30 mg L−1 PASP (c) with 30 mg L−1 PASP–ED2A. | ||
Fig. 11 shows the Ca 2p-XPS spectra of CaSO4 scales obtained with and without the addition of the scale inhibitors. The CaSO4 scale obtained without the addition of the scale inhibitors shows Ca 2p1/2 and Ca 2p3/2 peaks at 351.16 eV and 347.62 eV, respectively. After the addition of PASP and PASP–ED2A, the Ca 2p peaks shift towards high binding energy side by 0.32 eV and 0.44 eV, respectively. Here PASP and PASP–ED2A still can cause changes in the chemical environment of Ca2+ in CaSO4 scale, and PASP–ED2A is superior to PASP in this sense.
 | ||
| Fig. 11 XPS spectra of Ca 2p in CaSO4 with different scale inhibitor. (a) Without antiscalant (b) with 4 mg L−1 PASP (c) with 4 mg L−1 PASP–ED2A. | ||
3.4 Monitoring crystallization process of CaCO3 and CaSO4 scales
Fig. 12 shows the pH–time curves of the CaCO3 solutions without and with the scale inhibitors (4 mg L−1). The pH values of the blank CaCO3 solution and the solution with PASP decrease rapidly in the early stage of inhibition tests and stabilize around a test duration of 5 min (blank CaCO3 solution) or 10 min (CaCO3 solutions with PASP). After the addition of PASP–ED2A, the pH value varies at significantly slowed-down pace and reaches stabilization at greatly extended test duration. Table 1 shows the tind of CaCO3 in the presence of different scale inhibitors. In 0.015 mol L−1 CaCO3 solution, PASP–ED2A can increase the tind to 131.75 min, which indicates that PASP–ED2A is superior to PASP in inhibiting the generation of CaCO3 scale. Besides, the CaCO3 crystals formed in the blank CaCO3 solution and the CaCO3 solutions with PASP or PASP–ED2A exhibit surface energies of 44.3 mJ m−2, 46.2 mJ m−2 and 60.4 mJ m−2, respectively (Fig. 12(d)). This demonstrates that the addition of PASP–ED2A can significantly increase the surface energy of CaCO3 crystal and reduce the nucleation rate of CaCO3 scale, thereby exerting greatly improved scale inhibition performance.| Category | Antiscalant | CaCO3 solutions with different concentration (mol L−1) | |||
|---|---|---|---|---|---|
| 0.015 | 0.020 | 0.025 | 0.030 | ||
| tind (min) | Blank | 1.50 | 0.75 | 0.54 | 0.40 |
| PASP | 2.25 | 1.25 | 0.75 | 0.50 | |
| PASP–ED2A | 131.75 | 92.50 | 21.00 | 4.00 | |
Fig. 13 shows the conductivity–time curves of CaSO4 solutions with and without scale inhibitors (0.75 mg L−1 PASP or PASP–ED2A). The conductivity–time curve can determine the tind of CaSO4 scale and the tind value can reflect the scale inhibition performance of the scale inhibitors. The larger the tind is, the lower the nucleation rate of CaSO4 crystal would be, and the longer the time of crystal nucleus formation and growth would be. When the concentration of blank CaSO4 solution and those CaSO4 solutions with different scale inhibitors gradually increases from 0.07 mol L−1 to 0.10 mol L−1, their conductivity tends to increase at different paces and level off at different test durations, while their tind tends to decrease therewith at different paces (Fig. 13 and Table 2). Particularly, the CaSO4 solutions with PASP–ED2A exhibit much larger tind than the blank CaSO4 solution and the CaSO4 solutions with PASP. This corresponds to the better scale inhibition performance of PASP–ED2A in comparison to that of PASP.
| Category | Antiscalant | CaSO4 solutions with different concentration (mol L−1) | |||
|---|---|---|---|---|---|
| 0.07 | 0.08 | 0.09 | 0.10 | ||
| tind (min) | Blank | 5.0 | 2.8 | 1.5 | 1.0 |
| PASP | 12.5 | 4.8 | 3.0 | 2.0 | |
| PASP–ED2A | 31.0 | 12.5 | 3.3 | 2.3 | |
Table 2 shows the tind of CaSO4 in the presence of different scale inhibitors. In 0.07 mol L−1 CaSO4 solution, PASP can increase the induction time from 5.0 min to 12.5 min, while PASP–ED2A can increase the induction time to 31.0 min. This indicates that compared with PASP, the PASP–ED2A derivative can more efficiently inhibit the growth of CaSO4 scale. As can be seen from Fig. 13(d), the CaSO4 crystals formed in the blank CaSO4 solution and the CaSO4 solutions with 0.75 mg L−1 PASP or 0.75 mg L−1 PASP–ED2A exhibit surface energies of 14.8 eV, 15.4 eV and 17.7 eV, respectively. The increase in the surface energy of CaSO4 crystal upon the addition of PASP–ED2A demonstrates that PASP–ED2A can well retard the formation and growth of CaSO4 crystal nuclei, thereby exerting improved scale inhibition performance.
3.5 Theoretical calculation results of PASP and PASP–ED2A
From the above discussion, it can be seen that PASP and PASP–ED2A can exert their scale inhibition effect by chelating with Ca2+. To better understand the coordination details, we further investigate their chelating ability with Ca2+ by DFT calculations (for details, please see ESI†). Fig. 14 shows the binding energies (BE) for PASP and PASP–ED2A to chelate with Ca2+. The carboxyl groups in the side chains of PASP and PASP–ED2A can chelate with Ca2+ to form one or two four-membered rings, respectively; and the binding energies for PASP–Ca2+ chelation and PASP–ED2A–Ca2+ chelation are −304.1 kcal mol−1 and −488.2 kcal mol−1, respectively. This means that, as compared with PASP, the PASP–ED2A derivative is easier to combine with Ca2+, thereby exerting better scale inhibition performance.4. Conclusions
In summary, a novel phosphorus-free PASP derivative with side chains bearing semi-EDTA structure is rationally designed and successfully prepared. Static scale inhibition tests demonstrate that the as-prepared PASP–ED2A derivative exhibits good scale inhibition performance against CaCO3 and CaSO4 at a low concentration or a high temperature; and it exhibits better scale inhibition performance than PASP. SEM and XRD characterizations demonstrate that the addition of PASP–ED2A can affect the morphology of CaCO3 and CaSO4 as well as the crystal shape of CaCO3. Namely, PASP–ED2A can promote the formation of vaterite crystal and delay the formation of calcite crystal. This is because the coordination atoms in the molecular structure of PASP–ED2A can chelate with Ca2+, thereby inhibiting the combination of Ca2+ with anions and preventing the generation of CaCO3 scale or CaSO4 scale. XPS analyses indicate that PASP and PASP–ED2A can change the chemical environment of Ca2+ to different extents, which could partly account for the difference in their scale inhibition performance. Besides, monitoring crystallization processes of CaCO3 and CaSO4 crystals in association with DFT calculations reveals that the CaCO3 and CaSO4 crystals generated in the presence of PASP–ED2A exhibit significantly increased surface energy, while PASP–ED2A is easier than PASP to chelate with Ca2+. In other words, the PASP–ED2A derivative can more efficiently retard the formation and growth of CaCO3 and CaSO4 crystal nuclei, thereby exerting better inhibition performance against CaCO3 and CaSO4 scales than PASP. Further studies towards the development of other novel PASP derivatives are ongoing in our laboratories.Conflicts of interest
There are no conflicts to declare.References
- X. Qu, P. J. J. Alvarez and Q. Li, Applications of nanotechnology in water and wastewater treatment, Water Res., 2013, 47, 3931–3946, DOI:10.1016/j.watres.2012.09.058.
- A. Zeino, I. Abdulazeez, M. Khaled, M. W. Jawich and I. B. Obot, Mechanistic study of polyaspartic acid (PASP) as eco-friendly corrosion inhibitor on mild steel in 3% NaCl aerated solution, J. Mol. Liq., 2018, 250, 50–62, DOI:10.1016/j.molliq.2017.11.160.
- Y. Zhou, J. Wang and Y. Fang, Green and high effective scale inhibitor based on ring-opening graft modification of polyaspartic acid, Catalysts, 2021, 11 DOI:10.3390/catal11070802.
- X. Li, B. Gao, Q. Yue, D. Ma, H. Rong, P. Zhao and P. Teng, Effect of six kinds of scale inhibitors on calcium carbonate precipitation in high salinity wastewater at high temperatures, J. Environ. Sci., 2015, 29, 124–130, DOI:10.1016/j.jes.2014.09.027.
- W. Yu, D. Song, W. Chen and H. Yang, Antiscalants in RO membrane scaling control, Water Res., 2020, 183, 115985, DOI:10.1016/j.watres.2020.115985.
- H. Zhang, X. Luo, X. Lin, P. Tang, X. Lu, M. Yang and Y. Tang, Biodegradable carboxymethyl inulin as a scale inhibitor for calcite crystal growth: molecular level understanding, Desalination, 2016, 381, 1–7, DOI:10.1016/j.desal.2015.11.029.
- S. Zhang, H. Qu, Z. Yang, C. Fu, Z. Tian and W. Yang, Scale inhibition performance and mechanism of sulfamic/amino acids modified polyaspartic acid against calcium sulfate, Desalination, 2017, 419, 152–159, DOI:10.1016/j.desal.2017.06.016.
- Y. Zhang, H. Yin, Q. Zhang, Y. Li and P. Yao, Synthesis and characterization of novel polyaspartic acid/urea graft copolymer with acylamino group and its scale inhibition performance, Desalination, 2016, 395, 92–98, DOI:10.1016/j.desal.2016.05.020.
- J. Chen, L. Xu, J. Han, M. Su and Q. Wu, Synthesis of modified polyaspartic acid and evaluation of its scale inhibition and dispersion capacity, Desalination, 2015, 358, 42–48, DOI:10.1016/j.desal.2014.11.010.
- V. Fischer, K. Landfester and R. Muñoz-Espí, Stabilization of calcium oxalate metastable phases by oligo(L-glutamic acid): effect of peptide chain length, Cryst. Growth Des., 2011, 11, 1880–1890, DOI:10.1021/cg200058d.
- M. Ø. Olderøy, M. Xie, B. L. Strand, E. M. Flaten, P. Sikorski and J.-P. Andreassen, Growth and nucleation of calcium carbonate vaterite crystals in presence of alginate, Cryst. Growth Des., 2009, 9, 5176–5183, DOI:10.1021/cg9005604.
- D.-E. Liu, H. Han, H. Lu, G. Wu, Y. Wang, J. Ma and H. Gao, Synthesis of amphiphilic polyaspartamide derivatives and construction of reverse micelles, RSC Adv., 2014, 4, 37130–37137, 10.1039/C4RA04432K.
- Y. Lu, M. Chau, A. J. Boyle, P. Liu, A. Niehoff, D. Weinrich, R. M. Reilly and M. A. Winnik, Effect of pendant group structure on the hydrolytic stability of polyaspartamide polymers under physiological conditions, Biomacromolecules, 2012, 13, 1296–1306, DOI:10.1021/bm2018239.
- X. Cheng, J. Liu, L. Wang, R. Wang, Z. Liu and R. Zhuo, An enzyme-mediated in situ hydrogel based on polyaspartamide derivatives for localized drug delivery and 3D scaffolds, RSC Adv., 2016, 6, 101334–101346, 10.1039/C6RA18479K.
- E. Jalalvandi, L. R. Hanton and S. C. Moratti, Schiff-base based hydrogels as degradable platforms for hydrophobic drug delivery, Eur. Polym. J., 2017, 90, 13–24, DOI:10.1016/j.eurpolymj.2017.03.003.
- D. Juriga, K. Nagy, A. Jedlovszky-Hajdu, K. Perczel-Kovách, Y. M. Chen, G. Varga and M. Zrínyi, Biodegradation and osteosarcoma cell cultivation on poly(aspartic acid) based hydrogels, ACS Appl. Mater. Interfaces, 2016, 8, 23463–23476, DOI:10.1021/acsami.6b06489.
- Y. Gao, L. Fan, L. Ward and Z. Liu, Synthesis of polyaspartic acid derivative and evaluation of its corrosion and scale inhibition performance in seawater utilization, Desalination, 2015, 365, 220–226, DOI:10.1016/j.desal.2015.03.006.
- J. Yang, T. Liu, H. Liu, D. Zhang, L. Zhai, J. Liu, M. Wang, Y. Chen, B. Chen and H. Wang, Biodegradable PASP can effectively inhibit nitrification, moderate NH3 emission, and promote crop yield, Arch. Agron. Soil Sci., 2019, 65, 1273–1286, DOI:10.1080/03650340.2018.1562275.
- M. F. Mady, A. Rehman and M. A. Kelland, Synthesis and study of modified polyaspartic acid coupled phosphonate and sulfonate moieties as green oilfield scale inhibitors, Ind. Eng. Chem. Res., 2021, 60, 8331–8339, DOI:10.1021/acs.iecr.1c01473.
- Z. Amjad and P. G. Koutsoukos, Evaluation of maleic acid based polymers as scale inhibitors and dispersants for industrial water applications, Desalination, 2014, 335, 55–63, DOI:10.1016/j.desal.2013.12.012.
- S. Carvalho, L. Palermo, L. Boak, K. Sorbie and E. F. Lucas, Influence of terpolymer based on amide, carboxylic, and sulfonic groups on the barium sulfate inhibition, Energy Fuels, 2017, 31, 10648–10654, DOI:10.1021/acs.energyfuels.7b01767.
- M. A. Migahed, S. M. Rashwan, M. M. Kamel and R. E. Habib, Synthesis, characterization of polyaspartic acid-glycine adduct and evaluation of their performance as scale and corrosion inhibitor in desalination water plants, J. Mol. Liq., 2016, 224, 849–858, DOI:10.1016/j.molliq.2016.10.091.
- G. McLendon, R. J. Motekaitis and A. E. Martell, Cobalt complexes of ethylenediamine-N,N'-diacetic acid and ethylenediamine-N,N-diacetic acid: two-nitrogen oxygen carriers, Inorg. Chem., 1975, 14, 1993–1996, DOI:10.1021/ic50150a050.
- M. Chaussemier, E. Pourmohtasham, D. Gelus, N. Pécoul, H. Perrot, J. Lédion, H. Cheap-Charpentier and O. Horner, State of art of natural inhibitors of calcium carbonate scaling. A review article, Desalination, 2015, 356, 47–55, DOI:10.1016/j.desal.2014.10.014.
- E. A. Abdel-Aal, H. M. Abdel-Ghafar and B. E. El Anadouli, New findings about nucleation and crystal growth of reverse osmosis desalination scales with and without Inhibitor, Cryst. Growth Des., 2015, 15, 5133–5137, DOI:10.1021/acs.cgd.5b01091.
- Q. Liu, G.-R. Xu and R. Das, Inorganic scaling in reverse osmosis (RO) desalination: Mechanisms, monitoring, and inhibition strategies, Desalination, 2019, 468, 114065, DOI:10.1016/j.desal.2019.07.005.
- D. Hasson, A. Drak and R. Semiat, Inception of CaSO4 scaling on RO membranes at various water recovery levels, Desalination, 2001, 139, 73–81, DOI:10.1016/S0011-9164(01)00296-X.
- D. Hasson, A. Drak and R. Semiat, Induction times induced in an RO system by antiscalants delaying CaSO4 precipitation, Desalination, 2003, 157, 193–207, DOI:10.1016/S0011-9164(03)00399-0.
- W. Yu, W. Chen and H. Yang, Evaluation of structural effects on the antiscaling performance of various graft cellulose-based antiscalants in RO membrane scaling control, J. Membr. Sci., 2021, 620, 118893, DOI:10.1016/j.memsci.2020.118893.
- Y. Zuo, Y. Sun, W. Yang, K. Zhang, Y. Chen, X. Yin and Y. Liu, Performance and mechanism of 1-hydroxy ethylidene-1,1-diphosphonic acid and 2-phosphonobutane-1,2,4-tricarboxylic acid in the inhibition of calcium carbonate scale, J. Mol. Liq., 2021, 334, 116093, DOI:10.1016/j.molliq.2021.116093.
- A. Jawor and E. M. V. Hoek, Effects of feed water temperature on inorganic fouling of brackish water RO membranes, Desalination, 2009, 235, 44–57, DOI:10.1016/j.desal.2008.07.004.
- Y. Cheng, X. Guo, X. Zhao, Y. Wu, Z. Cao, Y. Cai and Y. Xu, Nanosilica modified with polyaspartic acid as an industrial circulating water scale inhibitor, npj Clean Water, 2021, 4 DOI:10.1038/s41545-021-00137-y.
- E. G. Darton, Membrane chemical research: centuries apart, Desalination, 2000, 132, 121–131, DOI:10.1016/S0011-9164(00)00141-7.
- S. Kamali and R. Arefinia, Effect of PAAT as an environmentally friendly terpolymer on the scale inhibition of CaCO3 in artificial seawater: chemical and electrochemical study, Ind. Eng. Chem. Res., 2019, 59, 627–635, DOI:10.1021/acs.iecr.9b05943.
- H. Li, M. K. Hsieh, S. H. Chien, J. D. Monnell, D. A. Dzombak and R. D. Vidic, Control of mineral scale deposition in cooling systems using secondary-treated municipal wastewater, Water Res., 2011, 45, 748–760, DOI:10.1016/j.watres.2010.08.052.
- Y. M. Al-Roomi and K. F. Hussain, Potential kinetic model for scaling and scale inhibition mechanism, Desalination, 2016, 393, 186–195, DOI:10.1016/j.desal.2015.07.025.
- R. Ketrane, B. Saidani, O. Gil, L. Leleyter and F. Baraud, Efficiency of five scale inhibitors on calcium carbonate precipitation from hard water: Effect of temperature and concentration, Desalination, 2009, 249, 1397–1404, DOI:10.1016/j.desal.2009.06.013.
Footnote |
| † Electronic supplementary information (ESI) available. See https://doi.org/10.1039/d2ra04075a |
| This journal is © The Royal Society of Chemistry 2022 |

