 Open Access Article
Magnetic relaxation switching assay based on three-dimensional assembly of Fe3O4@ZIF-8 for detection of cadmium ions†
Zhou Xu a,
ShiQin Daia,
YiXuan Wanga,
YanQiu Chena,
Yun-Hui Chengac and
Shuang Peng*ab
aHunan Provincial Key Laboratory of Cytochemistry, School of Food Science and Bioengineering, Changsha University of Science & Technology, Changsha 410114, P. R. China. E-mail: Ps20220414@163.com
bCollege of Chemistry and Chemical Engineering, Hunan University, Changsha, 410082, Hunan, China
cSchool of Food Science and Engineering, Qilu University of Technology, Jinan, Shandong 250353, China
First published on 2nd September 2022
Abstract
The design and construction of a novel magnetic resonance switch (MRS) sensor for cadmium ion (Cd2+) detection is described. Fe3O4@ZIF-8 was synthesized through seed-mediated growth of dimercaptosuccinic acid-coated Fe3O4. Fe3O4@ZIF-8 with high relaxation value (163.086 mM−1 s−1) and large negative zeta potential (−20.69 mV) exhibited good magnetic relaxation performance and water solubility. The successfully synthesized Fe3O4@ZIF-8 was used to develop an immune recognition-based MOFs-MRS sensor for highly sensitive detection of Cd2+. The proposed MRS detected a wide linear range of Cd2+ concentration from 2 to 200 ng mL−1 with a low limit of detection of 0.65 ng mL−1 (S/N = 3), and displayed high selectivity towards matrix interference. The robust sensing system was effective even in a complex sample matrix, enabling the quantitative analysis of Cd2+ content in rice samples and drinking water samples with good reliability. Recoveries of Cd2+ ranged from 91.50 to 112.05% for spiked drinking water and from 95.86 to 110.45% for spiked rice samples. The versatility of Fe3O4@ZIF-8 with customized relaxation responses could allow the adaptation of magnetic resonance platforms for food safety purposes.
Introduction
Heavy metal pollutants have attracted increasing public attention in recent years due to their serious threat to human health and the environment.1–5 Highly sensitive and accurate detection of heavy metal contamination in food and environmental samples is important for public health. Cadmium ions (Cd2+) are a typical heavy metal contaminant. Excess Cd2+ seriously threatens human health and can lead to serious diseases, including diarrhea, stomach pains, severe vomiting, bone fracture, reproductive failure and possibly even infertility, damage to the central nervous system and immune system, psychological disorders, and possibly DNA damage.6–8 The World Health Organization has mandated that the concentration of Cd2+ in drinking water and air should be <0.005 mg L−1 and <5 ng m−3, respectively.9 Traditional Cd2+ detection methods include inductively coupled plasma-mass spectrometry (ICP-MS)10 and atomic absorption/fluorescence spectrometry.11,12 These methods have high detection sensitivity and reliable detection. However, requirements for complex sample pretreatment, skilled technicians, and expensive instruments have limited their widespread application in routine testing. Therefore, it to design fast, low-cost, and reliable detection methods for Cd2+ analysis in real samples.The boom in nanotechnology is driving the development of traditional analytical methods. A variety of sensors have been developed to sensing metal pollutants. These include optical sensors and electrochemical sensors.13,14 However, considering their susceptibility to interferences from the impurities, optical and electrochemical detections usually demand complicated sample pretreatments. In contrast, the magnetic relaxation switching (MRS) biosensor can be utilized in turbid and light-impermeable media without separation and purification steps.15–17 It has been widely used to analyze different targets, including heavy metals,18 DNA,19 viruses,20 bacteria,21 pesticide residues,22,23 hormones,24 and antibiotics.25,26 The principles of conventional MRS biosensors generally rely on dispersion/aggregation or altered concentration of magnetic nanoparticles (MNPs).27,28 The unstable dispersion/aggregation and broad-size distribution of traditional MNPs compromises the sensitivity of MRS sensors.29 To address these issues, the synthesis of highly disperse magnetic materials with high relaxation rates magnetic materials could more effectively modulate the relaxation behavior of water molecules, thus increasing the sensitivity of MRS biosensors.
Metal–organic frameworks (MOFs), an important kind of porous inorganic–organic hybrid materials with inherent outstanding physicochemistry characteristics, can be widely applied for the facile preparation of MOFs magnetic nanoporous materials.30–32 The porous structure and high specific surface area of MOFs magnetic nanoporous materials can effectively host significant amounts of MNPs, which prevents their aggregation.33 In addition, the porous structures and high specific surface areas of MOFs magnetic nanoporous materials impeded the access of water molecules into the MNP particle core. It reduced the self-diffusion coefficient of the vicinity water molecules, which increased the r2 value (r2, the indicator of magnetic relaxation performances). The high r2 value and exceptional chemical stability will help improve the performance of detecting MRS sensors.34,35 However, reports of MRS biosensors based on MOFs materials have been very limited in the literature. Based on our previous findings, MOFs magnetic nanoporous materials (Fe3O4@NPC) are excellent signal labels for enhanced magnetic relaxation switch signals that can be applied to MRS sensors.36 But, the poorly dispersed and low r2 value of these magnetic nanoporous materials problems for the MRS sensor detection performance. Therefore, synthesizing novel MOFs magnetic nanoporous materials with higher magnetic relaxation performances is crucial for improving the performance of MRS sensors.
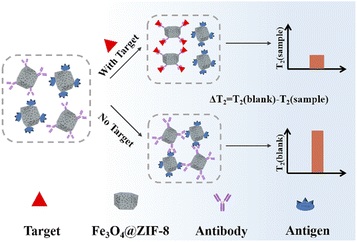
In this work, we reported the Fe3O4@zeolite imidazolate framework-8 (ZIF-8) composites obtained through seed-mediated growth of dimercaptosuccinic acid (DMSA)-coated Fe3O4. It was exciting to find that the Fe3O4@ZIF-8 with higher relaxation values and large negative zeta potentials exhibited excellent magnetic relaxation performances and good water solubility. Based on the Fe3O4@ZIF-8, we developed an immune recognition-based MOFs-MRS sensor for highly sensitive detection of Cd2+ (Scheme 1). The detection mechanism is based on the change in T2 relaxation time caused by the assembly and disassembly of Fe3O4@ZIF-8 through immune recognition. In the absence of Cd2+, antibody (Ab)-Fe3O4@ZIF-8 and antigen (Ag)-Fe3O4@ZIF-8 assembled by immunological recognition, which makes a low change in the T2 value. However, in the presence of Cd2+ strongly recognize with Ab-Fe3O4@ZIF-8 prevented the assembly of Ab-Fe3O4@ZIF-8 with Ag-Fe3O4@ZIF-8, which decreased the T2 value and increased ΔT2 (denoted as the change of the T2 value). Experimental results validated that the MOFs-MRS exhibited good sensitivity and a low detection limit (LOD) to determine Cd2+ in practical applications.
Results and discussion
Preparation and characterization of Fe3O4@ZIF-8
We prepared and characterized Fe3O4@ZIF-8 for the MRS sensor. The Fe3O4 was modified by DMSA (Fe3O4-DMSA), a small molecule with multiple carboxyl and mercapto functional groups. Fe3O4@ZIF-8 was obtained through seed-mediated growth of Fe3O4-DMSA. Transmission electron microscopy (TEM) was used to characterize the morphology of Fe3O4-DMSA and Fe3O4@ZIF-8. As shown in Fig. S1,† ZIF-8 exhibit the rhombic shape and have an average diameter of 179 nm. The morphology of Fe3O4@ZIF-8 composite is not markedly altered but the particle size is smaller (174 nm, Fig. 1C), because of the presence of heterogeneous nucleation process that typically leads to smaller crystals.37,38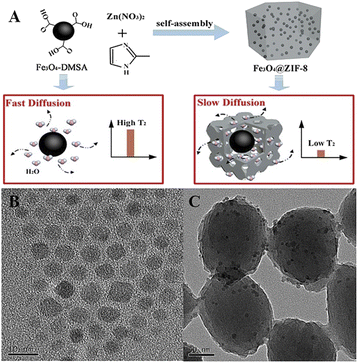 | ||
| Fig. 1 (A) Synthesis process of Fe3O4@ZIF-8. (B and C) TEM images of the Fe3O4-DMSA (B) and Fe3O4@ZIF-8 (C). | ||
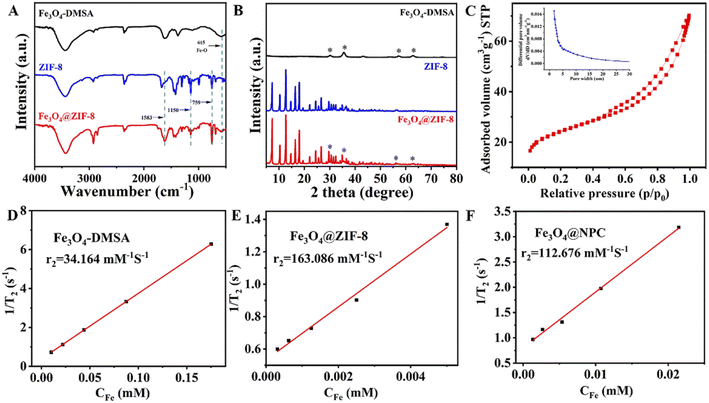
To further confirm the synthesis of Fe3O4@ZIF-8, we performed Fourier transform infrared spectroscopy (FTIR), X-ray diffraction (XRD) and X-ray Photoelectron spectroscopy (XPS) for Fe3O4-DMSA, ZIF-8, and Fe3O4@ZIF-8. The Fe3O4-DMSA has the characteristic peak of Fe–O vibration band in 615 cm−1, and the ZIF-8 has characteristic peaks in 759, 1150, and 1583 cm−1. Three peaks at 759 cm−1, 1150 cm−1 and 1583 cm−1 were observed in the spectrum of Fe3O4@ZIF-8, which reflected the existence of Fe3O4 nanoparticles.39 The XRD peaks for Fe3O4@ZIF-8 are in line with the peaks of ZIF-8 at low angles of 5–20° and that of Fe3O4-DMSA at angles of 30°, 35°, 57°, and 63°, indicating the formation of Fe3O4@ZIF-8 composites. As shown in Fig. S3(A),† the XPS spectra of Fe3O4@ZIF-8 indicated the presence of carbon, nitrogen, oxygen, iron, and zinc species.40 The Zn 2p spectra of Fe3O4@ZIF-8 showed that the spin orbitals of Zn 2p1/2 and Zn 2p3/2 have strong signals at 1045.00 eV and 1022.00 eV, respectively, demonstrating the existence of divalent Zn in the as-synthesized corresponding to characteristic peaks of ZIF-8. One peak at 615 cm−1 Fe3O4@ZIF-8. The C 1s spectrum showed that C-sp3, C–O and C![[double bond, length as m-dash]](https://www.rsc.org/images/entities/char_e001.gif) O groups are corresponding at 284.82
O groups are corresponding at 284.82 ![[thin space (1/6-em)]](https://www.rsc.org/images/entities/char_2009.gif) eV, 285.83
eV, 285.83 ![[thin space (1/6-em)]](https://www.rsc.org/images/entities/char_2009.gif) eV and 288.62
eV and 288.62 ![[thin space (1/6-em)]](https://www.rsc.org/images/entities/char_2009.gif) eV, respectively.41 Displayed that the O 1s spectra consisting of three components with binding energies at 532.1, 331.57 eV and 531.28 eV, which were associated with C–OH, C–O, and Fe–O.42 We also measured the concentration of Fe by Inductive Coupled Plasma Emission Spectrometer (ICP), the Fe concentration of ZIF-8 and Fe3O4@ZIF-8 were 0.01% and 4.29%, which significant indicated Fe3O4-DMSA exists in the Fe3O4@ZIF-8. These characterized and confirmed the preparation of the nanocomposite we designed.
eV, respectively.41 Displayed that the O 1s spectra consisting of three components with binding energies at 532.1, 331.57 eV and 531.28 eV, which were associated with C–OH, C–O, and Fe–O.42 We also measured the concentration of Fe by Inductive Coupled Plasma Emission Spectrometer (ICP), the Fe concentration of ZIF-8 and Fe3O4@ZIF-8 were 0.01% and 4.29%, which significant indicated Fe3O4-DMSA exists in the Fe3O4@ZIF-8. These characterized and confirmed the preparation of the nanocomposite we designed.
Additionally, the N2 sorption isotherms were also examined to analyze the porous structure of the Fe3O4@ZIF-8.43 The nitrogen adsorption/desorption curves of the Fe3O4@ZIF-8 were type III curves with a relative pressure in the range of 0.8 to 1.0 with a significant hysteresis loop (Fig. 2C), suggesting a micro/mesoporous structure characteristic of Fe3O4@ZIF-8. The average Barrett–Joyner–Halenda (BJH) adsorption pore sizes of the Fe3O4@ZIF-8 was 1.76 nm (Fig. 2C). These results indicated that micro-mesopores contributed significantly to the pore volumes of the Fe3O4@ZIF-8 nanostructures. The proton transverse relaxation performance of materials is essential for the successful construction of an MRS sensor.17 Fig. 2D and E show that the transverse relaxation rate (r2, the indicators of magnetic relaxation performances) of Fe3O4@ZIF-8 (163.086 mM−1 s−1) was higher than Fe3O4-DMSA (34.164 mM−1 s−1). In addition, the Fe3O4@ZIF-8 displayed a higher r2 value than Fe3O4@NPC (163.086 vs. 112.676 mM−1 s−1). The apparent increase in the r2 value will help improve the performance of Fe3O4@ZIF-8 in MRS sensor.
Dynamic light scattering (DLS), transmission electron microscopy (TEM), and electrophoretic light scattering (ELS) were used to characterize the dispersity of Fe3O4@ZIF-8. As shown in Fig. 3A the hydrated particle diameter of Fe3O4@ZIF-8 was 337 nm. The average hydro-diameter of Fe3O4@ZIF-8 were larger than the actual diameters of that, which were similar to previous reports.44,45
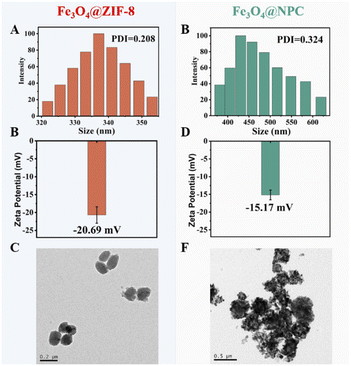 | ||
| Fig. 3 (A and B) Size distribution of Fe3O4@ZIF-8 (A) and Fe3O4@NPC (B). (C and D) Zeta potential of Fe3O4@ZIF-8 (C) and Fe3O4@NPC (D). (E and F) TEM image of Fe3O4@ZIF-8 (E) and Fe3O4@NPC (F). | ||
The particle polymer dispersity index (PDI) of Fe3O4@ZIF-8 (0.208) was lower than that of Fe3O4@NPC (0.324) (Fig. 3B). The zeta potential of Fe3O4@ZIF-8 of −20.69 mV (Fig. 3C) was lower than that of Fe3O4@NPC (−15.8 mV) (Fig. 3D). Negative zeta potentials can effectively inhibit aggregation of nanoparticles due to electric repulsion.46,47 TEM revealed a greater dispersity of Fe3O4@ZIF-8 compared to Fe3O4@NPC (Fig. 3E and F). The collective results demonstrated the good dispersion of Fe3O4@ZIF-8, which is advantageous in constructing a sensitive MRS sensor. These results indicated that the Fe3O4@ZIF-8 exhibited good magnetic relaxation and water solubility, which will help improve the performance of the MOFs-MRS sensor.
Construction of Fe3O4@ZIF-8-based MRS sensor
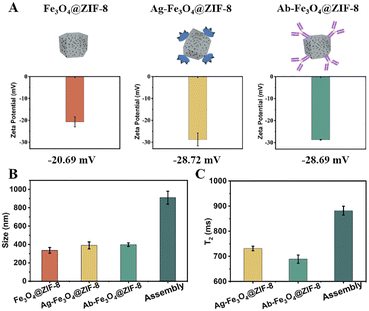
To illustrate the assembly of Ag-Fe3O4@ZIF-8 and Ab-Fe3O4@ZIF-8, we evaluated the hydration particle size and zeta potentials using DLS and ELS. Fe3O4@ZIF-8 were coated with Cd2+-specific antibodies and Cd2+-specific antigens to form Ab-Fe3O4@ZIF-8 and Ag-Fe3O4@ZIF-8, respectively. The hydration particle size of Ab-Fe3O4@ZIF-8 increased from 337 nm to 398 nm and that of Ag-Fe3O4@ZIF-8 from 337 nm to 390 nm (Fig. 4B). Their zeta potentials decreased from −20.69 mV to −28.69 mV and −28.72 mV, respectively (Fig. 4A). After the biological immune recognition, the hydration particle size of assembly objects changed obviously (910.27 nm) (Fig. 4B). These results indicated that the antibody and antigen successfully modify the surface of Fe3O4@ZIF-8. To evaluate the feasibility of the Ag-Fe3O4@ZIF-8 and Ab-Fe3O4@ZIF-8 assembly in the construction of the MRS sensor, we measured the T2 relaxation time of Ag-Fe3O4@ZIF-8, Ab-Fe3O4@ZIF-8, and assembly. As shown in Fig. 4C, the T2 relaxation time of the assembly (881.864 ms) was higher than that of Ab-Fe3O4@ZIF-8 (689.104 ms) and Ag-Fe3O4@ZIF-8 (731.368 ms). The findings indicated that assembly increased the transverse relaxation time and confirmed the feasibility of Fe3O4@ZIF-8 to construct the MRS immunosensor.Optimization of detection conditions
To improve the analytical performance of the MRS, we optimized the concentration of Fe3O4@ZIF-8, antibodies/antigens, incubation time, and TE values. The ΔT2 value increased with increasing Fe3O4@ZIF-8 concentration, and then maintained a decreasing amplitude after reaching 0.15 mg mL−1 (Fig. 5A). In this case, 0.15 mg mL−1 was selected for further investigation. The influence of the concentration of antibodies/antigens on changes in T2 are shown in Fig. 5B. An antibody/antigen concentration of 4 μg mL−1 was the optimum concentration. Fig. 5C shows the optimized reaction times; ΔT2 increased gradually with increasing reaction time from 20 min to 100 min. Subsequently, ΔT2 reached a plateau after 60 min, indicating that the Cd2+-induced assembly of NPs was fully achieved. Therefore, 60 min was used as the optimal reaction time for the following BPA detection. As shown in Fig. 5D, the maximum value of ΔT2 was observed at a TE of 2 ms, which was selected for the subsequent experiments. To ensure accurate results, the optimal conditions were used in subsequent detections.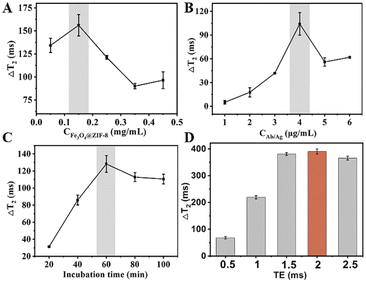 | ||
| Fig. 5 Condition optimization of the MRS biosensor. (A–D) Effect of the Fe3O4@ZIF-8 concentration (A), antigen/antibody concentration (B), incubation time (C), and echo time (D). | ||
Detection of Cd2+ by MRS sensor
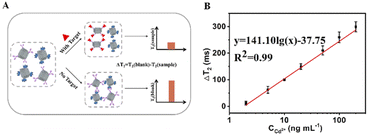
We employed the Ag-Fe3O4@ZIF-8 and Ab-Fe3O4@ZIF-8 to construct a MOFs-MRS sensor for the detection of Cd2+. The detection mechanism is based on the change in T2 relaxation time caused by the assembly and disassembly of Fe3O4@ZIF-8 through immune recognition. In the absence of Cd2+, Ab-Fe3O4@ZIF-8 with Ag-Fe3O4@ZIF-8 leads to an immunological recognition-based assembly, which makes a low change in the T2 value. In contrast, exposure of Cd2+ to the system will break the assembly process (disassembly) based on the competition effect of Cd2+ with Cd2+-Ag to strongly recognize Ab-Fe3O4@ZIF-8. This decreases the T2 value and increases ΔT2 (denoted as the change of the T2 value) (Fig. 6A). The assembly degree of Fe3O4@ZIF-8 is related to the concentration of Cd2+. Under optimized conditions, a linear relationship was obtained between ΔT2 and the concentration of Cd2+ from 2 to 200 ng mL−1. The linear equation was y = 141.10lg(x) − 37.75 (R2 = 0.99). The limit of detection (LOD) was 0.65 ng mL−1, calculated by 3σb/slope (σb, standard deviation of the blank samples). The LOD was lower than that of the other MRS and other conventional sensitive detection methods (Table S1†).Specificity analysis
To assess the selectivity of the MRS platform for Cd2+ detection, several metal ions, including K+, Na+, Fe2+, Mg2+, Ca2+, Pd2+, Ba2+, Zn2+, and Ag+, were tested in the same way. As shown in Fig. 7, Cd2+ resulted in a remarkable value of ΔT2. Other metal ions failed to generate obvious ΔT2 value in the sensing system. The data demonstrated that this sensing platform possessed excellent specificity for the Cd2+ assay. The control heavy metal ions did not disturb the biosensor response. This high specificity can be ascribed to the high binding capability between Cd2+ and antibody.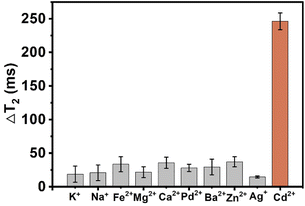 | ||
| Fig. 7 Selectivity testing of the sensing system for Cd2+ and some control metal ions. Error bars represent the standard deviation of three replicates (n = 3). | ||
Real sample analysis
To demonstrate the practical applications of the sensing platform, this biosensor was applied to the detection of Cd2+ in drinking water and rice samples. The results as depicted in Table 1. The measured Cd2+ in rice samples agree well with the added concentrations with the recoveries of 91.50% to 112.05% and a relative standard deviation (RSD) of 1.05% to 11.74%. Also, the measured Cd2+ in drinking water agreed well with the added concentrations with the recoveries of 95.85% to 110.44% as well as relative RSD of 2.14% to 9.69%.48 The findings revealed that the magnetic sensor can be applied in the practical sample detection, with good accuracy and sensitivity for Cd2+ detection in food samples.| Sample | Added concentration (ng mL−1) | Detected concentration (ng mL−1) | RSD (n = 3, %) | Recovery (n = 3, %) |
|---|---|---|---|---|
| Rice | 50 | 45.75 ± 0.48 | 1.05 | 91.50 ± 0.96 |
| 20 | 22.41 ± 2.63 | 11.74 | 112.05 ± 13.15 | |
| 2 | 1.99 ± 0.03 | 1.50 | 99.50 ± 1.50 | |
| Drinking water | 50 | 55.22 ± 3.97 | 7.19 | 110.44 ± 7.94 |
| 20 | 19.17 ± 1.86 | 9.70 | 95.85 ± 9.30 | |
| 2 | 1.96 ± 0.04 | 2.04 | 98.00 ± 2.00 |
Conclusions
In conclusion, we generated Fe3O4@ZIF-8 with high relaxation values and excellent dispersion. Based on the Fe3O4@ZIF-8, we establish a versatile immune recognition-based MOFs-MRS sensing system for sensitive detection of the Cd2+ in the real sample. The optimized MOFs-MRS displayed a broad quantitative range from 2 to 200 ng mL−1 and a limit of detection 0.65 ng mL−1. When tested using samples of rice and drinking water, the MOFs-MRS was conferred with a satisfactory recovery (91.50% to 112.05%). The findings also detail the improved dispersion and relaxation values of MOFs magnetic nanoporous materials, and are a novel approach to improve the performance of MOFs-based MRS sensor. Moreover, the MOFs-MRS sensing system could be expected to detect other food hazard factors by simply replacing antibody/antigen.Experimental
Preparation of Fe3O4@ZIF-8
Fe3O4-DMSA was synthesized following as previously described with slight modifications.35 Then, 0.003 mol of zinc nitrate hexahydrate was dissolved in 100 mL of N, N-Dimethylformamide (DMF, liquid A), and 0.006 mol of 2-methylimidazole was dissolved in 100 mL of DMF (liquid B). 1 mL of zinc nitrate hexahydrate and 9 mL of Fe3O4-DMSA (1.5 mg mL−1) solution were mixed in a 50 mL conical flask as the starting solution and heated in a water bath at 40 °C. 10 mL of both liquid A and liquid B were added to 10 mL of the initial solution using a syringe pump at a flow rate of 20 mL h−1 at a constant speed. After 30 min of reaction, 20 mL of the solution was collected from the reaction system. This represented the first growth product. 10 mL of the first growth product were used as the starting solution. 10 mL of both liquid A and liquid B were injected using a syringe pump at a flow rate of 20 mL h−1 at a constant speed. The second growth product was obtained by reaction for 1 h. For pure ZIF-8, the Fe3O4-DMSA is omitted and substituted with an equivalent amount of DI water.Preparation of functional Fe3O4@ZIF-8
We used the covalent coupling method to immobilize the antibodies/antigens on the Fe3O4@ZIF-8 surfaces. Antigen-Fe3O4@ZIF-8 (Ag-Fe3O4@ZIF-8) was prepared by adding 1 mL Fe3O4@ZIF-8, 2 mL of 4 μg mL−1 antigen solution, 0.5 mL of 10 mg mL−1 EDC solution, 0.2 mL of 10 mg mL−1 sulfo-NHS solution, and 2 mL of 0.5 mg mL−1 Fe3O4@ZIF-8 solution to a 10 mL centrifuge tube. The mixture was reacted at room temperature for 12 h to allow the coupling. Excess antibody was removed by centrifugation. Preparation of Ab-Fe3O4@ZIF-8 was similar to that of Ag-Fe3O4@ZIF-8 by simply replacing antigen with antibody.Optimization of relaxation sensing system conditions
Concentrations of Fe3O4@ZIF-8 were optimized at 0.05, 0.15, 0.25, 0.35 and 0.45 mg mL−1 according to the ΔT2 value. At the same concentration of Fe3O4@ZIF-8 (0.15 mg mL−1), antibody/antigen concentrations were optimized as 2, 4, 6, 8, and 10 μg mL−1. The incubation time was optimized as 20, 40, 60, 80, 100, and 120 min (0.15 mg mL−1 Fe3O4@ZIF-8, 4 μg mL−1 antibody/antigen). Finally, we selected the echo time (TE) of test parameters as 0.5, 1, 1.5, 2, and 2.5 ms.Detection of Cd2+
Conflicts of interest
There are no conflicts of interest to declare.Acknowledgements
This work was supported by the Nature Science Foundation of Hunan (2022JJ10046, 2021JJ30701), Shandong Taishan Industry Leading Talent Project High-efficiency Ecological Agriculture Innovation Project (no. 457 LJNY202004), the Research Foundation of Education Bureau of Hunan Province (21B0337), Research Project of the General Administration of Customs of the People's Republic of China (2020HK183), Foundation of State Key Laboratory of Utilization of Woody Oil Resource (GZKF202111).References
- S. Rajendran, T. A. K. Priya, K. S. Khoo, T. K. A. Hoang, H. S. Ng, H. S. H. Munawaroh, C. Karaman, Y. Orooji and P. L. Show, Chemosphere, 2022, 287, 132369 CrossRef CAS PubMed.
- M. Mao, T. Yan, J. Shen, J. Zhang and D. Zhang, Environ. Sci. Technol., 2021, 55, 3333–3340 CrossRef CAS PubMed.
- P. Y. Wang, L. Li, X. P. Pang, Y. Zhang, Y. Zhang, W. F. Dong and R. H. Yan, RSC Adv., 2021, 11, 12015–12021 RSC.
- H. Esmaeili, S. M. Mousavi, S. A. Hashemi, W.-H. Chiang and S. Ahmadpour Abnavi, Carbon Lett., 2021, 31, 851–862 CrossRef.
- S. A. Hashemi, S. Bahrani, S. M. Mousavi, F. Mojoudi, N. Omidifar, K. B. Lankarani, M. Arjmand and S. Ramakrishna, Chem. Eng. J., 2022, 440, 135896 CrossRef.
- T. Frangos and W. Maret, Nutrients, 2020, 13, 53 CrossRef PubMed.
- Y. Huang, Y. Dai, M. Li, L. Guo, C. Cao, Y. Huang, R. Ma, S. Qiu, X. Su, K. Zhong, Y. Huang, H. Gao and Q. Bu, Sci. Total Environ., 2021, 797, 149043 CrossRef CAS PubMed.
- S. A. Hashemi, S. Bahrani, S. M. Mousavi, N. Omidifar, M. Arjmand, K. B. Lankarani and S. Ramakrishna, Eur. Polym. J., 2022, 162, 110926 CrossRef CAS.
- D. H. Zhou, W. Wu, Q. Li, J. F. Pan and J. H. Chen, Anal. Methods, 2019, 11, 3546–3551 RSC.
- Y. Tian, J. Cheng, X. Han, Y. Li, T. Yang, M.-L. Chen, J. Ma and J.-H. Wang, J. Anal. At. Spectrom., 2022, 37, 157–164 RSC.
- R. Pavadai and P. Perumal, New J. Chem., 2022, 46, 3431–3447 RSC.
- C. T. Shi, Z. Y. Huang, A. B. Wu, Y. X. Hu, N. C. Wang, Y. Zhang, W. M. Shu and W. C. Yu, RSC Adv., 2021, 11, 29632–29660 RSC.
- T. Li, T. Yao, C. Zhang, G. Liu, Y. She, M. Jin, F. Jin, S. Wang, H. Shao and J. Wang, RSC Adv., 2016, 6, 66949–66956 RSC.
- A. D. Cabral, T. B. Radu, E. D. de Araujo and P. T. Gunning, RSC Chem. Biol., 2021, 2, 815–829 RSC.
- Y. P. Chen and M. X. Xie, RSC Adv., 2015, 5, 95401–95404 RSC.
- J. M. Perez, L. Josephson, T. O'Loughlin, D. Hogemann and R. Weissleder, Nat. Biotechnol., 2002, 20, 816–820 CrossRef CAS PubMed.
- Y. Xianyu, Y. Dong, Z. Zhang, Z. Wang, W. Yu, Z. Wang and Y. Chen, Biosens. Bioelectron., 2020, 155, 112106 CrossRef CAS PubMed.
- W. Jiang, S. Yang, X. Sun, W. Lu, D. Jiang, L. Xu, H. Xu, B. Gao, M. Ma and F. Cao, Anal. Methods, 2018, 10, 2494–2502 RSC.
- R. N. Silva and P. Zhang, Methods Mol. Biol., 2022, 2393, 611–622 CrossRef PubMed.
- S. H. Liao, H. S. Huang, J. H. Chen, Y. K. Su and Y. F. Tong, RSC Adv., 2018, 8, 4057–4062 RSC.
- X. Qi, Z. Wang, R. Lu, J. Liu, Y. Li and Y. Chen, Food Chem., 2021, 338, 127837 CrossRef CAS PubMed.
- W. Zheng, L. Zeng and Y. Chen, Anal. Chem., 2020, 92, 2787–2793 CrossRef CAS PubMed.
- Y. Dong, W. Zheng, D. Chen, X. Li, J. Wang, Z. Wang and Y. Chen, New J. Chem., 2019, 67, 9942–9949 CAS.
- L. Wu, Y. L. Xianyu, Z. L. Wang, Y. Z. Dong, X. B. Hu and Y. P. Chen, Anal. Chem., 2019, 91, 15555–15562 CrossRef CAS PubMed.
- Y. Chen, Y. Xianyu, M. Dong, J. Zhang, W. Zheng, Z. Qian and X. Jiang, Anal. Chem., 2018, 90, 6906–6912 CrossRef CAS PubMed.
- Y. Xianyu, Y. Dong, Z. Wang, Z. Xu, R. Huang and Y. Chen, ACS Sens, 2019, 4, 1942–1949 CrossRef CAS PubMed.
- Y. Yang, Y. Zhang, J.-C. Shen, H. Yang, Z.-G. Zhou and S.-P. Yang, Chin. Chem. Lett., 2016, 27, 891–895 CrossRef CAS.
- Y. Liu, Z. Cai, L. Sheng, M. Ma and X. Wang, J. Hazard. Mater., 2020, 388, 121728 CrossRef CAS PubMed.
- C. Min, H. Shao, M. Liong, T.-J. Yoon, R. Weissleder and H. Lee, ACS Nano, 2012, 6, 6821–6828 CrossRef CAS PubMed.
- N. A. Schejn, T. Mazet, V. Falk, L. Balan, L. Aranda, G. Medjahdi and R. Schneider, Dalton Trans., 2015, 44, 10136–10140 RSC.
- G. Lee, S. Lee, S. Oh, D. Kim and M. Oh, J. Am. Chem. Soc., 2020, 142, 3042 CrossRef CAS PubMed.
- H. C. Zhou, J. R. Long and O. M. Yaghi, Chem. Rev., 2012, 112, 673–674 CrossRef CAS PubMed.
- M. Aghayi-Anaraki and V. Safarifard, Eur. J. Inorg. Chem., 2020, 2020, 1916–1937 CrossRef CAS.
- H. Lu, Y. Xu, R. Qiao, Z. Lu, P. Wang, X. Zhang, A. Chen, L. Zou and Z. Wang, Nano Res., 2020, 13, 2216–2225 CrossRef CAS.
- Z. Xu, Y. Chen, M. Chen, W. Chen and Y. Cheng, J. Mater. Chem. C, 2021, 9, 11915–11923 RSC.
- Z. Xu, R. Wang, Y. Chen, M. Chen, J. Zhang, Y. Cheng, J. Xu and W. Chen, Mikrochim. Acta, 2021, 188, 90 CrossRef CAS PubMed.
- R. Ricco, P. Wied, B. Nidetzky, H. Amenitsch and P. Falcaro, Chem. Commun., 2020, 56, 5775–5778 RSC.
- A. Schejn, T. Mazet, V. Falk, L. Balan, L. Aranda, G. Medjahdi and R. Schneider, Dalton Trans., 2015, 44, 10136–10140 RSC.
- J. Lin, P. Xin, L. An, Y. Xu, C. Tao, Q. Tian, Z. Zhou, B. Hu and S. Yang, Chem. Commun., 2019, 55, 478–481 RSC.
- C. Huang, X. Qiao, W. Sun, H. Chen, X. Chen, L. Zhang and T. Wang, Anal. Chem., 2019, 91, 2418–2424 CrossRef CAS PubMed.
- J. Du, X. Chen, K. Liu, D. Zhao and Y. Bai, Sens. Actuators, B, 2022, 360, 131654 CrossRef CAS.
- Y. Qu, L. Qin, X. Liu and Y. Yang, Sep. Purif. Technol., 2022, 294, 121169 CrossRef CAS.
- K. S. Park, Z. Ni, A. P. Côté, J. Y. Choi, R. Huang, F. J. Uribe-Romo, H. K. Chae, M. O'Keeffe and O. M. Yaghi, Proc. Natl. Acad. Sci. U. S. A., 2006, 103, 10186–10191 CrossRef CAS PubMed.
- L. Xu, H. Yin, W. Ma, L. Wang, H. Kuang and C. Xu, J. Phys. Chem. B, 2013, 117, 14367–14371 CrossRef CAS PubMed.
- S. T. Dibaba, R. Y. Wei, W. S. Xi, L. Zhao, L. Y. Shi, W. Ren, T. Mayr and L. N. Sun, RSC Adv., 2018, 8, 35706–35718 RSC.
- Y. H. Zhang, M. M. Zhao, Z. X. Ning, S. J. Yu, N. Tang and F. B. Zhou, J. Agric. Food Chem., 2018, 66, 4208–4218 CrossRef CAS PubMed.
- H. Ohshima, A. Miyagishima, T. Kurita, Y. Makino, Y. Iwao, T. Sonobe and S. Itai, Int. J. Pharm., 2009, 377, 180–184 CrossRef CAS PubMed.
- S. A. Hashemi, S. M. Mousavi, S. Bahrani, S. Ramakrishna and S. H. Hashemi, Anal. Bioanal. Chem., 2020, 412, 5353–5365 CrossRef CAS PubMed.
Footnote |
| † Electronic supplementary information (ESI) available. See https://doi.org/10.1039/d2ra03926e |
| This journal is © The Royal Society of Chemistry 2022 |

