 Open Access Article
A TiN@C core–shell support for improving Pt catalyst corrosion resistance†
Hongyu Zhangab,
Jia Liub,
Xiaolin Lic,
Xiao Duanb,
Mengchen Yuanb,
Feng Caob,
Kui Sunc,
Yunbo Zhangc,
Ying Wang*c,
Zhengbin Gu*b,
Jia Li*a and
Jianguo Liua
aInstitute of Energy Power Innovation, North China Electric Power University Beijing, Changping 102206, China. E-mail: lijia@ncepu.edu.cn
bCollege of Engineering and Applied Sciences, Nanjing University, 22 Hankou Road, Nanjing 210093, China
cChina Automotive Innovation Corporation, 88 Shengli Road, Nanjing 211106, China
First published on 2nd September 2022
Abstract
The corrosion of the support in proton-exchange membrane fuel cells (PEMFCs) is a major obstacle to their development. In this study, we combined the excellent corrosion resistance and strong metal–support interaction (SMSI) provided by titanium nitride (TiN) with the excellent conductivity of carbon to construct a TiN@C composite support composed of a TiN core and a porous carbon nanolayer shell. The composite TiN@C support exhibited a higher corrosion resistance than the carbon support during testing at 1.2 V (vs. RHE) for 400 h. Based on X-ray photoelectron spectroscopy and density functional theory calculations, the improved corrosion resistance originated from the excellent corrosion resistance of titanium nitride itself and SMSI between Pt and N in TiN. Overall, the high corrosion resistance of the TiN@C support can significantly improve PEMFC durability.
Proton-exchange membrane fuel cells (PEMFCs) convert chemical energy into electrical energy directly through an electrochemical reaction.1 However, the degradation of the catalyst caused by the corrosion of the cathode catalyst support limits the commercial development of fuel cell vehicles (FCVs).2,3 Carbon materials are commonly used as supports in commercial applications because of their good conductivity.4 However, the poor corrosion resistance of carbon materials leads to catalyst degradation.5 Thus, upon FCV start-up and shut-down, the carbon support suffers an instantaneous potential jump to 1.2 V (vs. RHE) under low pH, high temperature, and high humidity, leading to the severe corrosion or dissolution of the carbon support and the rapid deterioration of the catalyst.6
Due to its excellent corrosion resistance and strong metal–support interaction (SMSI), titanium nitride (TiN) has attracted research attention as a catalyst support for PEMFC cathodes.7 TiN is considered to be the most promising carbon-free support material.8 Many studies have been reported on TiN supports.9 Based on first-principles calculations, Lim found that compared to graphite or graphene supports, the TiN crystal surface has a higher adsorption energy with Pt, resulting in greater electron overlap.10 Liao et al. reported that Pt nanoparticles (NPs) and transition metal nitride (TMN) exhibit SMSI; thus, Pt adheres strongly to Pt NP and TMN supports, which facilitates stability.9 Lee et al. prepared single-atom Pt on the surface of TiN NPs (Pt/TiN) as an oxygen reduction reaction (ORR) catalyst and obtained good durability.11 Pan et al. prepared hollow porous TiN nanotubes as an ORR catalyst support and found that the dendrite nanocrystals on the surfaces of the TiN nanotubes could re-capture and re-nucleate the Pt species that dissolved in the electrolyte. Accelerated degradation test results indicated that this support significantly enhanced the corrosion resistance of the catalyst, which is of great significance for maintaining the electrochemical activity.12 Although the conductivity of TiN is good, it does not meet the high conductivity requirements for a catalyst support.13,14 Therefore, the development of a TiN@C support that combines the excellent corrosion resistance and SMSI of TiN with the superior conductivity of carbon is of great significance for improving ORR catalyst durability.
In this study, we investigated TiN@C as a highly durable catalyst support for PEMFCs. The core–shell TiN@C support, which consists of TiN coated with a porous carbon layer, was synthesized using a simple one-step method from commercial TiO2 NPs and guanidine hydrochloride (GuHCl) as precursors. We verified the high conductivity of TiN@C using the four-probe method. Rotating disk electrode tests showed that compared with Pt/C whose support is Vulcan XC-72, Pt loaded on TiN@C showed less corrosion at 1.2 V (vs. RHE). Based on X-ray photoelectron spectroscopy (XPS) and density functional theory (DFT) calculations, the excellent durability arises from the strong interaction between Pt and N in TiN.
TiN@C-supported Pt NPs were synthesized using a simple one-step method, as shown in Fig. 1. TiO2 is a common precursor for the carbothermal synthesis of TiN, and GuHCl is a common and cheap source of N and C. The N and C released from GuHCl at high temperature formed a porous carbon layer on the surface of the TiN NPs, which were nitrogenized from TiO2, to form the porous carbon-coated TiN@C support. Pt obtained by ethylene glycol (EG) reducing H2PtCl6 was uniformly loaded on the surface of TiN@C, and the Pt/TiN@C catalyst was finally synthesized via a microwave-EG method. The Pt load of the catalyst was determined by inductively coupled plasma-optical emission spectrometry to be 9.05 wt%.
Fig. S1† shows the X-ray diffraction patterns of the TiN@C support and Pt/TiN@C catalyst. The diffraction peaks at 2θ values of 36.82°, 42.77°, 62.08°, 74.41°, and 78.43° correspond the (111), (200), (220), (311), and (222) crystal planes of face-centered cubic (fcc) TiN, respectively (PDF#87-0628).15 The diffraction peaks at 2θ = 39.76°, 46.24°, 67.45°, and 81.29° correspond to the (111), (200), (220), and (311) planes of crystalline Pt, respectively (PDF#04-0802), demonstrating the presence of Pt in Pt/TiN, Pt/TiN@C, and Pt/C.16 The relatively weak peak around 24° indicates the presence of a small amount of carbon in the TiN@C samples.17
Fig. 2 presents a typical transmission electron microscopy (TEM) image of the synthesized TiN@C support and Pt/TiN@C catalyst. The particles of TiN@C in the TEM image are ellipsoidal with an average size of 29.05 ± 6.28 nm in Fig. 2a. Based on the high-resolution TEM image shown in Fig. 2b, the crystal plane spacing of the core component was 0.211 nm, corresponding to the (200) plane of TiN (PDF#87-0628). This indicates that TiO2 transformed into TiN at high temperature. The surface layer of the TiN NP was coated with a thin and ununiform carbon layer as shown in the energy-dispersive X-ray spectroscopy (EDS) diagram line scan in which the position of C peak and Ti peak were different, Fig. 2c. The thickness of the coating layer reached approximately 1 nm, and the number of coating layers reached 3–4 with a crystal plane spacing of 0.365 nm. Overall, the particles have core–shell microstructures with TiN as the core and the carbon layer as the shell. The excellent conductivity of the support material is critical for transferring electrons for ORR at the three-phase reaction site. The carbon layer is conducive to the improvement of electrical conductivity; the resistances of Vulcan XC-72, TiN, and TiN@C were measured using a four-probe instrument to be 1.68 × 101, 4.79 × 10⁻³, and 1.25 × 101 S m−1, respectively (Fig. S2†). The presence of the surface carbon layer obviously increased the overall electrical conductivity by three orders of magnitude, which greatly increased the electrical conductivity of the TiN NPs. The particle size of the Pt NPs on the TiN@C support was limited to 2.81 ± 0.41 nm (Fig. 2d–g), which is smaller than that of commonly reported 3–5 nm.18 More interestingly, in the EDS line scan (Fig. 2h), Ti peak was closer to Pt peak than C peak. The Pt NPs were deposited at the location where the carbon layer was connected with TiN on the surface as shown in the Fig. 2i. The highly stable TiN support firmly anchored the Pt NPs, and the carbon layer connected the Pt NPs into a conductive network, which greatly improved the durability of the catalyst.
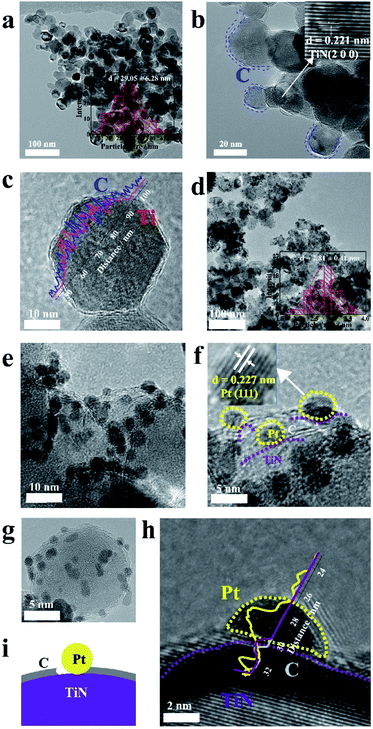 | ||
| Fig. 2 The picture of microstructure. (a)–(c) TiN@C. (d)–(h) TEM images of the Pt/TiN@C. (i) Schematic diagram of the Pt/TiN@C. | ||
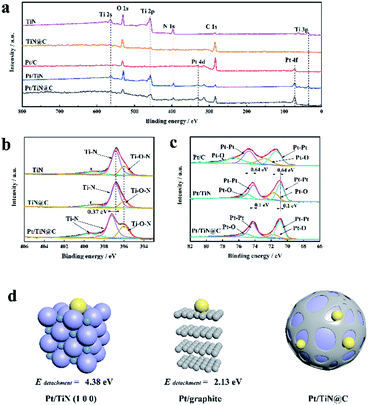
XPS can be used to analyse the elemental electronic structure of the catalyst surface.19 All peaks in this study were calibrated to the C 1s peak (284.6 eV). The full XPS spectrum of TiN@C (Fig. 3a) shows obvious peaks of Ti, C, N, and O. The existence of O also confirms that the surface of TiN was easily oxidized (Table S1†).11 Fig. 3b shows the N 1s spectra. The N 1s binding energy (BE) of the TiN and TiN@C Ti–N species are located at 399.00 and 396.85 eV, while those of Pt/TiN@C are located at 399.43 and 397.28 eV. The BE of Pt/TiN@C is offset by 0.43 eV in the direction of higher BE. The BE of the Ti–O–N N species in TiN, TiN@C, and Pt/TiN@C is located at 396.00 eV. In contrast, the BEs of the Pt 4f peaks in the Pt/TiN spectra are decreased by 0.64 eV (from 74.15 to 73.51 eV for Pt5/2 and from 71.46 to 70.82 eV Pt7/2) compared to those of the Pt/C catalyst (Fig. 3c). But because of carbon layer, the offset of Pt 4f peak of Pt/TiN@C is 0.1 eV less than Pt/TiN. These shifts in BE for TiN and Pt indicate changes to the distribution of electrons and thus the electronic structure of the catalyst surface.20 It is reported that the d-band center of TiN supported Pt is lower than that of carbon supported Pt, which proves stronger adsorption from the perspective of projected density of states PDOS.10 In other words, there is a strong interaction between Pt and TiN.21 It is worth noting that due to the Pt/TiN@C special struct in Fig. 2i, the BE of Pt loaded on TiN@C is less than that of the Pt/TiN, that is, the electronic structure and SMSI still exists. Previous study have pointed out that there is a strong interaction between Pt NPs and transition metal nitrides,22 and the smaller Pt NPs we prepared are more conducive to produce and strengthen the SMSI.23 Based on the change in BE between Pt and N, the interaction between Pt and TiN mainly originates from the interaction between Pt and N. The SMSI makes the diffusion barrier of Pt on the support surface higher. This strong interaction would result in the strong anchoring of Pt NPs, which would help prevent Ostwald ripening and keep the Pt NPs from falling off the catalyst.24
To better understand the interaction between Pt and N in the TiN@C support, DFT calculations were carried out based on slab models.25,26 A detachment energy Edetachment was defined to describe the energy required to remove the Pt atoms from the support:
| Edetachment = Esupport − EPt/support |
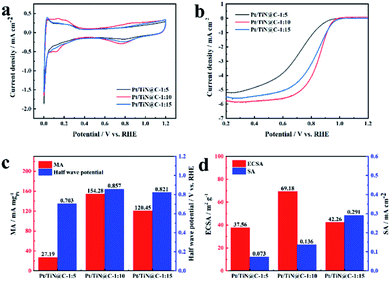
Fig. 4 shows the electrochemical test results of TiN@C supported Pt NPs with different precursor ratio. Obviously, when the ratio is 1![[thin space (1/6-em)]](https://www.rsc.org/images/entities/char_2009.gif) :
:![[thin space (1/6-em)]](https://www.rsc.org/images/entities/char_2009.gif) 10, the carbon layer shell thickness is moderate and has a good porous structure, so that Pt NPs can grow firmly at the position where the carbon layer and TiN are combined, and the sample obtains the best catalytic activity. The MA is 154.28 mA mgPt−1 and ECSA is 69.18 m2 g−1. The smaller Pt NPs are more likely to interact with the TiN@C support. At the same time, the stronger interaction between Pt NPs and support is also more conducive to controlling the smaller Pt particle size. The larger surface area exposed because smaller particle size is the main reason for the larger ECSA. Lager MA can be attributed to the influence of carbon layer morphology and thickness. When the proportion of GuHCl is relatively small, the coating carbon thickness of TiN surface is thin, which can not form a good conductive network, so poor activity. When the proportion of GuHCl is big, the carbon layer is thick and loses the porous structure, which is not conducive to the nucleation and growth of Pt NPs. The Pt NPs that lose anchoring are easy to migrate and dissolve at a high potential, resulting in the failure of the catalyst. Based on the optimal ratio of 1
10, the carbon layer shell thickness is moderate and has a good porous structure, so that Pt NPs can grow firmly at the position where the carbon layer and TiN are combined, and the sample obtains the best catalytic activity. The MA is 154.28 mA mgPt−1 and ECSA is 69.18 m2 g−1. The smaller Pt NPs are more likely to interact with the TiN@C support. At the same time, the stronger interaction between Pt NPs and support is also more conducive to controlling the smaller Pt particle size. The larger surface area exposed because smaller particle size is the main reason for the larger ECSA. Lager MA can be attributed to the influence of carbon layer morphology and thickness. When the proportion of GuHCl is relatively small, the coating carbon thickness of TiN surface is thin, which can not form a good conductive network, so poor activity. When the proportion of GuHCl is big, the carbon layer is thick and loses the porous structure, which is not conducive to the nucleation and growth of Pt NPs. The Pt NPs that lose anchoring are easy to migrate and dissolve at a high potential, resulting in the failure of the catalyst. Based on the optimal ratio of 1![[thin space (1/6-em)]](https://www.rsc.org/images/entities/char_2009.gif) :
:![[thin space (1/6-em)]](https://www.rsc.org/images/entities/char_2009.gif) 10, Fig. S3 and S4† show the linear sweep voltammetry curves of the Pt/TiN@C, Pt/TiN and Pt/C samples measured in 0.1 M O2-saturated HClO4 at a speed of 1600 rpm and the cyclic voltammetry curves in N2-saturated HClO4 at the speed of 50 mV s−1. Benefitting from the improved conductivity imparted by the carbon layer in the TiN@C support, the conductive network formed by the surface porous carbon layer effectively connects the Pt NPs anchored on the surface of TiN, resulting in a catalyst with good catalytic activity and long service life. The MA of Pt/TiN@C is far higher than that of Pt/TiN (86.65 mA mgPt−1), and the half-wave potential of Pt/TiN@C (0.857 mV) was 39 mV higher than that of Pt/TiN (0.818 mV).
10, Fig. S3 and S4† show the linear sweep voltammetry curves of the Pt/TiN@C, Pt/TiN and Pt/C samples measured in 0.1 M O2-saturated HClO4 at a speed of 1600 rpm and the cyclic voltammetry curves in N2-saturated HClO4 at the speed of 50 mV s−1. Benefitting from the improved conductivity imparted by the carbon layer in the TiN@C support, the conductive network formed by the surface porous carbon layer effectively connects the Pt NPs anchored on the surface of TiN, resulting in a catalyst with good catalytic activity and long service life. The MA of Pt/TiN@C is far higher than that of Pt/TiN (86.65 mA mgPt−1), and the half-wave potential of Pt/TiN@C (0.857 mV) was 39 mV higher than that of Pt/TiN (0.818 mV).
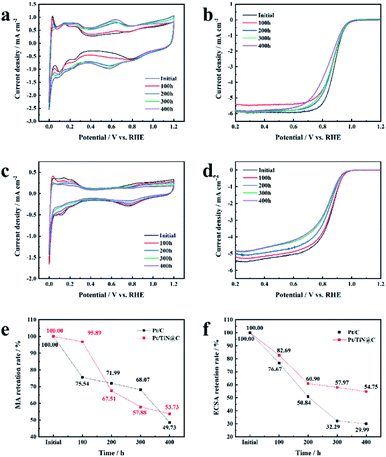
To evaluate the electrocatalytic activity and degradation performance of the prepared samples, we have carried out a series of electrochemical tests, as shown in Fig. S5† and 5.
The current–time method is a way to evaluate the corrosion resistance of a PEMFC catalyst support;27 the corrosion current indirectly represents the level of corrosion at 1.2 V (vs. RHE) and 500 rpm because, during FCV start-up and shut-down, the instantaneous maximum potential of the cathode can reach 1.2 V (vs. RHE), resulting in severe support corrosion.28 Thus, the level of corrosion at 1.2 V is of high practical significance. Although similar methods have been used to test carbon support in the previously reported work, the test time is generally short, the rotating speed is zero, and the corrosion is slow. Therefore, the support corrosion cannot be fully explored.29 However, to the best of our knowledge, no TiN/C composite materials have been tested in half cells for 400 h at 500 rpm, which mimics the practical working conditions of a PEMFC.
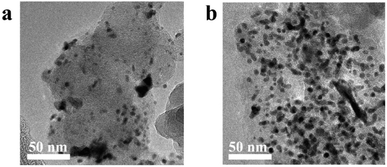
As shown in Fig. S5,† the corrosion current of Pt/C increased with time from the minimum value of 2.5 μA cm−2 to the maximum value of 5 μA cm−2, in agreement with a previous report.30 Vulcan XC-72 support surfaces are composed of carbon and oxygen-containing functional groups.30 The carbon on the surfaces of the initial carbon particles is highly graphitized, while most of the carbon in the central part is disordered carbon with a typical core–shell structure.31 The carbon particles form aggregates and agglomerate through the action of van der Waals forces.32 The Pt NPs loaded on the surface of carbon black accelerate the corrosion rate of the surface. The structurally weak aggregates of Vulcan XC-72 were corroded first, and the aggregate was broken down via neck breaking; finally the carbon layer with a high degree of graphitization was corroded.33 After the rapid corrosion of the carbon support, the adsorption interaction between the support and the Pt NPs disappeared, and the unanchored Pt NPs gradually agglomerated or even fell off on the carbon surface, resulting in the degradation of the catalyst (Fig. 6). The mass activity of Pt/C was only 49.73% of the initial value, and the ECSA decreased 70.01% (Fig. 5e and f).
TiN@C has better corrosion resistance than the carbon support of the Pt/C catalyst, so the corrosion current of Pt/TiN@C remained lower than that of Pt/C (Fig. S5†).14 In the first 100 hours, Pt/TiN@C MA activity retention rate was as high as 95.89%, much higher than that of 75.54% of Pt/C, which proved that Pt/TiN@C had stronger corrosion resistance under the high potential test in the initial stage, so the corrosion degree is lower, and the corrosion current is smaller. Though Pt/TiN@C shows better corrosion resistance than carbon black support, the carbon layer on the surface can still be corroded, resulting in the decrease of conductivity and activity of the catalyst. After the current–time test, the MA retention rate of Pt/TiN@C was 53.73%, which was higher than Pt/C 49.73%, although the initial MA was lower than that of Pt/C (Table S4†). The ECSA retention rate of Pt/TiN@C showed a downward trend, and finally reached 54.75%, which was higher than Pt/C (29.99%). Based on the SMSI between Pt and the support, TiN can effectively anchor the Pt NPs firmly on its surface, preventing the Pt NPs from falling off, agglomerating, and ripening, which slows the degradation of the catalyst, so Pt/TiN@C agglomeration of Pt NPs is not obvious as shown in Fig. 6. The results suggest that TiN@C is a promising new support material.
Conclusion
In this work, TiN@C was synthesized in one step, and a Pt/TiN@C catalyst was obtained using a microwave-EG method. The TiN@C support had a core–shell structure with TiN NPs as the core and the nanoscale carbon layer as the shell. Because of the excellent corrosion resistance of TiN, the SMSI between TiN and the Pt NPs, and the good conductivity of the porous carbon layer, the TiN@C composite exhibits good corrosion resistance and conductivity. Moreover, due to the SMSI, the Pt NPs are effectively anchored on the surface of the support, preventing the NPs from falling off, agglomerating, and ripening. These effects significantly extend the catalytic life of the catalyst and help maintain its catalytic activity, which is of great practical significance for the commercialization of FCVs.Author contributions
Hongyu Zhang contributed brought up the concept of this study and completed most of the work: investigation, experiment design and characterization methodology, data analysis and writing – original draft. Jia Liu assisted in the investigation, characterization and original draft writing. Xiao Duan carried out the software of DFT calculation and wrote relevant part. Mengchen Yuan helped the investigation and XPS characterization. Feng Cao participated in the investigation and XRD characterization. Kui Sun put forward scientific suggestions about TEM characterization methods. Yunbo Zhang proposed scientific guidance on XPS characterization methods and data analysis. Xiaolin Li gave a reasonable understanding about TEM data analysis. Ass. prof Zhengbin Gu contribute to the review & editing of original draft. Ass. Prof Jia Li and Ying Wang contributed to concept formation, writing – review & editing and gave constructive guidance to this work.Conflicts of interest
There are no conflicts of interest to declare.Acknowledgements
This work was supported by Interdisciplinary Innovation Program of North China Electric Power University.Notes and references
- O. Z. Sharaf and M. F. Orhan, Renewable Sustainable Energy Rev., 2014, 32, 810–853 CrossRef CAS
.
- L. L. Chen, X. L. Xu, W. X. Yang and J. B. Jia, Chin. Chem. Lett., 2020, 31, 626–634 CrossRef CAS
.
- K. Kodama, T. Nagai, A. Kuwaki, R. Jinnouchi and Y. Morimoto, Nat. Nanotechnol., 2021, 16, 140–147 CrossRef CAS PubMed
.
- X. J. Zhou, J. L. Qiao, L. Yang and J. J. Zhang, Adv. Energy Mater., 2014, 4, 25 Search PubMed
.
- S. Sharma and B. G. Pollet, J. Power Sources, 2012, 208, 96–119 CrossRef CAS
.
- S. Maass, F. Finsterwalder, G. Frank, R. Hartmann and C. Merten, J. Power Sources, 2008, 176, 444–451 CrossRef CAS
.
- Y. Y. Shao, J. Liu, Y. Wang and Y. H. Lin, J. Mater. Chem., 2009, 19, 46–59 RSC
.
- B. Avasarala and P. Haldar, Int. J. Hydrogen Energy, 2011, 36, 3965–3974 CrossRef CAS
.
- X. L. Tian, J. M. Luo, H. X. Nan, H. B. Zou, R. Chen, T. Shu, X. H. Li, Y. W. Li, H. Y. Song, S. J. Liao and R. R. Adzic, J. Am. Chem. Soc., 2016, 138, 1575–1583 CrossRef CAS PubMed
.
- J. A. Kwon, M. S. Kim, D. Y. Shin, J. Y. Kim and D. H. Lim, J. Ind. Eng. Chem., 2017, 49, 69–75 CrossRef CAS
.
- S. Yang, J. Kim, Y. J. Tak, A. Soon and H. Lee, Angew. Chem., Int. Ed., 2016, 55, 2058–2062 CrossRef CAS PubMed
.
- Z. C. Pan, Y. H. Xiao, Z. G. Fu, G. H. Zhan, S. K. Wu, C. M. Xiao, G. H. Hu and Z. G. Wei, J. Mater. Chem. A, 2014, 2, 13966–13975 RSC
.
- B. Avasarala, T. Murray, W. Li and P. Haldar, J. Mater. Chem., 2009, 19, 1803–1805 RSC
.
- B. Avasarala and P. Haldar, Electrochim. Acta, 2010, 55, 9024–9034 CrossRef CAS
.
- H. Kim, M. K. Cho, J. A. Kwon, Y. H. Jeong, K. J. Lee, N. Y. Kim, M. J. Kim, S. J. Yoo, J. H. Jang, H. J. Kim, S. W. Nam, D. H. Lim, E. Cho, K. Y. Lee and J. Y. Kim, Nanoscale, 2015, 7, 18429–18434 RSC
.
- F. Wang, Q. Zhang, Z. Y. Rui, J. Li and J. G. Liu, ACS Appl. Mater. Interfaces, 2020, 12, 30381–30389 CrossRef CAS PubMed
.
- J. Li, Y. J. Song, G. X. Zhang, H. Y. Liu, Y. R. Wang, S. H. Sun and X. W. Guo, Adv. Funct. Mater., 2017, 27, 1604356 CrossRef
.
- C. Li, H. Tan, J. Lin, X. Luo, S. Wang, J. You, Y.-M. Kang, Y. Bando, Y. Yamauchi and J. Kim, Nano Today, 2018, 21, 91–105 CrossRef CAS
.
- S. Liu, W. Qi, S. Adimi, H. Guo, B. Weng, J. P. Attfield and M. Yang, ACS Appl. Mater. Interfaces, 2021, 13, 7238–7247 CrossRef CAS PubMed
.
- C. Jackson, G. T. Smith, D. W. Inwood, A. S. Leach, P. S. Whalley, M. Callisti, T. Polcar, A. E. Russell, P. Levecque and D. Kramer, Nat. Commun., 2017, 8, 15802 CrossRef CAS PubMed
.
- G. T. Song, Y. Wang, Y. Qi, W. M. Li and L. X. Zhang, Rare Met., 2020, 39, 784–791 CrossRef CAS
.
- C. Huang, S. Adimi, D. Liu, H. Guo, T. Thomas, J. P. Attfield, S. Ruan, F. Qu and M. Yang, J. Mater. Chem. A, 2021, 9, 19840–19846 RSC
.
- Z. Wu, Y. Li and W. Huang, J. Phys. Chem. Lett., 2020, 11, 4603–4607 CrossRef CAS PubMed
.
- R. A. M. Esfahani, I. I. Ebralidze, S. Specchia and E. B. Easton, J. Mater. Chem. A, 2018, 6, 14805–14815 RSC
.
- J. Engel, S. Francis and A. Roldan, Phys. Chem. Chem. Phys., 2019, 21, 19011–19025 RSC
.
- R. Q. Zhang, T. H. Lee, B. D. Yu, C. Stampfl and A. Soon, Phys. Chem. Chem. Phys., 2012, 14, 16552–16557 RSC
.
- W. Zhu, J. P. Zheng, R. Liang, B. Wang, C. Zhang, G. Au and E. J. Plichta, J. Electrochem. Soc., 2009, 156, B1099 CrossRef CAS
.
- F. Memioğlu, A. Bayrakçeken, T. Öznülüer and M. Ak, Int. J. Energy Res., 2014, 38, 1278–1287 CrossRef
.
- X. Wang, W. Li, Z. Chen, M. Waje and Y. Yan, J. Power Sources, 2006, 158, 154–159 CrossRef CAS
.
- K. H. Kangasniemi, D. A. Condit and T. D. Jarvi, J. Electrochem. Soc., 2004, 151, E125–E132 CrossRef CAS
.
- P. E. Fanning and M. A. Vannice, Carbon, 1993, 31, 721–730 CrossRef CAS
.
- Z. Y. Liu, J. L. Zhang, P. T. Yu, J. X. Zhang, R. Makharia, K. L. More and E. A. Stach, J. Electrochem. Soc., 2010, 157, B906 CrossRef CAS
.
- P. T. Yu, Z. Liu and R. Makharia, J. Electrochem. Soc., 2013, 160, F645–F650 CrossRef CAS
.
Footnote |
| † Electronic supplementary information (ESI) available. See https://doi.org/10.1039/d2ra02569h |
| This journal is © The Royal Society of Chemistry 2022 |


