 Open Access Article
CQDs/ZnO composites based on waste rice noodles: preparation and photocatalytic capability†
Xin-Yan Jin,
Wan-Ying Ying,
Rui-Jie Che,
Ping Xiao,
Yu-Qing Zhou,
Yan Liu,
Meng-Yu Liu and
Shuo-Ping Chen *
*
College of Materials Science and Engineering, Guilin University of Technology, Guilin 541004, China. E-mail: chenshuoping_777@163.com
First published on 19th August 2022
Abstract
To provide a low-cost photocatalyst and new methodology for the utilization of waste rice noodle (WRN), a carbon quantum dots/zinc oxide (CQDs/ZnO) composite using WRN as the raw material was synthesized and characterized. The CQDs/ZnO composite based on WRN exhibited a highly efficient photocatalytic degradation effect on various organic pollutants and could be a good alternative for commercial ZnO. For methylene blue, the CQDs/ZnO composite showed a good degradation rate of 99.58% within 40 min, a high degradation rate constant of 0.2630 min−1, and could be recycled and reused for ten photocatalytic cycles without an appreciable decrease in the degradation effect, which was much better than that of commercial ZnO. The resulting CQDs/ZnO composite also displayed a nice photocatalytic degradation effect on other common organic pollutants, such as malachite green, methyl violet, basic fuchsin, rhodamine B, aniline and tetracycline. In particular, it could achieve excellent photocatalytic degradation on malachite green with an extremely high degradation rate constant of 1.9260 min−1. Besides, the CQDs/ZnO composite could also be used to control the pollution of tetracycline or aniline. The introduction of CQDs based on WRN to ZnO resulted in efficient electron–hole pair separation and enabled more photogenerated electrons to reduce O2 and more photogenerated holes to oxidize H2O, which caused stronger abilities in producing radicals (such as O2˙− and ˙OH) and a better photocatalytic degradation effect to organic pollutants.
1 Introduction
Water pollution has become an increasingly important problem that can cause serious harm to human health and affect the quality of life.1,2 Among the various technologies for wastewater treatment, photocatalytic decontamination with nano semiconductor particles has proved to be an effective and simple technology. Zinc oxide (ZnO) is a potential photocatalyst for wastewater treatment and has attracted widespread attention.3–6 Compared with other nano semiconductor photocatalysts (such as TiO2,7–9 ZnS,10,11 CdS12 and Fe2O3 (ref. 13)), nano ZnO has many advantages such as relatively high quantum efficiency, good biocompatibility and low cost.14 However, pure ZnO has a large band gap whose photogenerated electrons and holes are easy to recombine.14,15 It also shows poor absorption and utilization rate in the visible light region, which limits its application in practical wastewater treatment.16,17Recent studies show that combining carbon quantum dots (CQDs) can be an efficient strategy to overcome the disadvantage of pure ZnO.18–25 Generally, CQDs can enhance the photocatalytic activity of ZnO from three aspects: First, CQDs can be used alongside ZnO as an electron sink, which suppresses electron–hole recombination and generates electron–hole pairs more effectively.19 Second, the broad spectral absorption and high absorption coefficient of CQDs can fully utilize the visible light region and finally enhance the photocatalytic activity.19,20 Third, introducing CQDs may enhance the adsorption capacity to organic pollutants and gain from the photocatalytic process.21 Until now, the CQDs in the CQDs/ZnO composites reported so far were synthesized using glucose,3 sucrose,22 fructose,23 ascorbic acids,19,20 sodium citrate,24 graphite rods,25 peach juice21 or coffee grounds15 as carbon sources. However, due to the large market demand for photocatalysts, CQDs for constructing the CQDs/ZnO composite should be synthesized using low-cost carbon sources, preferably the waste.26
Cooking waste can cause potential pollution to the soil and water environment, thus providing a significant challenge to urban governance.27 Nowadays, commercial treatments for cooking waste mainly include anaerobic digestion,28,29 aerobic composting,30 landfill,31,32 incineration29 and forage making.33 Although cooking waste can be treated through the above strategies with large-scale industrialization, there are some fatal shortcomings, such as the mass occupation of land, high investment for equipment, low product profit margin, and easy production of secondary pollution like greenhouse gases and waste leachates.32
The rice noodle is a traditional daily diet of the local people in Guilin, a city of China. Thus, a large amount of waste rice noodles (WRN) is produced with an output of over 70 tons per day, which has brought tremendous pressure to the environment of the city.34–36 Therefore, it is necessary to explore an effective way to recycle WRN. Starch is the main organic component in WRN, which is easy to carbonize under hydrothermal conditions and potentially prepare functional carbon materials. Our previous results suggested that the hydrothermal carbonization of WRN could provide functional carbon materials such as activated carbon, fluorescent carbon quantum dots (CQDs) and CQDs/inorganic oxide composite.26 Among them, the CQDs/inorganic oxide composite based on WRN can serve as a photocatalyst for water pollution control with high adding value. For example, the CQDs/TiO2 composite based on WRN shows a good photocatalytic degradation effect on various water-soluble dyes under visible light irradiation, and displays better photocatalytic performance than commercial TiO2.26
Compared to TiO2 with an indirect bandgap, ZnO with a direct bandgap can be more efficient at using longwave ultraviolet light and shows higher exciton binding energy, electron mobility and quantum efficiency.37 Thus, it is expected that a combination of ZnO and WRN-based CQDs can afford a low-cost photocatalyst with better photodegradation performance and a new strategy for WRN utilization. Hence, we designed and synthesized a new CQDs/ZnO photocatalytic composite, in which CQDs were obtained from the hydrothermal carbonization of WRN. The photodegradation performance to common and organic pollutants, such as water-soluble dyes, aniline, and tetracycline, as well as the photocatalytic mechanism of the as-prepared CQDs/ZnO composite were also investigated and are discussed in this paper.
2 Experimental section
2.1 Materials
The waste rice noodle (WRN, main organic constituent: starch 21.36 g/100 g; protein 1.91 g/100 g; fat 0.4 g/100 g) was collected from the canteen of the Guilin University of Technology in Guilin, China. The nano ZnO (99.9% purity), methylene blue (98.5% purity), malachite green (98% purity), methyl violet (98% purity), basic fuchsin (98% purity), rhodamine B (98% purity), aniline (99.9% purity), tetracycline hydrochloride (98% purity), ethylenediaminetetraacetic acid disodium salt (EDTA–2Na, 98% purity), 2-propanol (IPA, 99% purity), 1,4-benzoquinone (BQ, 98% purity) and dimethyl pyridine N-oxide (DMPO, 99% purity) were all purchased from Macklin Reagent (Shanghai, China) without further purification.2.2 Synthesis
The CQDs solution was prepared by hydrothermal treatment of WRN in accordance with our previous work.26 In a typical synthesis, 100 g WRN was ground to a smooth paste in a mortar and mixed with 200 g deionized water. The mixture was heated in a 500 mL sealed Teflon-lined autoclave (Kemi Instrument, Anhui, China) at 200 °C for 10 h. The CQDs solution was collected by filtering as a kind of brown solution.After that, 200 mL of the resulting CQDs solution was directly mixed with a given dosage of ZnO powder and stirred at room temperature for 0.5 h to obtain a uniform suspension. The reaction mixture was then transferred to an oven and kept at 85 °C for 3 h. After that, the resulting solid was sent to a tubular furnace protected by nitrogen and activated at 600 °C for 1 h. The CQDs/ZnO composite was obtained as a kind of dark brown powder. The synthesis recipe of the CQDs/ZnO composite is shown in Table 1.
| Serial number | Dosage of ZnO (g) | Elemental analysis (wt%) | ||
|---|---|---|---|---|
| Zn | O | C | ||
| CQDs/ZnO-1 | 1.25 | 63.14 | 16.32 | 20.54 |
| CQDs/ZnO-2 | 2.5 | 70.12 | 17.59 | 12.29 |
| CQDs/ZnO-3 | 5 | 73.78 | 19.13 | 7.09 |
| CQDs/ZnO-4 | 7.5 | 75.61 | 19.27 | 5.12 |
| CQDs/ZnO-5 | 10 | 76.64 | 19.65 | 3.71 |
2.3 General characterization
The morphology and EDS elemental analysis of the CQDs/ZnO composite were characterized using a JEM-2100F field emission transmission electron microscope (TEM, JEOL, Akishima, Tokyo, Japan) with an accelerating voltage of 200 kV. The powder X-ray diffraction (PXRD) patterns were obtained with an X'pert PRO X-ray diffractometer (Panalytical, Malvern, Worcestershire, UK) with Cu Kα radiation (λ = 0.15418 Å) at 40 kV and 40 mA and a scan speed of 5° min−1 (2θ). The resulting products' infrared (IR) spectra were recorded as KBr pellets at a range of 400–4000 cm−1 on a Nicolet 5700 FT-IR spectrometer (Thermo Fisher, Waltham, MA, USA) with a spectral resolution of 4.00 cm−1. The determination of the points of zero charge (PZC) of the resulting samples was carried out as follows:26 10 mL of 0.01 mol L−1 NaCl solution was placed in a closed centrifugal tube. The pH was adjusted to a value between 2 and 11 by adding HCl or NaOH solutions. Then, a 0.05 g sample was added, and the final pH was measured after 10 h under agitation at a sample. The point of zero charges (PZC) was obtained from the intersection of the pH final vs. pH initial curve of the test sample and the blank sample. The X-ray photoelectron spectroscopy (XPS) of the CQDs/ZnO composite and commercial ZnO was carried out with an ESCALAB 250Xi X-ray photoelectron spectrometer (Thermo Fisher, Waltham, MA, USA) with an Al Kα X-ray as the stimulating source.The UV-vis absorption spectra of the CQDs/ZnO composite, CQDs and commercial ZnO were measured by a UV3100 UV-vis-NIR spectrophotometer (Shimadzu, Chiyoda, Tokyo, Japan) in diffuse reflection mode using BaSO4 as reference. The photoluminescence spectra of the CQDs/ZnO composite and commercial ZnO were examined with a Cary Eclipse fluorescence spectrophotometer (Varian, Palo Alto, CA, USA) with a xenon lamp as the excitation source in the range of 350 to 650 nm and an excitation wavelength of 325 nm. The electrochemical properties for the CQDs/ZnO composite and commercial ZnO were investigated in a three-electrode system with a platinum network counter electrode and an Ag/AgCl (saturated KCl) reference electrode, using a concentration of 0.1 mol L−1 Na2SO4 aqueous electrolyte at 25 °C. The transient photocurrent response was performed on an electrochemical analyzer using 0.5 V bias voltage under light irradiation with a 300 W Xe lamp as the light source. The BET-specific surface results of the CQDs/ZnO composite and commercial ZnO were characterized by using a TriStar II 3020 surface area analyzer (Micromeritics, Atlanta, GA, USA) under a nitrogen atmosphere with an initial temperature of 150 °C and a heating rate of 10 °C s−1.
The impacts of the active species such as the superoxide radical (O2˙−), hydroxyl radical (˙OH) and photogenerated hole (h+) in the photocatalytic reaction process were investigated by adding different scavengers, in which 2-propanol (IPA), 1,4-benzoquinone (BQ, 98% purity) and ethylenediaminetetraacetic acid disodium salt (EDTA–2Na) were used to probe ˙OH, O2˙− and h+, respectively. This method was identical to the preceding photocatalytic activity test with the addition of 1 mmol of scavenger. The radical production abilities of the CQDs/ZnO composite and commercial ZnO were investigated by electron spin resonance (ESR) with an EMXplus X-band electron paramagnetic resonance spectrometer (Bruker, Karlsruhe, Baden-Württemberg, Germany) using dimethyl pyridine N-oxide (DMPO) as the spin trapping agent.
2.4 Measurement of photocatalytic performance
The photocatalytic degradation experiments for organic pollutants were performed under visible light irradiation. First, the CQDs/ZnO composite with a dosage of 2 g L−1 was dispersed into an aqueous solution containing organic pollutants with an initial concentration of 20 mg L−1 with magnetic stirring at 25 °C in the dark for 30 min. It was then placed under a 20 W 405 nm purple light lamp with an illuminance of 8 × 10⁴ Lux, which could emit a kind of purple light in the wavelength range of 340–450 nm (see Fig. S1 in ESI†). Such samples were prepared for several repeat experiments. After a certain period, one of the samples was taken out and centrifugated. The concentrations of the organic pollutants in the samples were measured by UV-vis spectrophotometry using a UV3100 UV-vis-NIR spectrophotometer (Shimadzu, Chiyoda, Tokyo, Japan). The testing wavelengths were as follows: 664 nm (methylene blue), 618 nm (malachite green), 582 nm (methyl violet), 543 nm (basic fuchsin), 554 nm (rhodamine B), 230 nm (aniline) and 267 nm (tetracycline hydrochloride). The photocatalytic degradation of organic pollutants was measured with the value of C/C0. Each of the photocatalytic degradation results presented in this paper represented the average measurement of three samples having the same composition.The photocatalytic kinetics can be described by the Langmuir–Hinshelwood mode, in which the integral form is:
 | (1) |
At a low initial concentration of organic pollutant, the second term in eqn (1) becomes insignificant, and hence it can be neglected. Thus, the kinetic fitting of the photocatalytic degradation in this paper used the following equation:
 | (2) |
3 Results and discussion
3.1 Structural characterization
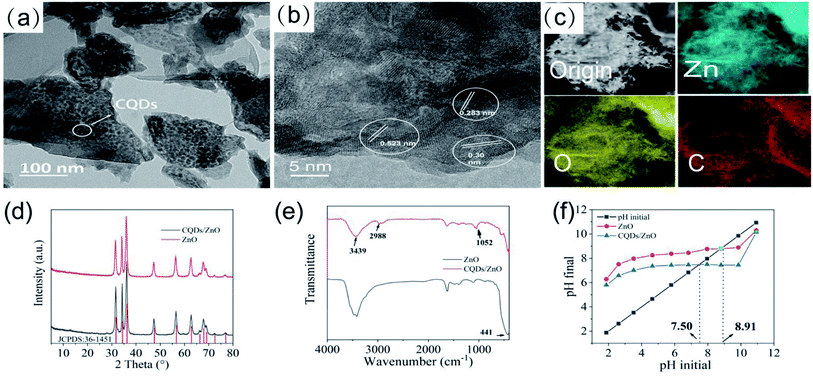
The TEM analysis results of the CQDs/ZnO composite (CQDs/ZnO-2 sample) are given in Fig. 1a–c. As shown in Fig. 1a, the CQDs/ZnO composite presented an irregular sheet structure, and spherical particles of CQDs were evenly dispersed on the surface of ZnO. The HRTEM image displayed both the lattice interleaving of nano ZnO and CQDs, in which the lattice stripes with a spacing of 0.523 nm and 0.30 nm belonged to the (204) and (110) crystal planes of ZnO, respectively. Meanwhile, a crystal plane with a lattice spacing of about 0.283 nm could be observed, which corresponded to the (020) crystal plane of CQDs (See Fig. 1b). In addition, the elemental mapping showed that the CQDs were relatively evenly distributed on the surface of ZnO, which resulted in a carbon content of 12.29 wt% in the composite (see Fig. 1c).As shown in Fig. 1d, the PXRD patterns of the CQDs/ZnO composite and commercial ZnO powder were similar, while the diffraction peaks of CQDs in the composite could not be observed obviously due to the relatively low content. The diffraction peaks at 31.73°, 34.36°, 36.21°, 47.47°, 56.53°, 62.75° and 67.85° could be attributable to wurtzite ZnO (JCPDS card no. 36-1451). On the other hand, the IR spectra of the CQDs/ZnO composite showed that the strong Zn–O vibration bands of commercial ZnO at 441 cm−1 had an obvious red shift and narrowing after combination, which might be due to the reaction between the carboxyl group in CQDs and hydroxyl group on the surface of ZnO. The characteristic absorption peaks of CQDs, including the stretching vibration of the O–H bonds (3439 cm−1), C–H bonds (2988 cm−1) and C–O bonds (1052 cm−1), were also observed (see Fig. 1e). In addition, due to the organic groups in CQDs, the point of zero charge (PZC) value of the CQDs/ZnO composite (7.50) is lower than that of commercial ZnO (8.91, see Fig. 1f).
The XPS results of the CQDs/ZnO composite and commercial ZnO are given in Fig. 2 and Table 2. As shown in Fig. 2a, the XPS spectra of the CQDs/ZnO composite showed the existence of Zn, O and C elements. The characteristic peaks in the Zn 2p spectrum at 1044.42 and 1021.30 eV belonged to the signals of Zn (2p1/2) and Zn (2p3/2), respectively (see Fig. 2b and Table 2). In the high-resolution spectrum of O 1s, the CQDs/ZnO composite showed the existence of Zn–O and C–O bonds, whose characteristic signals were located at 530.34 and 531.81 eV, respectively. By contrast, the O 1s spectrum of commercial ZnO displayed two characteristic peaks located at 529.61 and 531.31 eV, which could be assigned to the Zn–O bond and the surface hydroxyl group of ZnO, respectively. Combined with the IR results, it could be presumed that the complex reaction of CQDs and ZnO was actually the reaction between the carboxyl group in CQDs and the hydroxyl group on the surface of ZnO, which resulted in the disappearance of the signal of the surface hydroxyl group and the appearance of the signal of the C–O bond (see Fig. 2c and Table 2). Besides, in the C 1s high-resolution spectrum of the CQDs/ZnO composite, the characteristic peak at 284.21 eV could be attributed to the C–C bond in CQDs, while the characteristic signals centered at 285.78 and 288.55 eV were related to the C–O bond and C![[double bond, length as m-dash]](https://www.rsc.org/images/entities/char_e001.gif) C bond of CQDs, respectively (see Fig. 2d and Table 2). Thus, it was clear that the CQDs and ZnO were successfully combined in the resulting composite.
C bond of CQDs, respectively (see Fig. 2d and Table 2). Thus, it was clear that the CQDs and ZnO were successfully combined in the resulting composite.
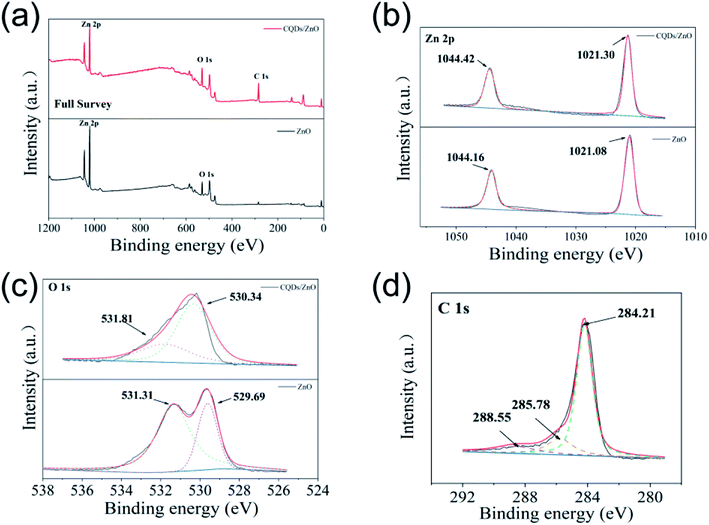 | ||
| Fig. 2 (a–c) The full XPS (a), Zn 2p (b) and O 1s (c) high-resolution spectra of the CQDs/ZnO composite and commercial ZnO. (d) The C 1s high-resolution spectrum of the CQDs/ZnO composite. | ||
| Photocatalyst | Element | Peak (eV) | Surface group | Assignment |
|---|---|---|---|---|
| CQDs/ZnO composite | Zn 2p | 1044.42 | Zn | Zn (2p1/2) |
| 1021.30 | Zn | Zn (2p3/2) | ||
| O 1s | 530.34 | Zn–O | Oxygen bonded to zinc | |
| 531.81 | C–O | Oxygen singly bonded to CQDs | ||
| C 1s | 284.21 | C | Graphitic carbon | |
| 285.78 | C–O | Alcoholic or etheric structure in CQDs | ||
| 288.55 | C![[double bond, length as m-dash]](https://www.rsc.org/images/entities/char_e001.gif) C C |
π-Electrons in aromatic ring of CQDs | ||
| Commercial ZnO | Zn 2p | 1044.16 | Zn | Zn (2p1/2) |
| 1021.08 | Zn | Zn (2p3/2) | ||
| O 1s | 529.61 | Zn–O | Oxygen bonded to zinc | |
| 531.31 | Zn–OH | Surface hydroxyl group of ZnO |
3.2 Photocatalytic performance
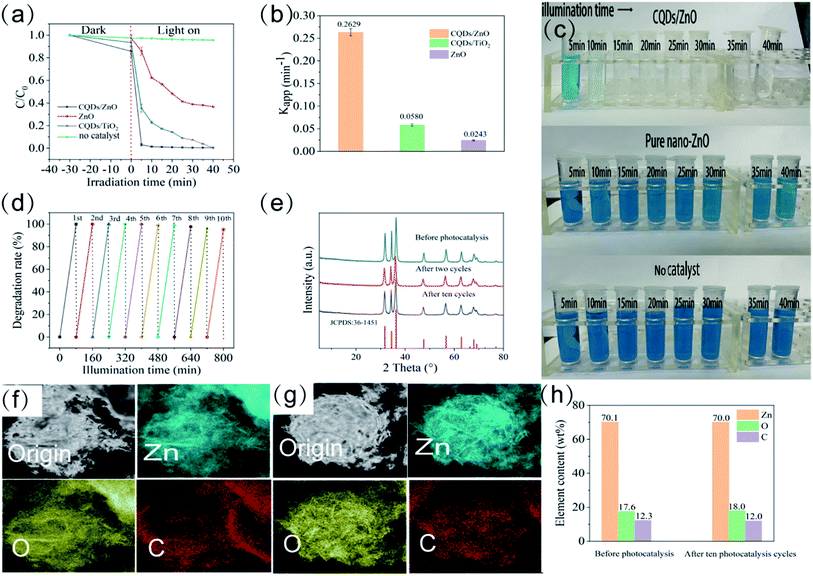
The resulting CQDs/ZnO composite displayed a high photocatalytic degradation efficiency on various organic pollutants. Taking methylene blue as an example, as one of the most common pollutants in dyeing waste water with considerable toxicity, methylene blue was difficult to degrade under 405 nm visible purple light.38 As shown in Fig. 3a–c, after 40 min of illumination without photocatalyst, the degradation rate of methylene blue was only 2.75%. The commercial ZnO had a photocatalytic effect on methylene blue, but could not achieve complete degradation with a degradation rate of 62.57% within 40 min and a low degradation rate constant (Kapp) of 0.0243 min−1. By contrast, the CQDs/ZnO composite based on WRN had a much better photocatalytic performance. The degradation rate of the CQDs/ZnO-2 sample could be as high as 96.92% within 5 min, 98.88% within 10 min, and 99.58% within 40 min. It also displayed a high degradation rate constant of 0.2630 min−1, which was almost 11 times as large as that of commercial ZnO. The degradation effect of the synthesized CQDs/ZnO composite was even better than that of the CQDs/TiO2 composite previously reported26 in the same photocatalytic condition. The degradation rate (63.84% within 5 min, 76.75% within 10 min and 99.57% within 40 min) and degradation rate constant (0.0580 min−1) of the CQDs/TiO2 composite both underperformed compared with those of CQDs/ZnO composite. This indicated that, compared with TiO2, ZnO could be a better base material for producing a photocatalytic composite based on WRN.Moreover, the CQDs/ZnO composite had good catalytic stability, which could be recycled and reused without appreciable degradation rate decrease. As shown in Fig. 3d, it could maintain a degradation rate of more than 95% after ten photocatalytic cycles. The CQDs/ZnO composite could maintain structural stability and composition during the photocatalytic process. The PXRD patterns of the CQDs/ZnO composite before and after the photocatalytic cycle were almost the same (see Fig. 3e). The EDS mapping showed that, after ten photocatalytic cycles, the CQDs could still be evenly distributed on the surface of ZnO in the CQDs/ZnO composite. At the same time, its carbon content maintained 11.95 wt%, which did not cause obvious loss compared with the original sample (see Fig. 3f–h).
As shown in Fig. 4, within the low range of CQDs dosage, the photocatalytic degradation efficiency of the CQDs/ZnO composite was slightly enhanced with the increase of the carbon content. The CQDs/ZnO composite with about 12 wt% carbon content (CQDs/ZnO-2 sample) displayed a maximal degradation rate constant of 0.2630 min−1. However, further treatment with CQDs dosage resulted in a significant decrease to the degradation effect. The CQDs/ZnO-1 sample with a carbon content of 20.5 wt% displayed a much lower degradation rate constant of 0.1024 min−1, which might be attributed to the shielding effect of the carbon-based materials.25
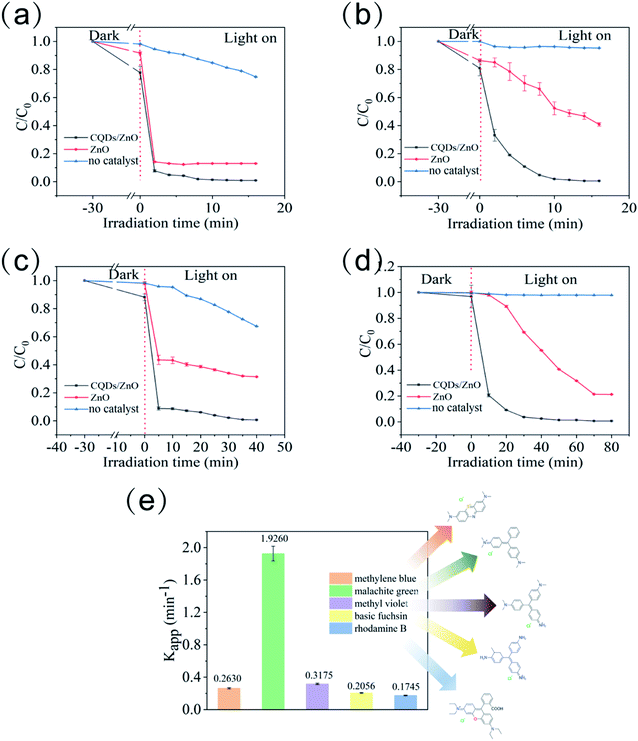
The resulted CQDs/ZnO composite also displayed a highly efficient photocatalytic degradation effect on other common water-soluble dyes such as malachite green, methyl violet, basic fuchsin, and rhodamine B under visible light irradiation, and showed better photocatalytic performance than commercial ZnO (see Fig. 5a–d). It was also observed that the photocatalytic degradation effect of the CQDs/ZnO composite could be affected by the molecular structure of the organic dyes, especially the mother nucleus structure and substituent group (see Fig. 5g). An organic dye with a triphenylmethane structure and dimethylamino group, such as malachite green, showed the maximal degradation rate constant (1.9260 min−1) among the five organic dyes. By contrast, the phenothiazine dye containing the dimethylamino group, like methylene blue, displayed relatively low degradation rate constants (0.2630 min−1), which indicated that the resulting CQDs/ZnO composite displayed an extremely high photocatalytic degradation effect on triphenylmethane dyes. On the other hand, it seemed that the dimethylamino group could benefit from the photocatalytic degradation compared with other substituent groups like amino or carboxyl group. For example, as another kind of triphenylmethane dyes, methyl violet, which had a similar structure to malachite green but an additional amino group, displayed a lower degradation rate constant (0.3175 min−1) than malachite green. The basic fuchsin had three amino groups but no dimethylamino group in its molecule, whose degradation rate constant was even lower (0.2055 min−1). Rhodamine B contained a triphenylmethane structure and carboxyl group, and also showed a relatively lower degradation rate constant (0.1745 min−1).
Apart from organic dyes, the CQDs/ZnO composite could also be used to control antibiotic residues.37 Taking tetracycline as an example, the CQDs/ZnO composite could degrade 98.21% of the tetracycline within 10 min under 405 nm purple light, while the degradation rate of commercial ZnO in the same condition was only 32.94% (see Fig. 6a). On the other hand, the CQDs/ZnO composite could also eliminate aniline efficiently, which is very stable in water and easily leads to widespread and persistent water pollution.39,40 The commercial ZnO displayed a weak photocatalytic effect on aniline with a degradation rate of 39.47% within 80 min, while the CQDs/ZnO composite could eliminate 48.80% and 99.90% of the aniline within 10 min and 80 min, respectively (See Fig. 6b).
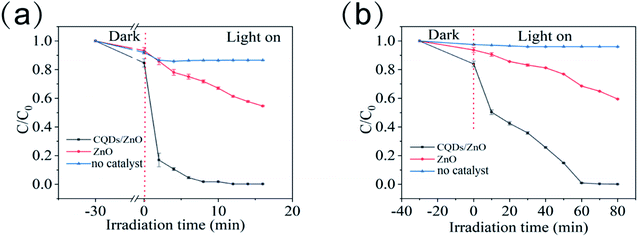 | ||
| Fig. 6 The photocatalytic degradation rate of the CQDs/ZnO composite and commercial ZnO to tetracycline (a) and aniline (b) within different irradiation times under 405 nm purple light. | ||
It is also notable that compared with other CQDs/ZnO composites for the elimination of dye (see Table 3), the CQDs/ZnO composite based on WRN showed a much better photocatalytic degradation effect than other CQDs/ZnO composites using natural carbon source or waste (like peach juice or coffee ground), which could achieve almost 100% photodegradation within a very short irradiation time. Compared to the CQDs/ZnO composites containing CQDs synthesized from saccharides or hydroxycarboxylic acids, the CQDs/ZnO composite based on WRN still displayed high photocatalytic degradation efficiency and lower cost, which was beneficial to large-scale water pollutant treatment.
| Carbon source of CQDs | Light source | Pollutant | Pollutant concentration (mg L−1) | Photocatalyst dosage (g L−1) | Irradiation times (min) | Degradation rate (%) | Reference |
|---|---|---|---|---|---|---|---|
| Glucose | Halogen lamp (500 W) | Methylene blue | 10 | 0.1 | 30 | 96 | 3 |
| Sucrose | Halogen lamp with a filter (500 W, wavelength > 420 nm) | Rhodamine B | 10 | 0.1 | 60 | 98 | 19 |
| D-Fructose | Xenon lamp (wavelength > 420 nm) | Rhodamine B | 2.3 | 1.5 × 10⁻⁴ | 105 | 94 | 20 |
| L-Ascorbic acid | Osram lamp (400 W) | Methylene blue | 50 | 1 | 120 | 87 | 21 |
| L-Ascorbic acid | Blended mercury lamp (250 W) | Methylene blue | 30 | 1 | 120 | 100 | 22 |
| Sodium citrate | Xenon lamp (300 W) | Methylene blue | 10 | 0.1 | 60 | 98 | 23 |
| Coffee grounds | UVB lamp (6 W, wavelength: 360 nm) | Methylene blue | 5 | 0.25 | 150 | 80 | 15 |
| Peach juice | UV lamp | Methylene blue | 20 | 2 | 60 | 95 | 25 |
| Graphite rods | Xenon lamp (18 mW cm−2) | Tetracycline | 10 | 0.5 | 30 | 100 | 24 |
| WRN | Purple light lamp (20 W, wavelength: 405 nm) | Methylene blue | 20 | 2 | 10 | 98.88 | This work |
| Tetracycline | 20 | 2 | 10 | 98.21 | |||
| Malachite green | 20 | 2 | 10 | 98.66 | |||
| Methyl violet | 20 | 2 | 10 | 98.11 | |||
| Basic fuchsin | 20 | 2 | 40 | 99.39 | |||
| Rhodamine B | 20 | 2 | 80 | 99.33 | |||
| Aniline | 20 | 2 | 80 | 99.90 |
3.3 Photocatalytic mechanism
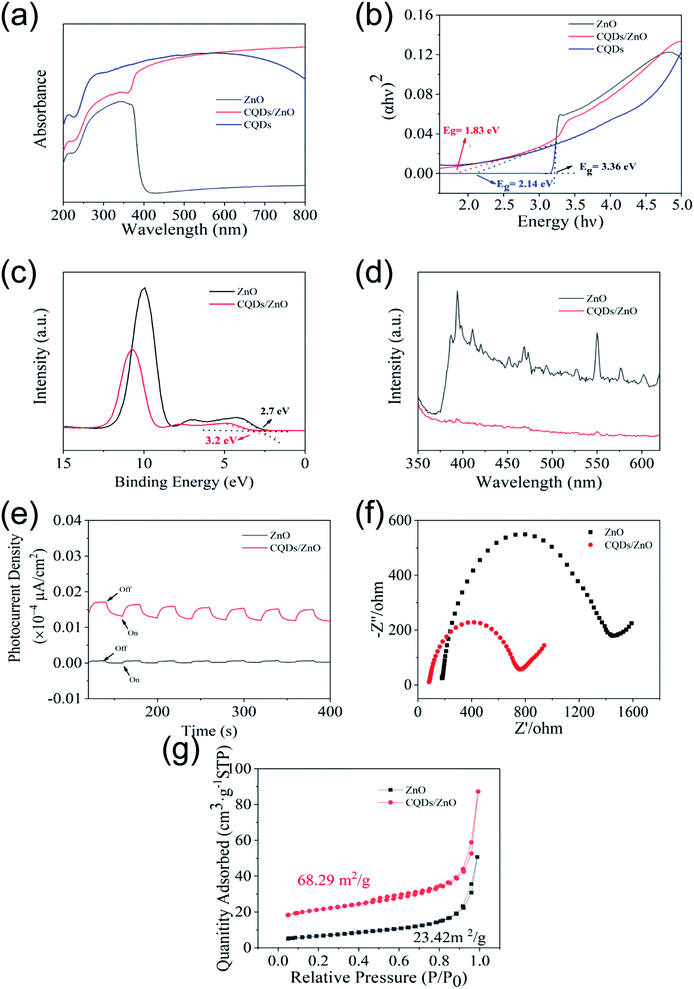
In order to further examine the photocatalytic mechanism of the as-prepared CQDs/ZnO composite based on WRN, the UV-vis absorption spectra of commercial ZnO, CQDs and CQDs/ZnO composite were tested and are shown in Fig. 7a. The absorption of the commercial ZnO was mainly in the UV region, and there was almost no absorption in the visible light region (wavelength > 400 nm). In contrast, due to the good visible light absorption of CQDs, the CQDs/ZnO composite exhibited a wide visible light absorption region whose light-absorption intensity in the visible light region was much stronger than that of commercial ZnO. Thus, the combination of CQDs and ZnO could effectively enhance the energy absorption and produce more electron–hole pairs under visible light irradiation. Furthermore, the band gaps of the commercial ZnO and CQDs/ZnO samples were calculated by means of Kubelka–Munk theory and are shown in Fig. 7b. The band gap of the commercial ZnO photocatalyst was about 3.36 eV. By comparison, the introduction of CQDs could afford a narrower band gap of 1.83 eV, promoting the electronic transition and improving the photocatalytic degradation process. The valence band (VB) potentials of commercial ZnO and CQDs/ZnO were determined by using XPS valence spectra (see Fig. 7c), which indicated that the maximum energy edge of the VB of ZnO and CQDs/ZnO composite were about 2.7 eV and 3.2 eV, respectively. For commercial ZnO, its VB value (2.7 eV) was more positive than E0(˙OH, H+/H2O) (2.38 eV vs. NHE). Furthermore, its conduction band (CB) potential (ECB = EVB − Eg) could reach −0.66 eV and was more negative than E0(O2/O2˙−) (−0.33 eV vs. NHE). This suggested that the photogenerated holes of commercial ZnO can oxidize OH− to yield hydroxyl radical (˙OH), and reduce O2 to generate superoxide radical (O2˙−). For the CQDs/ZnO composite, the VB value in the ZnO part (3.2 eV) was more positive than E0(˙OH, H+/H2O), while the CB value in the CQDs part (−0.47 eV) was more negative than E0(O2/O2˙−). Therefore, the as-prepared CQDs/ZnO composite could also form O2˙− and ˙OH radicals simultaneously under visible light irradiation.On the other hand, the steady-state PL spectra of the commercial ZnO and CQDs/ZnO composite (Fig. 7d) showed that the emission intensity of the CQDs/ZnO composite was much lower than that of commercial ZnO at similar emission, which suggested that the modification of CQDs could effectively reduce the recombination of electron–hole pairs. This feature of the CQDs/ZnO composite was also proven by the photocurrent response with the on/off cycles of visible light irradiation (Fig. 7e). It could be observed that the CQDs/ZnO electrode displayed a much higher photocurrent (more than 6 times) in comparison to the commercial ZnO electrode upon irradiation. This means that a faster interfacial charge transfer to the electron acceptor occurred in the CQDs/ZnO composite, which resulted in the more effective separation of electron–hole pairs. In the Nyquist plot of the electrochemical impedance spectra (EIS) (Fig. 7f), the CQDs/ZnO composite showed a smaller diameter of the semicircle than commercial ZnO, which suggested that the CQDs/ZnO composite had a lower charge transfer resistance than commercial ZnO. This was consistent with the results of PL and photocurrent analysis. In addition, as shown in Fig. 7g, due to the combination of CQDs, the CQDs/ZnO composite displayed an enhanced BET surface area (68.29 m2 g−1) compared to commercial ZnO (23.42 m2 g−1). This enhanced the adsorption to various organic pollutants, and was also beneficial to the enhanced photocatalytic activity of the CQDs/ZnO composite.
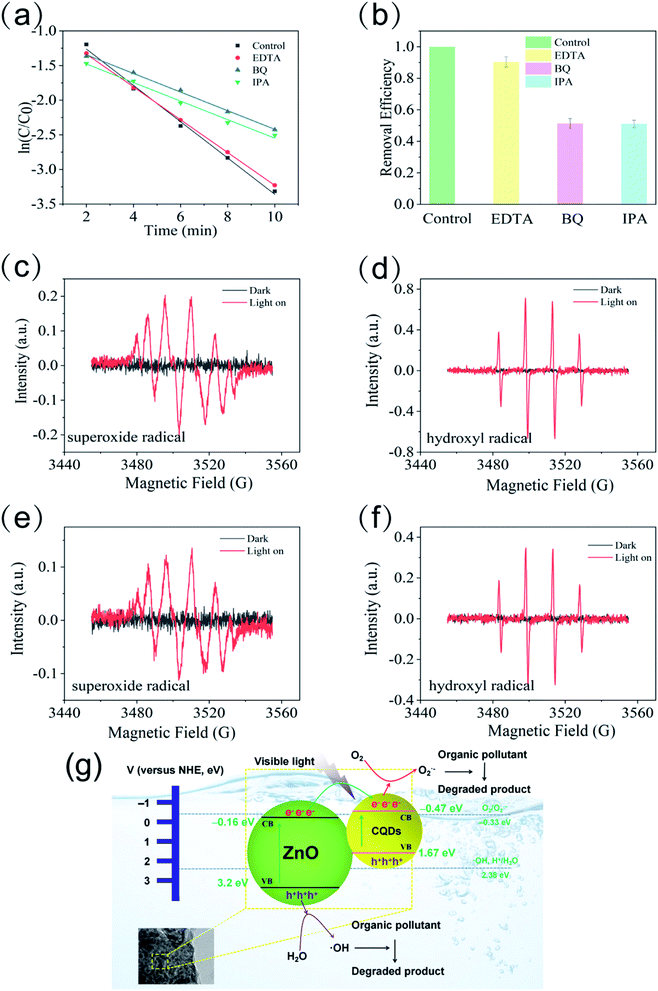
The effects of different scavengers (EDTA–2Na, BQ, IBA) on methylene blue photodegradation are shown in Fig. 8a and b. The photocatalytic degradation efficiency did not dramatically decrease and maintained 90.4% after adding EDTA–2Na, which indicated that the photogenerated hole (h+) was negligible in the photocatalytic process. By contrast, introducing either IPA or BQ could result in the significant inhibition of the degradation efficiency, with a much lower removal rate of 51.2% and 51.1%, respectively. This suggested that the superoxide radical (O2˙−) and hydroxyl radical (˙OH) were both the main active species in the photocatalytic degradation process. The electron spin resonance (ESR) with the DMPO technique was also used to investigate the reactive oxygen species generated by the CQDs/ZnO composite and commercial ZnO photocatalysts. As shown in Fig. 8c–f, obvious characteristic peaks of both O2˙− and ˙OH radical of DMPO were observed by using both the CQDs/ZnO composite and commercial ZnO as a photocatalyst, which suggested that both CQDs/ZnO composite and ZnO could reduce adsorbed O2 to form the O2˙− radical and oxidize the adsorbed H2O or OH− to form the ˙OH radical under light radiation. Moreover, compared with using commercial ZnO as a photocatalyst, both O2˙− and ˙OH radical signals of DMPO with the CQDs/ZnO composite were evidently stronger. Thus, the CQDs/ZnO composite displayed stronger abilities in producing O2˙− and ˙OH radical than commercial ZnO on the same test condition, which demonstrates that the introduction of CQDs could result in efficient electron–hole pair separation and enable more photogenerated electrons to reduce O2 and more photogenerated holes to oxidize H2O. Based on the above results, a possible photocatalytic mechanism schematic is illustrated in Fig. 8e. When the CQDs/ZnO composite is irradiated by visible light, the CQDs can be easily excited with photogenerated electrons on the conduction band (CB) and leave the holes on the valence band (VB). The excited electrons could spatially transfer between CQDs and ZnO quickly and result in a more efficient electron–hole pair separation. Finally, the electrons accumulated in the CB of CQDs and the holes in the VB of ZnO participate in the reduction and oxidation photocatalysis reactions, respectively. The photogenerated hole could react with H2O to produce more ˙OH, and the separated electrons on the CQDs could react with O2 to produce more O2˙−. The generated O2˙− and ˙OH radical could degrade various organic pollutants and effectively cause excellent photocatalytic activity.
4 Conclusions
In this paper, low-cost CQDs/ZnO composite was synthesized and characterized using waste rice noodle (WRN) as the raw material. The CQDs/ZnO composite based on WRN exhibited a highly efficient photocatalytic degradation effect on various organic pollutants, such as water-soluble dyes (including methylene blue, malachite green, methyl violet, basic fuchsin, and rhodamine B), aniline, and tetracycline under visible light irradiation, which showed better photocatalytic performance than commercial ZnO. The introduction of CQDs based on WRN to ZnO could result in efficient electron–hole pair separation, and enable more photogenerated electrons to reduce O2 and more photogenerated holes to oxidize H2O. This can result in stronger abilities to produce O2˙− and ˙OH radical and better photocatalytic activity.Due to the very low cost of CQDs based on WRN, the CQDs/ZnO composite based on WRN can achieve much better photocatalytic degradation efficiency than commercial ZnO without raising production costs. On the other hand, since the raw material (WRN) comes from a kind of local daily diet, the CQDs based on WRN can achieve a stable supply of raw materials and the resulting CQDs/ZnO composite has a high value for large-scale industrialization. Thus, the CQDs/ZnO composite can be a good substitute for commercial ZnO and have good application in large-scale water pollutant treatment. In addition, compared to other recycling methods for catering waste, the conversion strategy of WRN to the CQDs/ZnO composite can realize higher added value, which suggests broad prospects for industrialization and may provide a new method for the recycling of cooking waste.
Author contributions
Conceptualization, methodology & writing (original draft preparation): Xin-Yan Jin; software: Yan Liu; investigation: Rui-Jie Che, Wan-Ying Ying, Ping Xiao; resources: Meng-Yu Liu; formal analysis: Rui-Jie Che; data curation: Yu-Qing Zhou; writing (review and editing), project administration, funding acquisition & supervision: Shuo-Ping Chen. All authors have read and agreed to the published version of the manuscript.Conflicts of interest
There are no conflicts to declare.Acknowledgements
This work was supported by grants from the National Nature Science Foundation of China (No. 51763007), Guangxi Natural Science Foundation Program (No. 2015GXNSFBA139033), and the Sharing Foundation of Guangxi Key Laboratory of Optical and Electronic Materials and Devices (No. 20 AA-9).Notes and references
- A. Phuruangrat, S. Siri, P. Wadbua, S. Thongtem and T. Thongtem, J. Phys. Chem. Solids, 2019, 126, 170–177 CrossRef CAS.
- M. Arunpandian, K. Selvakumar, A. Raja, P. Rajasekaran, M. Thiruppathi, E. R. Nagarajan and S. Arunachalam, Colloids Surf., A, 2019, 567, 213–227 CrossRef CAS.
- A. Velumani, P. Sengodan, P. Arumugam, R. Rajendran, S. Santhanam and M. Palanisamy, Curr. Appl. Phys., 2020, 20, 1176–1184 CrossRef.
- R. Saravanan, M. M. Khan, V. K. Gupta, E. Mosquera, F. Gracia, V. Narayanan and A. Stephen, J. Colloid Interface Sci., 2015, 452, 126–133 CrossRef CAS PubMed.
- S. Goktas and A. Goktas, J. Alloys Compd., 2021, 863, 158734 CrossRef CAS.
- C. Han, M. Q. Yang, B. Weng and Y. J. Xu, Phys. Chem. Chem. Phys., 2014, 16, 16891–16903 RSC.
- X. Chen, L. Liu and F. Huang, Chem. Soc. Rev., 2015, 44, 1861–1885 RSC.
- R. Singh and S. Dutta, Fuel, 2018, 220, 607–620 CrossRef CAS.
- H. Zangeneh, A. A. L. Zinatizadeh, M. Habibi, M. Akia and M. H. Isa, J. Ind. Eng. Chem., 2015, 26, 1–36 CrossRef CAS.
- G.-J. Lee and J. J. Wu, Powder Technol., 2017, 318, 8–22 CrossRef CAS.
- L. Zheng, F. Teng, X. Ye, H. Zheng and X. Fang, Adv. Energy Mater., 2019, 10, 1902355 CrossRef.
- Y.-J. Yuan, D. Chen, Z.-T. Yu and Z.-G. Zou, J. Mater. Chem. A, 2018, 6, 11606–11630 RSC.
- M. Tahir, S. Tasleem and B. Tahir, Int. J. Hydrogen Energy, 2020, 45, 15985–16038 CrossRef CAS.
- G. Poongodi, P. Anandan, R. M. Kumar and R. Jayavel, Spectrochim. Acta, Part A, 2015, 148, 237–243 CrossRef CAS PubMed.
- B. Abebe, H. C. A. Murthy and E. Amare, Environ. Nanotechnol., Monit. Manage., 2020, 14, 100336 Search PubMed.
- F. Chen, C. Yu, L. Wei, Q. Fan, F. Ma, J. Zeng, J. Yi, K. Yang and H. Ji, Sci. Total Environ., 2020, 706, 136026 CrossRef CAS PubMed.
- M. Samadi, M. Zirak, A. Naseri, E. Khorashadizade and A. Z. Moshfegh, Thin Solid Films, 2016, 605, 2–19 CrossRef CAS.
- M. Rahal, Y. Atassi and I. Alghoraibi, Mater. Chem. Phys., 2022, 286, 126123 CrossRef CAS.
- R. Behnood and G. Sodeifian, J. Environ. Chem. Eng., 2020, 8, 2861–2866 Search PubMed.
- G. Sodeifian and R. Behnood, J. Inorg. Organomet. Polym. Mater., 2019, 30, 1266–1280 CrossRef.
- R. Atchudan, T. N. J. I. Edison, S. Perumal, N. Karthik, D. Karthikeyan, M. Shanmugam and Y. R. Lee, J. Photochem. Photobiol., A, 2018, 350, 75–85 CrossRef CAS.
- X. Zhang, J. Pan, C. Zhu, Y. Sheng, Z. Yan, Y. Wang and B. Feng, J. Mater. Sci.: Mater. Electron., 2015, 26, 2861–2866 CrossRef CAS.
- H. Bozetine, Q. Wang, A. Barras, M. Li, T. Hadjersi, S. Szunerits and R. Boukherroub, J. Colloid Interface Sci., 2016, 465, 286–294 CrossRef CAS PubMed.
- S. Song, K. Wu, H. Wu, J. Guo and L. Zhang, RSC Adv., 2019, 9, 7362–7374 RSC.
- F. Guo, W. Shi, W. Guan, H. Huang and Y. Liu, Sep. Purif. Technol., 2017, 173, 295–303 CrossRef CAS.
- X. Jin, R. Che, J. Yang, Y. Liu, X. Chen, Y. Jiang, J. Liang, S. Chen and H. Su, Nanomaterials, 2022, 12, 472 CrossRef CAS PubMed.
- Z. Chu, X. Fan, W. Wang and W. C. Huang, J. Waste Manag., 2019, 84, 119–128 CrossRef CAS PubMed.
- J. D. Murphy and N. M. Power, J. Environ. Sci. Health, Part A: Toxic/Hazard. Subst. Environ. Eng., 2006, 41, 865–879 CrossRef CAS PubMed.
- B. Xiao, Y. Qin, W. Zhang, J. Wu, H. Qiang, J. Liu and Y. Y. Li, Bioresour. Technol., 2018, 249, 826–834 CrossRef CAS PubMed.
- Z. Chen, Y. Li, C. Ye, X. He and S. Zhang, Sci. Total Environ., 2021, 784, 146950 CrossRef CAS PubMed.
- A. Shehzad, M. J. K. Bashir, S. Sethupathi and J.-W. Lim, Process Saf. Environ. Prot., 2015, 98, 309–318 CrossRef CAS.
- N. Touze-Foltz, H. Xie and G. Stoltz, Geotext. Geomembr., 2021, 49, 475–488 CrossRef.
- W. Y. Mo, W. M. Choi, K. Y. Man and M. H. Wong, Sci. Total Environ., 2020, 707, 134954 CrossRef CAS PubMed.
- D. De Clercq, Z. Wen, F. Fan and L. Caicedo, Renew. Sustain. Energy Rev., 2016, 59, 1676–1685 CrossRef.
- B. Li, T. Yin, I. A. Udugama, S. L. Dong, W. Yu, Y. F. Huang and B. Young, J. Clean. Prod., 2020, 252, 119909 CrossRef CAS.
- Y. Luo, D. Huang and F. Cao, Sustainability, 2022, 14, 2678 CrossRef.
- M. S. Al Ja'farawy, Kusumandari, A. Purwanto and H. Widiyandari, Environ. Nanotechnol., Monit. Manage., 2022, 18, 100681 Search PubMed.
- F. van Bebber, D. Paquet, A. Hruscha, B. Schmid and C. Haass, Neurobiol. Dis., 2010, 39, 265–271 CrossRef CAS PubMed.
- F. Di Girolamo, L. Campanella, R. Samperi and A. Bachi, Ecotoxicol. Environ. Saf., 2009, 72, 1601–1608 CrossRef CAS PubMed.
- M. Mohammed, L. P. Mekala, S. Chintalapati and V. R. Chintalapati, J. Hazard. Mater., 2020, 385, 121571 CrossRef CAS PubMed.
Footnote |
| † Electronic supplementary information (ESI) available: Including the degradation rate of CQDs/ZnO composite with different carbon content to methylene blue, the pseudo-first-order kinetic fitting of photocatalytic degradation of CQDs/ZnO composite, and the nitrogen adsorption/desorption isotherms of pure ZnO and CQDs/ZnO composite. See https://doi.org/10.1039/d2ra03709b |
| This journal is © The Royal Society of Chemistry 2022 |

