 Open Access Article
Structural elucidation of hexavalent Cr adsorbed on surfaces and bulks of Fe3O4 and α-FeOOH†
Nichapha Senamarta,
Krittanun Deekamwongb,
Jatuporn Wittayakun b,
Sanchai Prayoonpokarach
 b,
Narong Chanlekc,
Yingyot Poo-arpornc,
Suttipong Wannapaiboonc,
Pinit Kidkhunthod
 c and
Sirinuch Loiha
 *a
*a
aCenter for Innovation in Chemistry (PERCH-CIC), Materials Chemistry Research Center, Department of Chemistry, Faculty of Science, Khon Kaen University, Khon Kaen 40002, Thailand. E-mail: sirilo@kku.ac.th
bSchool of Chemistry, Institute of Science, Suranaree University of Technology, Nakhon Ratchasima, 30000, Thailand
cSynchrotron Light Research Institute, Nakhon Ratchasima 30000, Thailand
First published on 8th September 2022
Abstract
Magnetite (Fe3O4) and goethite (α-FeOOH) were synthesized via a hydrothermal approach and utilized as adsorbents for Cr6+ removal in an aqueous medium. The typical crystal structures of the synthesized Fe3O4 and α-FeOOH were confirmed by XRD and TEM. Fe3O4 in a spherical shape with a surface area of 32 m2 g−1 was established. While α-FeOOH had a rod-like form with a larger surface area of 84 m2 g−1. Cr6+ removal in an aqueous solution was studied in various conditions to evaluate thermodynamic and kinetic parameters. The adsorption isotherms on both adsorbents fit the Langmuir model indicating monolayer adsorption. Fe3O4 showed a better adsorption ability than α-FeOOH even though it had a lower surface area. XAS and XPS analysis strongly evidenced the production of stable Cr3+ species of Fe(1−x)CrxOOH and Fe(3−x)CrxO4 by Cr6+ reduction and migration processes into the bulk structure. Thus, the existence of stable Cr-species in Fe3O4 structure strongly affected Cr-adsorption ability rather than the surface area of the adsorbent. However, the precipitated Cr2O3 and HCrO4− molecules electrostatically adsorbed on the outer surface of α-FeOOH without bulk transformation. The presence of physisorbed FeO–HCrO4 species on α-FeOOH led to low reducibility and adsorption capability of Cr6+.
Introduction
Hexavalent Cr6+ ions are toxic contaminants because of their mutagenicity, carcinogenicity, and teratogenicity.1–5 Toxic Cr6+ species generally exist in negatively charged forms, such as the ions of hydrogen chromate (HCrO4−), chromate (CrO42−), and dichromate (Cr2O72−), depending on solution pH and concentration.6,7 However, no conclusive spectroscopic proof of structural changes in adsorbents and adsorbates is available.8,9 X-Ray absorption spectroscopy (XAS) is a powerful tool for the element-specific characterization of local structure and chemistry. The electronic and local structures or geometry of chromium species in water will be explored. Understanding the stabilized Cr-species on the adsorbents is beneficial to the development of new materials from the waste treatment process. Wei et al.10 illustrated the determination of Cr-contamination in kitchen wastewater by XAS. The Cr-species distribution in the solution was estimated. Likewise, Meena and Arai11 could explore the Cr3+/Cr6+ ratio and Cr-structures on Fe3O4 through the Cr-adsorption process from groundwater by using X-ray absorption near edge structure (XANES) and extended X-ray absorption fine structure (EXAFS) analysis.Different techniques, such as chemical precipitation, adsorption, photocatalysis, and reduction using cationic materials, are available for the removal of Cr6+ from wastewater.7,12–16 Utilization of natural-cationic materials, such as activated carbon, chitosan, chelate resins, and natural zeolites for Cr6+ adsorption has been widely investigated due to their low cost, feasibility, handling simplicity, and flexibility.17–20 However, the removal of the adsorbed Cr6+ species by those adsorbents still needs a further reduction process to complete the Cr disposal.
Chemical reduction using environment-friendly materials, such as iron oxides, is an interesting alternative method for Cr6+ removal from wastewater.21,22 Iron (oxy) hydroxide of goethite (α-FeOOH) containing Fe3+ is a potential Cr6+ adsorbent due to its high surface area and thermal stability.7,23 Moreover, octahedral sites of Fe3+ in orthorhombic α-FeOOH structure play a significant role in Cr6+ adsorption. In addition, the presence of a small amount of Fe2+ species on the α-FeOOH surface provides a great reduction potential for Cr6+ ions.24 However, a drawback of polymorphs of the synthetic α-FeOOH formed in acidic conditions leads to an additional protonation, resulting in structure destabilization.7,25,26 Hence, the preparation of a stable α-FeOOH structure with uniform crystalline needs to be investigated. Additionally, the metal oxide of Fe3O4 (magnetite) or ferrous-ferric iron oxide nature is interesting for Cr6+ removal because it has a suitable redox potential for Cr6+ reduction and excellent magnetic properties.27,28 It is widely known that Fe2+ in magnetite can reduce Cr6+ to Cr3+ creating Cr3+-hydroxide or mixed substances via an adsorption and reduction process, namely reductive precipitation.29,30 This adsorption behavior on the Fe3O4 surface was explored and Cr3+ and Fe3+-(oxy)hydroxides were passivated on the adsorbent surface.30 The adsorption ability and structural stability of Fe3O4 are strongly affected by solution pH and the homogeneity of iron oxide particles. The effect of the passivation layer on bulk structure deserves our study. In addition, the relationship between adsorption ability and phase stability in bulk-iron oxides needs to be investigated. Understanding the stable Cr-forms on the ion-oxides is promising for catalyst applications.31
In the present study, iron oxides of Fe3O4 and α-FeOOH were synthesized by the hydrothermal method and used as Cr6+ adsorbents. The crystalline structure, morphology, and surface area of the bare and adsorbed materials were characterized. The Cr-adsorption ability and behavior were explored. The adsorbent surfaces and bulk structures were elucidated by XPS and XAS.
Experimental
Materials and methods
Synthetic procedures
where C0 (mg L−1) and Ce (mg L−1) are the initial and equilibrium metal concentrations, respectively, V (L) is the solution volume, and W (g) is the adsorbent weight.
Adsorption isotherms were detected by the Langmuir (eqn (1)) Freundlich (eqn (2) and (3)), Dubinin–Radusckevisch–Kanager (eqn (4)–(6)) and Temkin (eqn (7)) models.36
 | (1) |
| qe = KfCe1/n, | (2) |
 | (3) |
ln![[thin space (1/6-em)]](https://www.rsc.org/images/entities/char_2009.gif) qe = ln qe = ln![[thin space (1/6-em)]](https://www.rsc.org/images/entities/char_2009.gif) q(D–R)(−βε2), q(D–R)(−βε2),
| (4) |
 | (5) |
 | (6) |
qe = k1![[thin space (1/6-em)]](https://www.rsc.org/images/entities/char_2009.gif) ln(k2) + k1 ln(k2) + k1![[thin space (1/6-em)]](https://www.rsc.org/images/entities/char_2009.gif) ln ln![[thin space (1/6-em)]](https://www.rsc.org/images/entities/char_2009.gif) Ce, Ce,
| (7) |
The adsorption thermodynamics of α-FeOOH and Fe3O4 was determined at the temperatures of 25 °C, 40 °C and 60 °C using 1 ppm Cr6+ solution and 0.02 g of each adsorbent. The effects of different initial Cr6+ concentrations (1–20 ppm), adsorbent doses (0.02–0.1 g), and contact times (10–90 min) in the Cr adsorption efficiency were investigated. The optimization of pH for Cr6+ removal was conducted in the range of 1–7, which covers the point of zero charges (PZC) of both absorbents.
The stability and adsorption behavior of Cr species on adsorbent surfaces were investigated by performing a reusability test. Each adsorbent was separated from the solution and dried overnight at 50 °C before starting a new cycle.
Results and discussion
Structures of α-FeOOH and Fe3O4
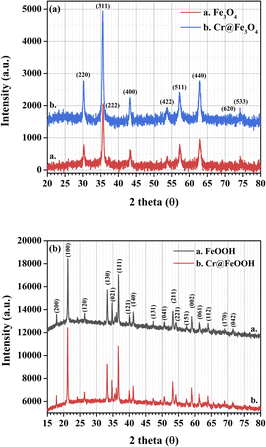
The crystal structures of as-synthesized and Cr-adsorbed Fe3O4 and α-FeOOH were determined by XRD as shown in Fig. 1a and b, respectively. The XRD pattern of α-FeOOH indicated its orthorhombic structure. The lattice constants of α-FeOOH structure were calculated as a = 4.611 Å, b = 9.962 Å, c = 3.024 Å (JCPDS no. 29-0713).37,38 The diffraction pattern of Fe3O4 indicated its cubic structure (JCPDS no. 19-0629)28,39 with a lattice constant of a = b = c = 8.364 Å. The phase indexing and the refined unit cell parameters were reported in ESI data S1† and their corresponding XRD refinement in S2–S5.† Specifically, the Fe3O4 and Cr@Fe3O4 samples were indexed as magnetite Fe3O4 phase (cubic, space group Fd![[3 with combining macron]](https://www.rsc.org/images/entities/char_0033_0304.gif) m), while the α-FeOOH and Cr@FeOOH samples were indexed as iron (III) oxide hydroxide goethite phase (orthorhombic, space group Pbnm).
m), while the α-FeOOH and Cr@FeOOH samples were indexed as iron (III) oxide hydroxide goethite phase (orthorhombic, space group Pbnm).
A closer inspection of the refinement results, the addition of chromium species into the materials led to a slight shrinkage of the unit cell parameters compared to the pristine materials. This observation suggested the incorporation of Cr3+ into the material matrix of Fe3O4 (or FeOOH) without the presence of an additional crystalline impurity phase. In these cases, the atomic site occupancy could not be precisely defined. In addition, XAS was used to propose the local structures of Cr and Fe species in the obtained materials.
The TEM images and lattice parameters of α-FeOOH and Fe3O4 are displayed in Fig. 2. The α-FeOOH exhibited short-range-order and rod-like structures (Fig. 2a). The selected area electron diffraction (SAED) pattern of rod-like particles confirmed the orthorhombic structure of α-FeOOH with the (130) and (061) characteristic planes. Its particle size was in the range of 620 (±219) × 55 (±21) nm as shown in S6.† The TEM image of Fe3O4 in Fig. 2b revealed spherical particles of 400 ± 124 nm with characteristic planes of (311) and (422).33 The BET surface areas of α-FeOOH and Fe3O4 were 84 m2 g−1 and 32 m2 g−1, respectively. The larger particle size of Fe3O4 led to a lower surface area.
Cr-adsorption ability
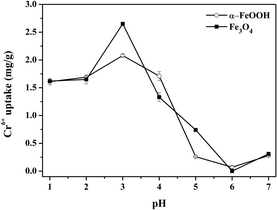 | ||
| Fig. 3 Effect of pH on Cr6+ uptake by the Fe3O4 and α-FeOOH adsorption condition: Cr6+ initial concentration = 1 ppm, adsorbent dose = 0.4 g L−1, time = 30 min. | ||
Fe3O4 had a higher Cr-adsorption ability than α-FeOOH, indicating its stronger attraction to the negative compounds of Cr6+. Thus, pH = 3 was selected as the optimized value to reach the maximum capacity of the adsorbents. The maximum Cr6+ uptakes by α-FeOOH and Fe3O4 were determined as about 2.08 mg g−1 and 2.87 mg g−1, respectively. In addition, the effects of adsorbent dose, initial concentration and contact time of Cr-adsorption were discussed in S8–S10.†
Adsorption behavior of Fe3O4 and α-FeOOH
The thermodynamic parameters of α-FeOOH and Fe3O4 are listed in S14.† Gibb's free energy changes (ΔG°) for both adsorbents had negative values, confirming a spontaneous nature of adsorption.34 An α-FeOOH had a negative standard enthalpy change (ΔH°) implying an exothermic process.47 α-FeOOH had a negative entropy change (ΔS°) indicating the decreased randomness at the solid/solution interface.48 In contrast, Fe3O4 showed an endothermic process from a positive ΔH° value indicating that an ion-exchange on the adsorbent surface might occur.49 The positive ΔS° of Fe3O4 implied randomness at the solid–solution interface during the adsorption process due to adsorption and subsequent desorption.48
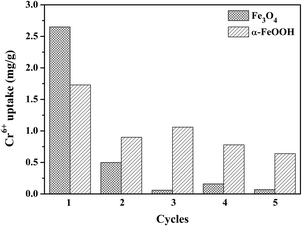
The reusability of both adsorbents for five cycles is shown in Fig. 4 to support the thermodynamic hypothesis of α-FeOOH and Fe3O4. Different adsorption behaviors of the adsorbents were exhibited. The Cr6+ uptake of Fe3O4 dramatically decreased (90–95%) in the subsequent cycles. On the other hand, the Cr6+ uptake of α-FeOOH slowly decreased by 55–60% in the subsequent cycles. These results implied that the Fe3O4 surface was completely adsorbed by Cr-species and it was difficult to detach from the surface. In contrast, the α-FeOOH surface was weakly adsorbed by the adsorbent due to a weak interaction (physisorption) which probably detached from the surface.
Analysis of the adsorbed species on adsorbents
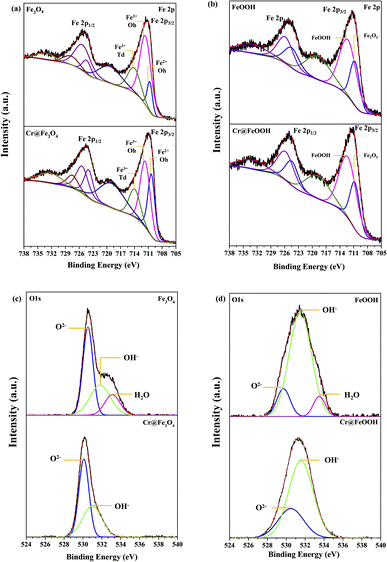 | ||
| Fig. 5 Fe 2p XPS spectra before and after Cr6+ adsorption of (a) Fe3O4 and (b) α-FeOOH and O 1s spectra before and after Cr6+ adsorption of (c) Fe3O4 and (d) α-FeOOH. | ||
The O 1s peaks of pristine Fe3O4 at 530.5 eV, 531.8 eV, and 533.1 eV appeared from lattice oxygen (O2−lattice), oxygen in the adsorbed-hydroxyl group (OHads), and oxygen in water-adsorbed molecules (H2Oads), respectively (Fig. 5c and d). After Cr adsorption, the binding energies of O2−lattice and OHads slightly decreased to 530.1 eV and 530.9 eV, respectively, indicating a presence of O2−lattice in CrO(OH) over the Fe3O4 surface.51–53 The results exhibited a partial ion-exchange Cr3+ in Fe3+ sites which well corresponded to the decrease of Fe3+Oh constituent as mentioned in the Fe 2p energy. Moreover, no peak corresponding to water-adsorbed species on Cr@Fe3O4 was determined because Cr-adsorbed species fully covered the Fe3O4 surface. The O 1s peaks of α-FeOOH at 530.5, 530.5 and 531.5 eV corresponded to O2−lattice, OHads and adsorbed H2O species, respectively. The adsorbed H2O was not determined on Cr@FeOOH. In addition, the binding energy of O2−lattice in Cr@FeOOH was slightly higher than that in α-FeOOH. These results possibly indicate the presence of precipitate oxide form of Cr2O3 on the α-FeOOH surface.
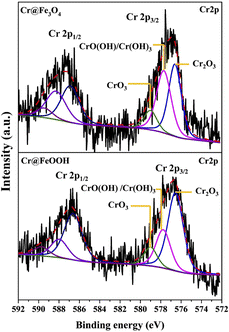
The binding energies of Cr 2p3/2 and Cr 2p1/2 in Cr@Fe3O4 and Cr@α-FeOOH are shown in Fig. 6. The Cr 2p3/2 to Cr 2p1/2 splitting energies of both samples were about 10 eV which was typically found in a Cr3+/Cr6+ mixture.54 The Cr 2p3/2 exhibited the characteristics of Cr3+ in Cr2O3 (576.6 eV), CrO(OH)/Cr(OH)3 (577.7 eV) and Cr6+ in CrO3 (579.9 eV).7,42,44,50–54 Those characters were similarly found in Cr@Fe3O4 and Cr@FeOOH. However, the area ratio of Cr2O3/CrO(OH) in Cr@FeOOH was higher than that in Cr@Fe3O4. The finding correlated with the enhancement of O2−lattice species of Cr@FeOOH in O 1s spectrum. This result revealed the presence of precipitated Cr2O3 species on the α-FeOOH surface at pH 3.55 It was noticeable that a high CrO(OH) content in Cr@Fe3O4 might proceed through Cr3+ migration on the Fe3O4 surface.
Bulk analysis of α-FeOOH and Fe3O4 by XAS
 | ||
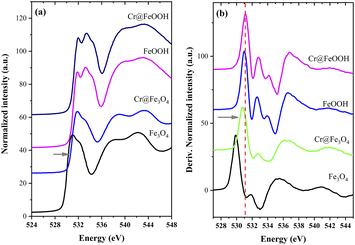
| Fig. 7 Fe K-edge XANES spectra of bare and Cr-adsorbed (a) Fe3O4 and (b) α-FeOOH and (c) Fe L3-edge XANES spectra of Cr@Fe3O4 and Cr@FeOOH comparing with the iron standards. | ||
In principle, Fe L3-edge has a better resolution for fine structures and manifests a lower intrinsic lifetime broadening than Fe K-edge. Thus, the local geometry of Fe3O4 was further investigated by Fe L3-edge. The spectra of Fe3O4 and Cr@Fe3O4 are presented in Fig. 7c. The Ia/Ib intensity ratio in the Fe L3-edge spectrum was used to determine the mixed valence state.56 The Cr@Fe3O4 had Ia/Ib ratio of 0.59 which was higher than that of pristine Fe3O4 (0.53). The higher Ia/Ib intensity ratio corresponded to the lower Fe2+ content in the tetrahedral site of Fe3O4.56
EXAFS analysis of Fe and Cr K-edge
| Sample | Bond | Distance (Å) | Coordination number (CN) | Debye–Waller factor (σ2) |
|---|---|---|---|---|
| Fe3O4 | Fe–O | 1.61 | 3.9 | 0.054 |
| Fe–O | 1.89 | 2.8 | 0.006 | |
| Fe–O | 3.14 | 12.0 | 0.048 | |
| Fe–Fe | 3.47 | 12.0 | 0.013 | |
![[thin space (1/6-em)]](https://www.rsc.org/images/entities/char_2009.gif) |
||||
| Cr@Fe3O4 | Fe–O | 1.97 | 2.2 | 0.012 |
| Fe–O | 2.40 | 3.8 | 0.059 | |
| Fe–Fe | 2.76 | 0.9 | 0.004 | |
| Fe–Fe | 3.00 | 2.9 | 0.008 | |
| Fe–Fe | 3.49 | 3.2 | 0.013 | |
![[thin space (1/6-em)]](https://www.rsc.org/images/entities/char_2009.gif) |
||||
| α-FeOOH | Fe–O | 1.97 | 4.3 | 0.012 |
| Fe–Fe | 3.00 | 3.1 | 0.012 | |
| Fe–Fe | 3.30 | 3.0 | 0.013 | |
| Fe–O | 3.40 | 3.0 | 0.002 | |
| Fe–Fe | 3.89 | 12.0 | 0.035 | |
![[thin space (1/6-em)]](https://www.rsc.org/images/entities/char_2009.gif) |
||||
| Cr@FeOOH | Fe–O | 1.98 | 6.0 | 0.013 |
| Fe–Fe | 3.00 | 6.0 | 0.017 | |
| Fe–O | 3.32 | 6.0 | 0.003 | |
| Fe–O | 3.81 | 12.0 | 0.004 | |
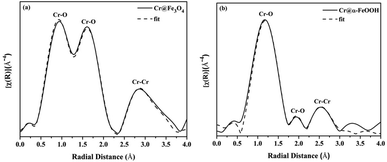 | ||
| Fig. 10 Fourier transforms of the k3 (χ) weighted in Cr K-edge EXAFS data collected from (a) Cr@Fe3O4 and (b) Cr@FeOOH. | ||
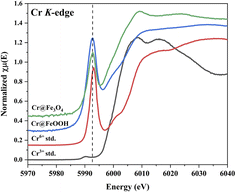
The Cr K-edge EXAFS analysis of Cr@FeOOH are presented in Fig. 10b and Table S17.† Tetrahedral Cr–O bonds with the bond distances of 1.33 Å and 1.59 Å corresponded to Cr6+ in HCrO4−. Moreover, the average bond distance of 2-fold Cr–Cr bonds of 3.17 Å was found in Cr@FeOOH which was different from Cr–Cr bonds in Cr@Fe3O4 confirming that the HCrO4− species was presented on α-FeOOH.
| H2CrO4 → HCrO4− + H+ | (8) |
| 2HCrO4− + 2Fe2+ + 10H+ → 2Fe3+ + 2Cr3+ + 6H2O + O2 | (9) |
| (1−x)Fe3+ + (x)Cr3+ + 2H2O → Fe(1−x)CrxOOH(s) + 3H+ | (10) |
Additionally, the XPS and XAS results revealed the increase of FeO species in Fe3O4 after Cr-adsorption. Thus, the most likely form was a Fe(3−x)CrxO4 solid solution containing Fe2+ and Cr3+ in forms of FeO and Cr2O3.62 The presented species might be created through Cr6+ reduction mechanism by FeO in Fe3O4 (or FeO·Fe2O3) structure as expressed by eqn (11).
| 2FeO + 4HCrO4− + 4H+ → 2Fe(3−x)CrxO4 + 4H2O + 3O2 | (11) |
Meanwhile, α-FeOOH surface changed to positive [FeO–OH2]2+ species at pH = 3.0 (eqn (12)). These [FeO–OH2]2+ molecules could react with the presented negative HCrO4− species by an electrostatic force (physisorption) and created FeO–HCrO4 species (eqn (13)).7 This adsorption behavior did not change the local geometry and oxidation state of iron atoms in α-FeOOH.
| FeOOH + H+ → FeO–OH2+ | (12) |
| FeO–OH2+ + HCrO4− → FeO–HCrO4 + H2O | (13) |
Conclusions
Fe3O4 (magnetite) and α-FeOOH (goethite) synthesized by the hydrothermal method were mainly in cubic and orthorhombic structures, respectively. The Cr adsorption isotherms of Fe3O4 and α-FeOOH fitted well with the Langmuir model, indicating a monolayer adsorption process. The maximum Cr6+ uptake of 2.87 mg g−1 was found by Fe3O4. After Cr-adsorption, the Cr3+-doped forms of Fe(1−x)CrxOOH and Fe(3−x)CrxO4 solid solution was observed in bulk Fe3O4 resulting in a high Cr-adsorption capacity. Besides, an electrostatic attraction of FeO–HCrO4 occurred only on the α-FeOOH surface leading to a low Cr-adsorption capacity. The Cr-adsorption ability and behavior in an aqueous solution of the adsorbents were strongly influenced by an adsorbed species stabilized on their structures. The discovered Cr-solid solution in Fe3O4 could be a promising catalyst preparation through water treatment process.Author contributions
Nichapha Senamart-data curation, formal analysis, writing-original draft, writing-review & editing; Krittanun Deekamwong-writing-review & editing; Jatuporn Wittayakun-supervision & editing; Sanchai Prayoonpokarach-review & editing; Narong Chanlek-data analysis; Yingyot Poo-arporn-review & editing; Suttipong Wannapaiboon-data curation, formal analysis, writing; Pinit Kidkhunthod-data analysis and Sirinuch Loiha-conceptualization, funding acquisition, supervision, writing-review & editing.Conflicts of interest
There are no conflicts to declare.Acknowledgements
This work was supported by the Science Achievement Scholarship of Thailand (SAST), Center for Innovation in Chemistry (PERCH-CIC). Materials Chemistry Research Center (MCRC), Thailand. Department of Chemistry, Faculty of Science, Khon Kaen University, Khon Kaen, Thailand. Research and Graduate Studies Department, KKU (Research Program, grant number RP64-6/001), fiscal year 2021. Synchrotron Light Research Institute (SLRI), Nakhon Ratchasima, Thailand (BL1.1W, BL2.2, BL3.2Ua, BL5.2 and BL5.3). Suranaree University of Technology (SUT), Thailand Science Research and Innovation (TSRI), and National Science, Research and Innovation Fund (NSRF) (90464/project code 90464).References
- A. Chiu, X. L. Shi, W. K. P. Lee, R. Hill, T. P. Wakeman, A. Katz, B. Xu, N. S. Dalal, J. D. Robertson, C. Chen, N. Chiu and L. Donehower, J. Environ. Sci. Health, Part C: Environ. Carcinog. Ecotoxicol. Rev., 2010, 28, 188–230 CrossRef CAS.
- M. Narayani and K. V. Shetty, Crit. Rev. Environ. Sci. Technol., 2012, 43, 955–1009 CrossRef.
- R. Rakhunde, L. Deshpande and H. D. Juneja, Crit. Rev. Environ. Sci. Technol., 2011, 42, 776–810 CrossRef.
- E. J. Tomaszewski, S. Lee, J. Rudolph, H. Xu and M. Ginder-Vogel, Chem. Geol., 2017, 464, 101–109 CrossRef CAS.
- L. Li, Y. Li, L. Cao and C. Yang, Carbohydr. Polym., 2015, 125, 206–213 CrossRef CAS.
- P. Lazo, J. Int. Environ. Appl. Sci., 2009, 4, 207–213 CAS.
- S. Wu, J. Lu, Z. Ding, N. Li, F. Fu and B. Tang, RSC Adv., 2016, 6, 82118–82130 RSC.
- S. R. Chowdhury, E. K. Yanful and A. R. Pratt, J. Hazard. Mater., 2012, 235–236, 246–256 CrossRef CAS PubMed.
- X. Lv, J. Xu, G. Jiang, J. Tang and X. Xu, J. Colloid Interface Sci., 2012, 369, 460–469 CrossRef CAS PubMed.
- Y. L. Wei, Y. C. Lee and H. F. Hsieh, Chemosphere, 2005, 61, 1051–1060 CrossRef CAS PubMed.
- A. H. Meena and Y. Arai, Geochem. Trans., 2016, 17, 1 CrossRef PubMed.
- M. Gheju and I. Balcu, J. Hazard. Mater., 2011, 196, 131–138 CrossRef CAS.
- A. Maleki, B. Hayati, M. Naghizadeh and S. W. Joo, J. Ind. Eng. Chem., 2015, 28, 211–216 CrossRef CAS.
- M. Gheju, Water, Air, Soil Pollut., 2011, 222, 103–148 CrossRef CAS.
- S. M. El-Sheikh, A. B. Azzam, R. A. Geioushy, F. M. El Dars and B. A. Salah, J. Alloys Compd., 2021, 857, 157513 CrossRef CAS.
- R. A. Geioushy, S. M. El-Sheikh, A. B. Azzam, B. A. Salah and F. M. El-Dars, J. Hazard. Mater., 2020, 381, 120955 CrossRef CAS PubMed.
- F. Di Natale, A. Erto, A. Lancia and D. Musmarra, J. Hazard. Mater., 2015, 281, 47–55 CrossRef CAS PubMed.
- S. M. Lee, L. Lalchhingpuii and D. Tiwari, Chem. Eng. J., 2016, 296, 35–44 CrossRef CAS.
- Q. Liu, Q. Liu, W. Ma, W. Liu, X. Cai and J. Yao, Colloids Surf., A, 2016, 511, 8–16 CrossRef CAS.
- E. I. Basaldella, P. G. Vázquez, F. Iucolano and D. Caputo, J. Colloid Interface Sci., 2007, 313, 574–578 CrossRef CAS PubMed.
- L. N. Døssing, K. Dideriksen, S. L. S. Stipp and R. Frei, Chem. Geol., 2011, 285, 157–166 CrossRef.
- D. L. Sedlak and P. G. Chan, Geochim. Cosmochim. Acta, 1997, 61, 2185–2192 CrossRef CAS.
- A. E. Gleason, R. Jeanloz and M. Kunz, Am. Mineral., 2008, 93, 1882–1885 CrossRef CAS.
- H. Abdel-Samad and P. R. Watson, Appl. Surf. Sci., 1997, 108, 371–377 CrossRef CAS.
- T. Mineno and M. Okazaki, Soil Sci. Plant Nutr., 2004, 50, 1043–1046 CrossRef CAS.
- V. D. Nguyen, J. Kynicky, P. Ambrozova and V. Adam, Materials, 2017, 10, 783 CrossRef PubMed.
- M. Kumari, C. U. Pittman Jr and D. Mohan, J. Colloid Interface Sci., 2014, 442, 120–132 CrossRef.
- S. Rajput, C. U. Pittman and D. Mohan, J. Colloid Interface Sci., 2016, 468, 334–346 CrossRef CAS PubMed.
- A. H. Meena and Y. Arai, Geochem. Trans., 2016, 17, 1 CrossRef.
- J. Chang, H. Wang, J. Zhang, Q. Xue and H. Chen, Colloids Surf., A, 2021, 611, 125784 CrossRef CAS.
- N. Senamart, J. Watcharakitti, K. Atthawilai, K. Phedluen, P. Nasomjai and S. Loiha, Suranaree J. Sci. Technol., 2018, 25, 445–454 Search PubMed.
- P. Ou, G. Xu, Z. Ren, X. Hou and G. Han, Mater. Lett., 2008, 62, 914–917 CrossRef CAS.
- U. Pal, S. Uribe Madrid and F. Sanchez De-jesus, Adv. Nano. Res., 2014, 2, 187–198 CrossRef.
- G. Du, Z. Li, L. Liao, R. Hanson, S. Leick, N. Hoeppner and W. T. Jiang, J. Hazard. Mater., 2012, 221–222, 118–123 CrossRef CAS PubMed.
- M. Kazemi, M. Jahanshahi and M. Peyravi, J. Hazard. Mater., 2018, 344, 12–22 CrossRef CAS PubMed.
- O. Ali and S. K. Mohamed, Turk. J. Chem., 2017, 41, 967–986 CrossRef CAS.
- F. Geng, Z. Zhao, J. Geng, H. Cong and H.-M. Cheng, Mater. Lett., 2007, 61, 4794–4796 CrossRef CAS.
- A. R. Amani-Ghadim, S. Alizadeh, F. Khodam and Z. Rezvani, J. Mol. Catal. A: Chem., 2015, 408, 60–68 CrossRef CAS.
- S. Alibeigi and M. R. Vaezi, Chem. Eng. Technol., 2008, 31, 1591–1596 CrossRef CAS.
- Y. F. Shen, J. Tang, Z. H. Nie, Y. D. Wang, Y. Ren and L. Zuo, Sep. Purif. Technol., 2009, 68, 312–319 CrossRef CAS.
- N. Guo, X. Lv, Q. Li, T. Ren, H. Song and Q. Yang, Microporous Mesoporous Mater., 2020, 299, 110101 CrossRef CAS.
- Z. Liu, G. Chen, L. Xu, F. Hu and X. Duan, ChemistrySelect, 2019, 4, 13817–13827 CrossRef CAS.
- M. Bhaumik, A. Maity, V. V. Srinivasu and M. S. Onyango, J. Hazard. Mater., 2011, 190, 381–390 CrossRef CAS PubMed.
- S. U. N. Zhenya, Z. H. U. Chunshui, H. Jiangbo, G. Wenqi, C. Hesheng and M. U. Shanbin, Acta Geol. Sin., 2006, 80, 597–603 CrossRef.
- X. Q. Zhang, Y. Guo and W.-C. Li, RSC Adv., 2015, 5, 25896–25903 RSC.
- M. Ahmaruzzaman, Adv. Colloid Interface Sci., 2011, 166, 36–59 CrossRef CAS PubMed.
- G. Vijayakumar, R. Tamilarasan and M. Dharmendirakumar, J. Mater. Environ. Sci., 2012, 3, 157–170 CAS.
- M. Hasanpour and M. Hatami, Adv. Colloid Interface Sci., 2020, 284, 102247 CrossRef CAS PubMed.
- Y. H. Li, Z. Di, J. Ding, D. Wu, Z. Luan and Y. Zhu, Water Res., 2005, 39, 605–609 CrossRef CAS PubMed.
- A. P. Grosvenor, B. A. Kobe, M. C. Biesinger and N. S. McIntyre, Surf. Interface Anal., 2004, 36, 1564–1574 CrossRef CAS.
- X. Zhang, W. G. Sloof, A. Hovestad, E. P. M. van Westing, H. Terryn and J. H. W. de Wit, Surf. Coat. Technol., 2005, 197, 168–176 CrossRef CAS.
- Z. Wen, J. Ke, J. Xu, S. Guo, Y. Zhang and R. Chen, Chem. Eng. J., 2018, 343, 416–426 CrossRef CAS.
- Z. Wen, Y. Zhang, S. Guo and R. Chen, J. Colloid Interface Sci., 2017, 486, 211–218 CrossRef CAS.
- Z. Wen, Y. Zhang, G. Cheng, Y. Wang and R. Chen, Chemosphere, 2019, 218, 1002–1013 CrossRef CAS PubMed.
- S. M. Walker, M. C. Marcano, W. M. Bender and U. Becker, Chem. Geol., 2016, 429, 60–74 CrossRef CAS.
- B. P. von der Heyden, A. N. Roychoudhury, T. Tyliszczak and S. C. B. Myneni, Am. Mineral., 2017, 102, 674–685 CrossRef.
- S. Ould-Chikh, O. Proux, P. Afanasiev, L. Khrouz, N. Hedhili Mohamed, H. Anjum Dalaver, M. Harb, C. Geantet, J. M. Basset and E. Puzenat, ChemSusChem, 2014, 7, 1361–1371 CrossRef CAS PubMed.
- C. J. Keturakis, M. Zhu, E. K. Gibson, M. Daturi, F. Tao, A. I. Frenkel and I. E. Wachs, ACS Catal., 2016, 6, 4786–4798 CrossRef CAS.
- F. Pinakidou, M. Katsikini, K. Simeonidis, E. Kaprara, E. C. Paloura and M. Mitrakas, Appl. Surf. Sci., 2016, 360, 1080–1086 CrossRef CAS.
- S.-f. Niu, Y. Liu, X.-h. Xu and Z.-h. Lou, J. Zhejiang Univ., Sci., B, 2005, 6, 1022–1027 CrossRef PubMed.
- T. Kendelewicz, P. Liu, C. S. Doyle and G. E. Brown, Surf. Sci., 2000, 469, 144–163 CrossRef CAS.
- X. Wang, N. Chen and L. Zhang, Environ. Sci.: Nano, 2019, 6, 2185–2194 RSC.
Footnote |
| † Electronic supplementary information (ESI) available. See https://doi.org/10.1039/d2ra03676b |
| This journal is © The Royal Society of Chemistry 2022 |


