DOI:
10.1039/D2RA03554E
(Paper)
RSC Adv., 2022,
12, 24063-24076
Quantum dot decorated polyaniline plastic as a multifunctional nanocomposite: experimental and theoretical approach
Received
8th June 2022
, Accepted 15th August 2022
First published on 24th August 2022
Abstract
AgO, CoO, and ZnO (ACZ) mixed metal quantum dots (QDs) were synthesized by the sol–gel process. Polyaniline (PANI) was prepared by the chemical-oxidative technique. An in situ approach was used for the synthesis of ACZ decorated PANI plastic nanocomposites (NCs). TEM, FTIR, FESEM, UV-visible, DSC, Raman, photoluminescence, and XRD techniques were used for characterizing the QDs, PANI, and ACZ decorated PANI NCs. Experimental and theoretical (DFT) studies were used to support the results. NCs were studied for their adsorption, magnetic, photocatalytic, electrical, thermal, photoluminescence, antibacterial, and anticorrosive activities. The plastic NCs of size 35 nm (observed from XRD and TEM) were found to be paramagnetic. UV-visible spectroscopy and DFT techniques were used to observe the optical band gap of NCs and show an almost equal band gap i.e., 2.75 eV. In 1.0 M H2SO4, the NCs show an 82.0% corrosion inhibition efficiency for mild steel. The adsorption power of the silica gel + NCs packed column was higher than normal silica gel column. A very small low-intensity D band in the Raman spectra confirms defect-free NCs. The photocatalytic activity was observed against methyl-red dye in visible light. The thermal stability of plastic NCs was higher than pure PANI and QDs. The NCs were investigated for bactericidal activity against Gram (positive and negative) microorganisms. The ACZ decorated PANI NCs acted as good nanomaterials for adsorption, separation, magnetic, photocatalytic, photoluminescence, antibacterial, electrical, thermal insulator, and anticorrosive agent.
1. Introduction
Nanomaterials and polymer nanocomposites have gained popularity in different fields over the last few decades. 0D metal oxide nanoparticles i.e., quantum dots, 1D nanomaterials like conducting polymers, and 2D materials like graphene oxide, MOFs, COFs, metal dichalcogenides, MXenes, etc. have unique properties. When 0D and 1D nanomaterials are combined, it sometimes results in a synergistic effect on their properties. Quantum dots due to their small size and large surface area are used in applications like catalysis, purification, separation, adsorption, composite electrode material in rechargeable batteries, supercapacitors, sensors (optical and chemical), solar cells, and electronic devices. Conducting polymers (CPs) e.g., PANI due to their stability, biocompatibility, and adjustable electrical conductivity, are widely used in different applications.1 PANI is the most interesting polymer among all the CPs because of its ease of preparation, good environmental stability, and tunable electrical conductivity.2,3 PANI is a conjugated polymer whose electrical conductivity and electronic structure can be reversibly optimized by both chemical oxidation and protonation. The exceptional properties of PANI like dielectric, electrical, physical, and optical depend on the size, specific molar volume, nucleation time, self-agglomeration process, the concentration of precursor, separation technique, reaction conditions, drying process, seedling time, molecular weight, annealing temperature, etc.4–7
Metal oxides (QDs) decorated PANI NCs on the other hand show greater catalytic, sensing, photocatalytic, and electrical properties in comparison to simple PANI and QDs.8–14 They have been applied in electrocatalysis,15 rechargeable batteries,16 supper capacitors,17 membrane separation,18 optoelectronic,19 extraction,20 solar cells,21 and electrochemical biosensors.22 By employing chloroauric acid as the oxidant and Au NPs as the seed, Li et al. created Au NPs@PANI core–shell nanocomposites based electrode material for the electrochemical detection of ascorbic acid and dopamine.23 Zhao et al. created a non-enzymatic hydrogen peroxide electrochemical sensor on a glassy carbon electrode using a PANI/Cu NCs for the electrochemical determination of H2O2.24
Mazhar et al. have created a silver-doped zinc sulfide based on polyaniline (PANI–Ag/ZnS) NCs and reported their photocatalytic activity against methylene blue dye.25 PANI decorated with QDs, provides a large surface for the exchange of electrons and holes and hence an increase in photocatalytic activity.26 Vishwakarma and his group observed the bactericidal activity of CoFe2O4/PANI NCs against Gram +ve (S. aureus, B. subtilis) and Gram −ve (E. coli, P. aeruginosa) bacterial strains.27 Javed et al. have investigated NPs-based PANI NCs as an electrode material for supercapacitors.28 They tested the performance of electrode material by CV, impedance spectroscopy, and charge–discharge cycle. They observed high cycle life and capacitance retention of supercapacitor. Hajjaoui et al. have investigated the influence of NPs-based PANI NCs as adsorbents for environmental pollutants.29 They observed that the size, morphology, and synthesis conditions of NCs influence their adsorption power. Kebiche at el. has investigated the size effect of Palladium and Tin colloidal particles of PANI NCs.30 They observed that different sizes of Pd and Sn NPs affect the morphology, conductivity and other properties of PANI NCs. Shivhare and Supriya investigated in detail the metal oxide PANI-based NCs for one or two specific applications.31 Rhazi et al. investigated the synthesis and characterization of application-specific metal NPs based on PANI NCs.32 Zahed et al. investigated Ag/PANI NCs as a sensor for an anticancer drug.33 The anticancer drug used was 5-fluorouracil. SEM, X-ray with EDS, and IR techniques were used for the characterization of NCs. Bhanita et al. have fabricated a glassy carbon-based Fe3O4@PANI electrochemical sensor for the detection of 2,4-dichlorophenoxyacetic acid.34 The sensor shows a linear concentration-response. The sensitivity and selectivity of the sensor were found to be high. Ebrahim et al. have fabricated Silver@GO@PANI@2-acrylamido-2-methyl propane sulfonic acid sensor for sensing the poisonous Cd metal.35 The detection limit of the sensor was found to be 0.0065 mg L−1. The sensor distinguishes between Cd(III) and Cd(IV) in the sample. Shokri et al. have used acrylamido-methylpropane-sulphonic acid + PANI + AgO + rGO quaternary NCs for the selective removal of Cr(VI) from an aqueous solution.36 In another research, Shokri et al. investigated Akaganéite/PANI a superparamagnetic NCs material for the selective removal of Cd from impure water.37
For the first time, we are reporting the fabrication of QDs decorated PANI plastic NCs as a multifunctional nanomaterial as an antibacterial, anticorrosive, adsorbent, magnetic, photoluminescence, conducting, heat resistive, and photocatalytic agent. Both theoretical (DFT) and experimental techniques were used to support our results. Seven novel applications of QDs decorated PANI based plastic NCs were explored. This research will open up the dimensions of multifunctional plastic-based NCs with unique properties and multiple applications.
2. Material and methods
AR grade chemicals like C2H5OH, AlCl3, C6H5NH2, (NH4)2S2O8, ZnNO3, CoNO3, AgNO3, HCl, and H2C2O4, were used for the synthesis. Double distilled water was used in the preparation of solutions (electrical conductivity = 1.01 μS). AlCl3, ethanol, aniline (monomer), oxalic acid, AgNO3, CoNO3, ZnNO3 were procured from Thermo Fisher Scientific, Maharashtra-India (purity 98.7%), Chanhshu Hongsheng Fine Chemicals Co. Ltd, Changshu city, China (purity 99.9%), Rankem Gurugram-Haryana (purity 99.0%), Finar Chemicals, Ahmedabad, Gujrat (purity 99.5%), and Sigma-Aldrich Chemicals Pvt. Ltd., New Delhi (purity 99.99%), respectively.
The anticorrosive properties of ACZ decorated PANI NCs at different concentrations were investigated using the weight loss method (ASTM-D2688) on Mild Steel (MS) in a 1.0 M H2SO4 solution. Gaussian09 and BIOVIA Material studio software were used in the theoretical study. The optical bandgap and adsorption sites of ACZ@PANI NCs were investigated using HOMO, LUMO, and van der Waal surfaces. The antibacterial activity of ACZ QDs was investigated by the agar-well methodology. Antibacterial activity was tested against Gram-negative and Gram-positive bacterial strains, that is E. coli and B. subtilis.38–40 Hexa-disc (G-minus-1), was used as a control. The Zone-of-Inhibition (ZOI) in mm was measured for E. coli and B. subtilis. The adsorption study was carried out using column chromatography. A magnetic study was carried out using Goy's balance (GMX-02, SES Instruments Pvt. Ltd., Haridwar, Uttarakhand). The photocatalytic study (UV-2600, Shimadzu, Toshvin Analytical, Mumbai) was carried out against methyl red dye in sunlight (visible light).
Thermogravimetric analysis of quantum dots decorated PANI NCs was carried out by differential scanning calorimetry (DSC) technique (Q-10, TA Instruments Waters, USA). The PANI NCs were heated from room temperature to 500 °C at a rate of 10° min−1 in N2 atm. The exothermic, endothermic, and enthalpy changes of melting were observed.
2.1 Sol–gel technique
A metal salt solution of ZnNO3, AgNO3, and CoNO3 (0.5 M each) was prepared by using distilled water. The pH was adjusted to 1–2 by the use of dilute HNO3. This metal salt solution was labelled as Sol A. Sol B was prepared by mixing oxalic acid and ethanol in a ratio of 1![[thin space (1/6-em)]](https://www.rsc.org/images/entities/char_2009.gif) :
:![[thin space (1/6-em)]](https://www.rsc.org/images/entities/char_2009.gif) 4. The Sol B was mixed with Sol A dropwise with continuous stirring (600 rpm) at 70 °C. After 6 h, a light brown color appeared. The precipitates were washed with distilled water and then acetone. The precipitates were dried at 70 °C for 6 h and stored in a glass vial.
4. The Sol B was mixed with Sol A dropwise with continuous stirring (600 rpm) at 70 °C. After 6 h, a light brown color appeared. The precipitates were washed with distilled water and then acetone. The precipitates were dried at 70 °C for 6 h and stored in a glass vial.
2.2 In situ synthesis of QDs decorated PANI NCs by chemical-oxidative polymerization
0.1 M mixed metal QDs (ACZ) were added to aniline monomer (1.0 M) in 1.0 M HCl. The AlCl3 oxidant (1.0 M) was added dropwise. The temperature was kept below 4 °C. 1.0 M ammonium persulphate (APS) was added. The progress of the reaction was monitored for 7 h. Filtration and rinsing were done with water, dilute HCl and ethanol. Vacuum dried at 70 °C for 12 h. A green-black color solid was obtained.
3. Results and discussion
3.1 FTIR study of ACZ decorated PANI NCs
FT-IR was used to analyse the PANI NCs, identifying functional groups and impurities, if present. Fig. 1 shows FTIR spectra of ACZ QDs and ACZ decorated PANI NCs. FTIR spectrum of ACZ QDs showed absorption peaks at 563 and 661 cm−1. The absorption band at 563 cm−1 was assigned to the Co–O stretching vibration and at 661 cm−1 to the bridging vibration of the O–Co–O.41 Peaks at 450–550 cm−1 correspond to Zn–O stretching vibrations.42 The FTIR spectra of ACZ QDs show a strong band at 435 cm−1 corresponding to Ag–O. Aromatic ring peaks were observed at 1625.75, 1488, and 1358 cm−1. A broader peak in 3300–3400 cm−1 in ACZ QDs (due to the absorption of moisture from the atmosphere) was not visible in ACZ/PANI NCs. The intensity of peak at 1295 and 1625 cm−1 decreases in ACZ/PANI NCs. The peak at 748 cm−1 (Co–O stretching) in QDs is shifted to slightly higher wavenumber in ACZ/PANI NCs.43 The C–N stretching peak was observed at 1358 cm−1. The peak at 1295.85 cm−1 is correlated to secondary aromatic amine C–N vibrations. C![[double bond, length as m-dash]](https://www.rsc.org/images/entities/char_e001.gif) C stretching peak was observed at 1488 cm−1.
C stretching peak was observed at 1488 cm−1.
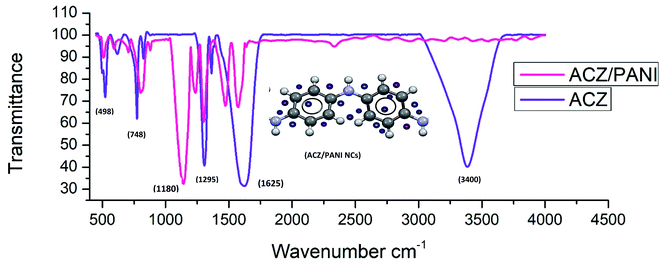 |
| | Fig. 1 FTIR spectra of ACZ QDs (purple colour) and ACZ QDs decorated PANI NCs (pink colour). | |
3.2 UV-visible spectroscopic study
Fig. 2 depicts absorption spectra of ACZ QDs and ACZ decorated PANI NCs. Fig. 3 shows the indirect bandgap obtained by Tauc plots for NCs. ACZ QDs and ACZ decorated PANI NCs had a maximum absorbance of 1.999 at 193 nm and 1.204 at 188.5 nm, respectively.
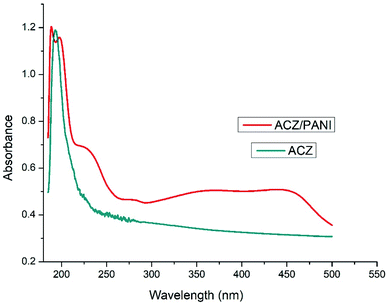 |
| | Fig. 2 UV-visible spectra of ACZ QDs and ACZ QDs decorated PANI NCs. | |
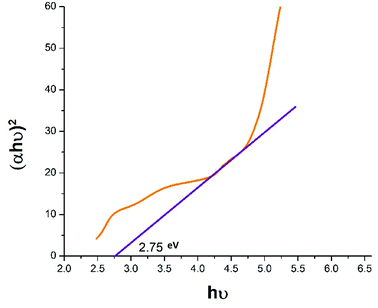 |
| | Fig. 3 The indirect band gap of ACZ decorated PANI NCs as observed from Tauc plot from UV-visible spectroscopy. | |
3.2.1 The optical band gap of ACZ decorated PANI NCs. Using the Tauc relation (eqn (1)), the indirect bandgap of NCs was determined.44The Lambert's–Beer relation was used to calculate the absorption coefficient.45
A linear relation between (αhν)2 and hν was observed for ACZ decorated PANI NCs (Fig. 3). Because of the π–π* transition (VB to CB), the energy band gap (Eg) of NCs was 2.75 eV, whereas the pure PANI was 3.2 eV.46 After adding ACZ QDs to PANI, the indirect bandgap dropped from 3.2 to 2.75 eV. As a result, the electrical conductivity of the ACZ decorated PANI NCs was slightly improved.
3.3 Raman spectroscopic study
Raman spectroscopy is a non-destructive analytical technique for chemical, structural, crystalline, non-crystalline, phase identification, molecular interaction, and poly-morphology study.47 In this technique, laser light is bombarded on the sample and investigates bonds present in a material. Fig. 4 shows Raman spectra of ACZ QDs and ACZ QDs decorated PANI NCs. The number of peaks, their shapes, and energies are linked to the overall shape of the molecules. The pattern of these bands will help in structural elucidation and identification of specific molecules/groups in the nanomaterials. Three major Longitudinal Optical phonon Vibrations (LOV) were observed in the Raman spectra of QDs and NCs. LOV (1) peak in the fingerprint region of the Raman spectra represents the presence of inorganic metal (transition metal QDs) and metalorganic groups in the NCs.48 This is due to the possible bonding between transition metal QDs and organic PANI molecules. Very small low-intensity D bands i.e., LOV (2) represent the absence of any defects in the NCs. A significant G band i.e., LOV (3) represents the structural resemblance of PANI with the graphitic molecule. LOV (1) peak is shifted to a lower wave number in the case of NCs whereas LOV (2) and LOV (3) were shifted to higher wavenumber in NCs as compared to QDs. A multiplet in the region of 2000–1500 cm−1 signifies the presence of C![[double bond, length as m-dash]](https://www.rsc.org/images/entities/char_e001.gif) C and C
C and C![[double bond, length as m-dash]](https://www.rsc.org/images/entities/char_e001.gif) N double bond in the structure of PANI. A triplet near 1400 cm−1 represents a complex pattern due to C–C and C–N bonds present in PANI. The broader peaks and pattern of bands in the Raman spectra prove somewhat amorphous character of PANI.
N double bond in the structure of PANI. A triplet near 1400 cm−1 represents a complex pattern due to C–C and C–N bonds present in PANI. The broader peaks and pattern of bands in the Raman spectra prove somewhat amorphous character of PANI.
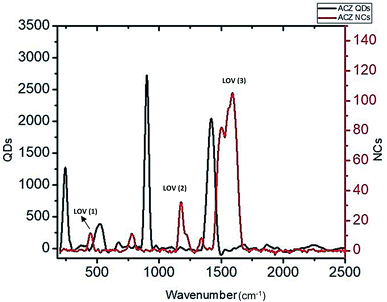 |
| | Fig. 4 Raman spectra ACZ QDs (black) and ACZ decorated PANI NCs (red). | |
3.4 SEM study
The scanning electron microscopy (SEM) technique was used for the surface study of NCs. SEM is a surface imaging technique for investigating the surface morphology and size of the NCs. Fig. 5 shows an SEM image of ACZ QDs decorated with PANI NCs. It is clear from the SEM image that NCs are globular or spherical. They look like a puffy ball and hence proving the amorphous character of NCs and the same information of amorphous character was also proved by Raman spectroscopy. The average particle size of NCs as observed from the SEM was 30–40 nm. The ACZ QDs get completely encapsulated in the PANI NCs framework and cannot be seen on the surface of NCs in the SEM image.
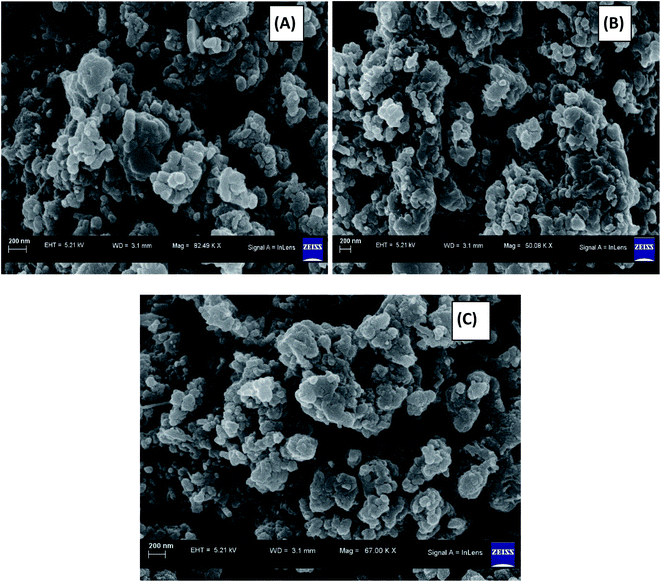 |
| | Fig. 5 SEM images ACZ QDs decorated PANI NCs. | |
3.5 TEM study
Tunnelling Electron Microscopy (TEM) is a more advanced technique than the SEM. Although surface information obtained from these two techniques are similar but TEM magnification and resolution are better than SEM. That's why, we conducted both SEM and TEM techniques for the characterization of NCs. Fig. 6 shows the TEM image of ACZ QDs decorated PANI NCs. It is clear from Fig. 6A and B that QDs are completely entrapped in an amorphous sheet-like network of PANI. Fig. 6C shows TEM with EDS analysis of a particular QDs. A well-defined circular ring shows the perfect mixing of QDs in the PANI network framework. The average particle size of QDs as observed from the TEM image was 35 nm.
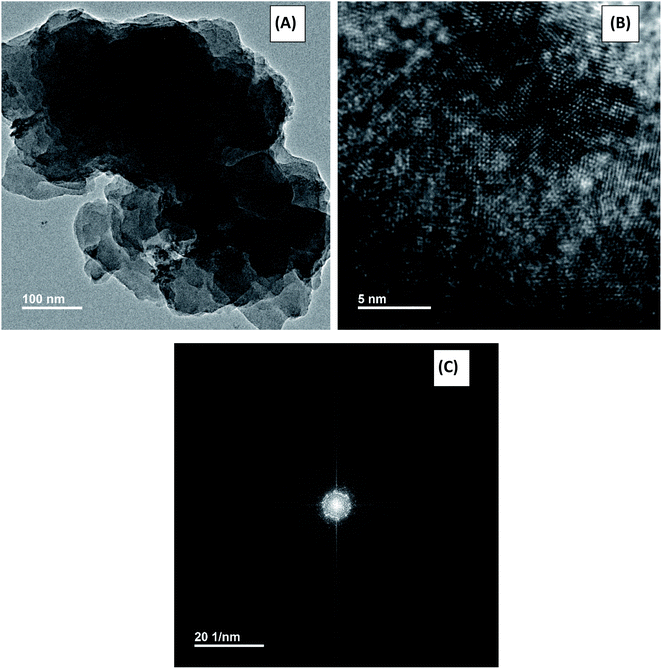 |
| | Fig. 6 TEM images of Zn/Co/AgO QDs decorated PANI NCs. | |
3.6 X-ray diffraction study
X-ray diffraction study of Zn/Co/AgO QDs decorated PANI NCs was performed to investigate the detailed structure, morphology, space group, crystal system, particle size, and cell parameters. The Rietveld refinement method was used to investigate the finer details of the structure. Fig. 7 shows the X-ray diffraction pattern of Zn/Co/AgO QDs and Zn/Co/AgO QDs decorated PANI NCs. The NCs belong to the space group, P121/n1 (14) having monoclinic structure, having cell parameters, a = 5.2550, b = 8.5110, and c = 7.9690 Å.49 The miller indices corresponding to the highest intensity peak (2θ = 25°) was (111) in NCs and (101) at 2θ = 32.3° in QDs. The particle size of NCs observed from the Scherrer equation was 35 nm corresponding to the highest intensity peak. The NCs was having some amorphous character due to the major fraction of PANI.50
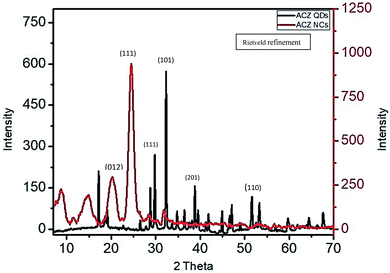 |
| | Fig. 7 X-ray diffraction pattern of ACZ QDs (black) and ACZ decorated PANI NCs (red). | |
4. Applications of ACZ decorated PANI NCs
4.1 Anti-corrosive study of ACZ decorated PANI NCs
The anticorrosive activities of NCs were evaluated for MS in 1.0 M H2SO4. MS was dipped in a 1.0 M H2SO4 solution containing NCs of various concentrations for 3 h. The change in weight of the MS, the corrosion rate (CR) in mpy, and corrosion inhibition efficiency (CIE) were calculated according to ASTM standards.51,52 On increasing the concentration of NCs, weight loss and CR decrease, and CIE increases, as shown in Table 1. Fig. 8 displays variation in CIE against NCs concentration. CIE increases linearly with the concentration of NCs. The NCs promise to be a good anticorrosive composite nanomaterial for MS in an acidic medium.
Table 1 Weight loss (mg), corrosion rate (mpy), and corrosion inhibition efficiency (%) shown by ACZ decorated PANI NCs for MS in an acidic medium
| Concentration (ppm) |
Weight loss (mg) |
Corrosion rate (mpy) |
% corrosion inhibition efficiency (CIE) |
| 100 |
35.8 |
1163.41 |
21.4 |
| 200 |
28.2 |
916.43 |
38.1 |
| 400 |
23.1 |
750.69 |
49.3 |
| 600 |
15.7 |
510.21 |
65.5 |
| 800 |
11.3 |
367.22 |
75.2 |
| 1000 |
8.2 |
266.48 |
82.0 |
| Blank |
45.6 |
1556.8 |
— |
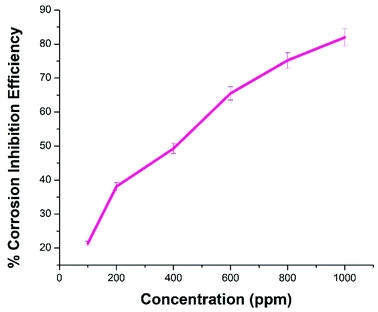 |
| | Fig. 8 Corrosion inhibition efficiency of ACZ decorated PANI NCs at different concentration for MS when exposed to 1 M H2SO4 for 3 h. | |
4.2 Photocatalytic study of ACZ decorated PANI NCs
The photocatalytic activities of NCs on methyl red dye (MRD) were investigated using UV-visible spectroscopy. Different concentrations of NCs were exposed to MRD for 150 min using visible light (sunlight). Fig. 9 shows the photocatalytic properties of ACZ decorated PANI NCs (100 mg ml−1) on MRD in visible light over time. The absorbance maxima decrease with an increase in time (zero to 150 min). The visible absorbance of NCs as a function of wavelength at different time intervals is depicted in Fig. 10. The maximum absorbance (Amax) and Ct/Co decline with time of exposure to the dye (Fig. 10). After 150 min, the Ct/Co ratio drops from 2.233 to 1.95. After 30 min, the highest absorbance was 1.892, and after 150 min of visible light exposure, it was 1.66. Hence, ACZ decorated PANI NCs show a good photocatalytic property in visible light.
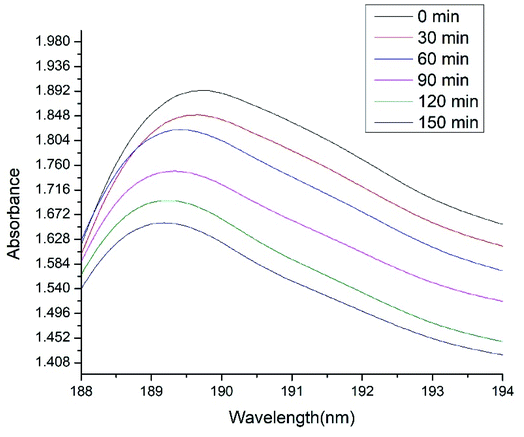 |
| | Fig. 9 UV-visible absorbance shown by ACZ decorated PANI NCs (100 ppm) with respect to wavelength at different time interval. | |
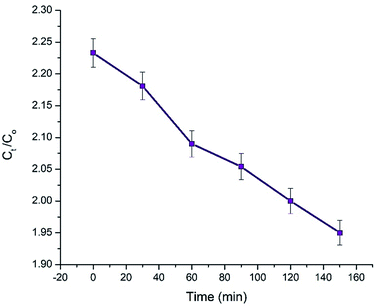 |
| | Fig. 10 Photocatalytic activity of ACZ decorated PANI NCs (100 ppm) on Methyl Red Dye (MRD) with respect to time under visible light illumination. | |
4.2.1 Mechanism of photocatalytic property of ACZ decorated PANI NCs against MRD. The enhanced photocatalytic activity of the NCs is due to the free movement of electrons by the linear polymeric chain structure of PANI, which has a large degree of unsaturation, resulting in a greater surface area for the movement of valence shell electrons. ACZ QDs and PANI work together to improve the photocatalytic activity of NCs. Oxygen atoms accept the free electrons in the CB of QDs to create oxygen-free radicals in NCs. Hydroxide free radicals are formed when oxygen free radicals react with water vapor. The photocatalytic performance of NCs is due to these hydroxide free radicals. Fig. 11 represents the proposed action of the photo-catalytic property of NCs. The mechanism in the form of consecutive steps is shown below:
| ACZ/PANI NCs + hν → e− present in CB + h+ present in VB |
| OH˙ + methyl red (dye) → CO2 + water |
| h+ + methyl red (dye) → CO2 + water |
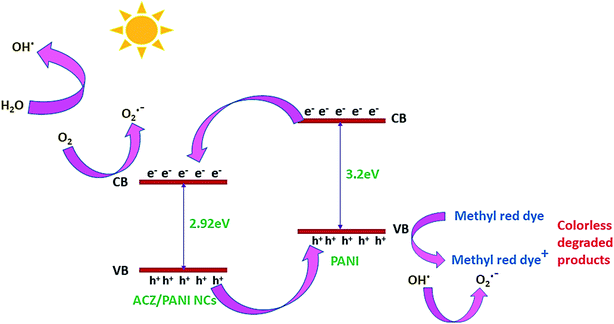 |
| | Fig. 11 Mechanism of photocatalytic activity shown by QDs decorated PANI NCs. | |
4.3 PL study of ACZ decorated PANI NCs
The PL investigation of ACZ decorated PANI NCs was done on HORIBA-JOBIN-FLOUROLOG (HJF) spectro-photometer. An excitation of 440 nm wavelength and emission of 350 nm was used for ACZ decorated PANI NCs. Fig. 12 shows PL spectra (excitation and emission) of ACZ decorated PANI NCs. The emission intensity was observed against wavelength. The PL spectra of NCs were used to observe the optimum excitation wavelength to be used in different organic light-emitting diodes (OLED).53–55 The optimum excitation wavelength of ACZ decorated PANI NCs was found to be 231 nm.
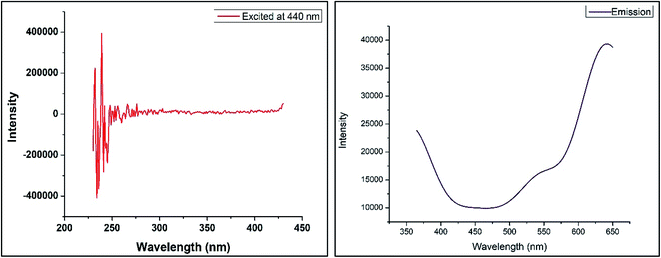 |
| | Fig. 12 Photoluminescence spectra of ACZ/PANI NCs excited at 440 nm and corresponding emission spectra. | |
4.4 Magnetic study of ACZ decorated PANI NCs
The ratio of the degree of magnetization to the applied magnetic field (H) is an excellent parameter for evaluating the magnetic nature of NCs. The Gouy's balance was used to determine magnetic susceptibility. Fig. 13 depicts the weight change of NCs as a function of the H2. With an increase in the magnetic field, the weight of NCs consistently decreased. This is due to an increase in the magnetic field passing through the sample, which proves that ACZ-decorated PANI NCs were paramagnetic. This was further supported by the magnetic susceptibility observed by eqn (2):| |
 | (2) |
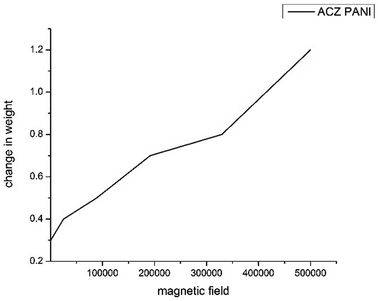 |
| | Fig. 13 The change in weight of ACZ decorated PANI NCs against the square of the imposed magnetic field (H2). | |
The magnetic susceptibility of NCs (χ = 0.012) indicates that the synthesized NCs are paramagnetic. As a result, ACZ-decorated PANI NCs can be used to make super magnets, magnetic recording tapes, and USB pen drives.
4.5 Adsorption study of ACZ QDs
In the column chromatography technique, the adsorption power of ACZ QDs was compared to that of silica gel. By filling the column with a 3![[thin space (1/6-em)]](https://www.rsc.org/images/entities/char_2009.gif) :
:![[thin space (1/6-em)]](https://www.rsc.org/images/entities/char_2009.gif) 1 ratio of silica gel and ACZ decorated PANI NCs, we first investigated the adsorption power of ACZ decorated PANI NCs. However, dye and PANI caused color interference. The adsorption power of ACZ QDs combined with silica gel was then examined. We didn't detect any color interference here. In ethanol solvent, the column was loaded with a 3
1 ratio of silica gel and ACZ decorated PANI NCs, we first investigated the adsorption power of ACZ decorated PANI NCs. However, dye and PANI caused color interference. The adsorption power of ACZ QDs combined with silica gel was then examined. We didn't detect any color interference here. In ethanol solvent, the column was loaded with a 3![[thin space (1/6-em)]](https://www.rsc.org/images/entities/char_2009.gif) :
:![[thin space (1/6-em)]](https://www.rsc.org/images/entities/char_2009.gif) 1 ratio of silica gel and ACZ QDs. The column's performance was evaluated using methyl red dye. The column was loaded with silica gel and silica gel + ACZ QDs as shown in Fig. 14. The methyl red dye flows out of the silica gel column in 30 min (Fig. 14a). The column's adsorption power increases (200 min) by replacing some fraction of silica gel with ACZ QDs as compared to a pure silica gel column (Fig. 14b). The small size and wide surface area of ACZ QDs were responsible for dye adsorption resulting in an increase in adsorption power. As a result, a blended silica gel + ACZ QDs column can be used instead of a traditional silica gel column. Fig. 15 shows adsorption mechanism of dye of silica gel + ACZ QDs. There is a possibility of weak electrostatic interaction between nitrogen and oxygen hetero atoms of dye with highly energetic ACZ QDs. This increases the time of flow of ethanol solvent through the column and hence adsorption power of column increases significantly by the inclusion of ACZ QDs in the column. Adsorption science and column chromatography will be revolutionized by the use of QDs in the column.
1 ratio of silica gel and ACZ QDs. The column's performance was evaluated using methyl red dye. The column was loaded with silica gel and silica gel + ACZ QDs as shown in Fig. 14. The methyl red dye flows out of the silica gel column in 30 min (Fig. 14a). The column's adsorption power increases (200 min) by replacing some fraction of silica gel with ACZ QDs as compared to a pure silica gel column (Fig. 14b). The small size and wide surface area of ACZ QDs were responsible for dye adsorption resulting in an increase in adsorption power. As a result, a blended silica gel + ACZ QDs column can be used instead of a traditional silica gel column. Fig. 15 shows adsorption mechanism of dye of silica gel + ACZ QDs. There is a possibility of weak electrostatic interaction between nitrogen and oxygen hetero atoms of dye with highly energetic ACZ QDs. This increases the time of flow of ethanol solvent through the column and hence adsorption power of column increases significantly by the inclusion of ACZ QDs in the column. Adsorption science and column chromatography will be revolutionized by the use of QDs in the column.
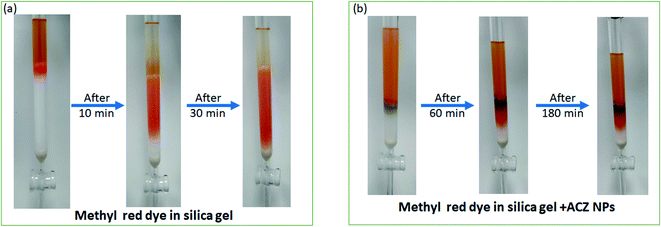 |
| | Fig. 14 Adsorption study of methylene red dye in silica gel (a) and ACZ QDs + silica gel (b) packed column. | |
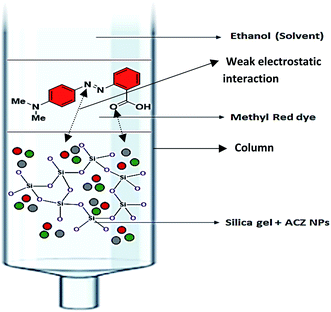 |
| | Fig. 15 Adsorption mechanism of dye of silica gel + ACZ QDs. | |
4.6 Antibacterial study of ACZ QDs
The antibacterial activity of ACZ QDs was investigated using the Agar well diffusion experiment against two bacterial strains, i.e., B. subtilis and E. coli.56 For Gram-negative and Gram-positive bacteria, the Zone of Inhibition (ZOI) in mm was measured. The ZOI (mm) of six commercial antibiotics against E. coli and B. subtilis are shown in Table 2. Table 3 demonstrates the Zone of Inhibition of ACZ QDs against Gram-positive (B. subtilis) and Gram-negative (E. coli) bacterial strains. It was discovered that ZOI increases with QDs concentration. The maximum ZOI shown by QDs at 1000 mg ml−1 was 8.85 mm and 16.06 mm for B. subtilis and E. coli, respectively. Fig. 16 shows ZOI of Hexa-disk as a controlled study on B. subtilis and (b) ZOI at different concentrations (200, 500, 800, and 1000 ppm) of ACZ QDs against B. subtilis. Fig. 17 shows (a) ZOI of Hexa-disk as a controlled study on E. coli and (b) ZOI at different concentrations (200, 500, 800, and 1000 ppm) of ACZ QDs against E. coli. ZOI observed by the QDs was comparable to six commercial antibiotics. The penetration of silver, cobalt, and zinc oxide QDs (due to small size) through bacterial protein channels present in the plasma membrane, damages genetic material, and hence impedes binary fission, is the likely mechanism of antibacterial activity shown by ACZ QDs. Hence, synthesized ACZ QDs could be used in the field of antibiotics to treat different bacterial-borne diseases.
Table 2 Zone of inhibition (mm) shown by six standard antibiotics with B. subtilis and E. coli
| Six standard antibiotics present in Hexa disc |
| Bacteria |
TE (25) |
C (25) |
P1 |
AMP 10 |
S (10) |
S3 (300) |
| B. subtilis |
23.24 |
22.03 |
26.59 |
10.02 |
16.19 |
24.72 |
| E. coli |
20.22 |
13.14 |
24.06 |
12.09 |
16.24 |
26.27 |
Table 3 Zone of inhibition in mm (ZOI) shown by ACZ QDs against B. subtilis and E. coli bacterial strain at different concentrations
| Bacterial test organism |
ACZ QDs concentration (ppm) |
| 200 |
500 |
800 |
1000 |
| B. subtilis |
7.91 mm |
7.96 mm |
8.13 mm |
8.85 mm |
| E. coli |
11.35 mm |
12.08 mm |
13.63 mm |
16.06 mm |
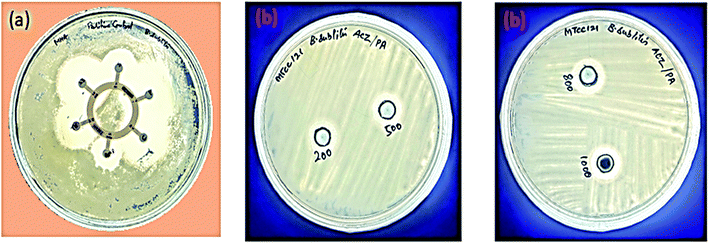 |
| | Fig. 16 (a) Zone of Inhibition (ZOI) produced by six standard antibiotics (Hexa disk) with B. subtilis and (b) Zone of Inhibition (ZOI) shown at different concentration of ACZ QDs against B. subtilis at 200, 500, 800, 1000 ppm concentrations. | |
 |
| | Fig. 17 (a) Zone of Inhibition (ZOI) produced by six standard antibiotics (Hexa disk) with E. coli and (b) Zone of Inhibition (ZOI) shown at different concentrations of ACZ QDs against E. coli at 200, 500, 800, 1000 ppm concentrations. | |
4.7 Thermogravimetric analysis
The thermal stability of ACZ QDs decorated PANI NCs was checked by the differential scanning calorimetry (DSC). Fig. 18 shows the DSC curve of ACZ QDs decorated PANI NCs. The DSC curve of PANI NCs shows one exothermic peak and three endothermic peaks. The exothermic peak was observed at a peak temperature of 147.56 °C with an enthalpy change of 235.78 J g−1 having onset and ending temperatures of 125.35 °C and 152.94 °C, respectively. This exothermic peak corresponds to the enthalpy of melting (ΔH = 235.78 J g−1) of ACZ decorated PANI NCs. The enthalpy of melting of pure PANI is 230.84 J g−1. This increase in enthalpy of melting of PANI NCs as compared to pure PANI represents an increase in the thermal stability of NCs. The first endothermic peak was observed at a peak temperature of 231.04 °C with an enthalpy change of 17.93 J g−1 having onset and ending temperatures of 233.62 °C and 242.52 °C, respectively. The first endothermic peak (231.04 °C) corresponds to the glass transition temperature (Tg) of PANI NCs. A slight variation in glass transition of PANI NCs as compared to pure PANI (188.85 °C) represents an increase in thermal stability of PANI NCs as compared to pure PANI which is due to the presence of decorated ACZ QDs in the PANI framework.57 The second endothermic peak was observed at a peak temperature of 300.31 °C with an enthalpy change of 34.63 J g−1 having onset and ending temperatures of 280.51 °C and 314.99 °C, respectively. The third endothermic peak was observed at a peak temperature of 436.76 °C with an enthalpy change of 30.18 J g−1 having an onset and ending temperature of 352.56 °C and 487.69 °C, respectively.
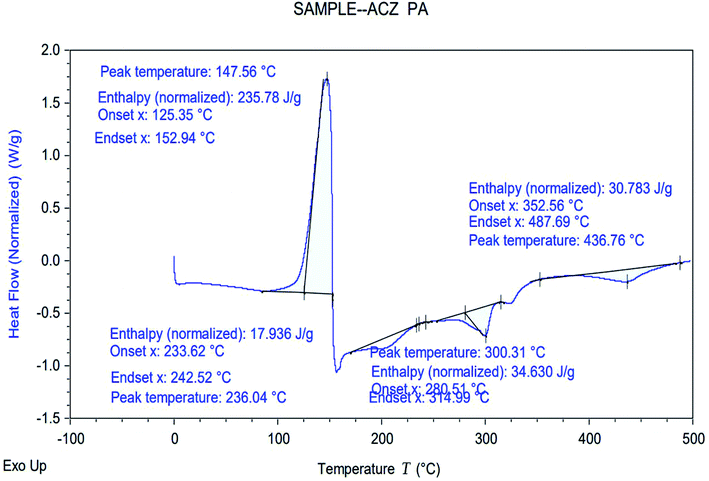 |
| | Fig. 18 Differential Scanning Calorimetric (DSC) study of ACZ QDs decorated PANI NCs. | |
5. Theoretical (DFT) study
The computational study (DFT) was performed by Gaussian09 and the Material studio package. Fig. 19 shows the HOMO and LUMO optical bandgap between NCs and was found to be 2.92 eV. The optical band gap was comparable to the UV-visible study (Eg = 2.75 eV). The HOMO and LUMO tell us the presence of adsorption sites in the NCs. Fig. 20 depicts van der Waals surface and Electron Density Distribution per atom of the NCs. Tables 4 and 5 show the DFT parameters of ACZ/PANI NCs. The adsorption energy, metal/NCs interaction energy, electrochemical potential, softness, and hardness are the important DFT parameters that help in evaluating the mechanism of adsorption and inhibition.
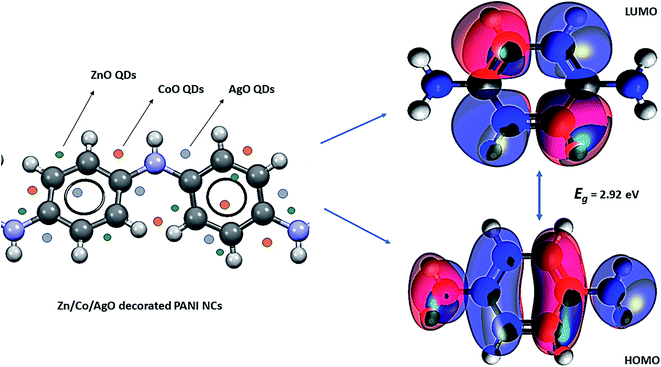 |
| | Fig. 19 Lowest unoccupied molecular orbital (LUMO) and highest occupied molecular orbital (HOMO) of Zn/Co/AgO QDs decorated PANI NCs [iso-surface: colored; density → SCF (self-consistent field); potential → Coulomb potential SCF; iso-value = 0.05, iso-value range = −0.1 to 0.1; spin = α]. | |
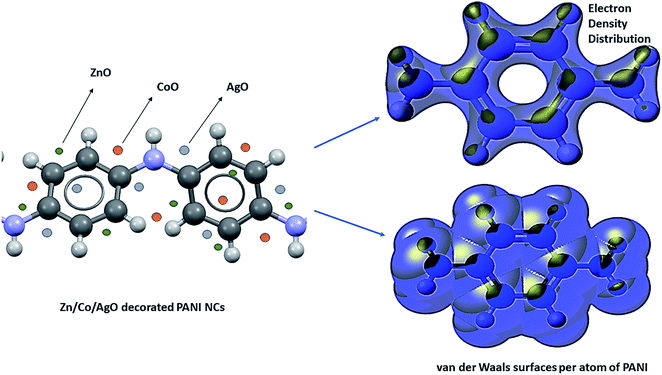 |
| | Fig. 20 Electron density distribution (EDD) and van der Waals surfaces per atom of Zn/Co/AgO decorated PANI NCs [iso-surface: colored; density → SCF (self-consistent field); potential → Coulomb potential SCF; iso-value = 0.05, iso-value range = −0.1 to 0.1; spin = α]. | |
Table 4 Computational parameters of ACZ decorated PANI NCs by Gaussian09 program. The standard basis set used B3LYP, and exchanged functional 6-31G(d) (6D,7F)
| ΔE (eV) |
I (eV) |
A (eV) |
χ (eV) |
η (eV) |
σ (eV−1) |
ΔN (eV) |
EAd (kJ mol−1) |
ω+ (au) |
ω− (au) |
ΔΨ (−eV) |
| 2.92 |
6.23 |
3.21 |
4.72 |
1.46 |
0.68 |
1.113 |
5.32 |
0.127 |
0.142 |
0.412 |
Table 5 Computational parameters of ACZ decorated PANI NCs observed by the Gaussian09 program. Standard basis set: B3LYP, and Exchange functional: 6-31G-d(6D,7F)
| Dipole moment (D) |
Quadrupole moment (xy axis) |
KE of symmetry A′ |
Molecular mass (amu) |
Internal energy, E (thermal) kcal mol−1 |
Heat capacity, CV (cal mol−1 K−1) |
Entropy, S (cal mol−1 K−1) |
Thermal correction to E (Hartree per particle) |
Thermal correction to enthalpy, H (Hartree per particle) |
Thermal correction to G (Hartree per particle) |
| 0.0012 |
−34.31 |
1.037 × 10³ |
108.047 |
84.37 |
22.62 |
81.64 |
0.231 |
0.246 |
0.147 |
The DFT study for ACZ decorated PANI NCs was carried out by eqn (3)–(10)58–62
| |
 | (3) |
| |
 | (4) |
| |
 | (5) |
| |
 | (6) |
| |
 | (7) |
| |
 | (8) |
| |
 | (9) |
| |
 | (10) |
Significant internal energy, heat capacity, and entropy shows that the ACZ decorated PANI NCs are highly energetic and hence possess a strong affinity for adsorption on MS (Table 5).63–65 The same was confirmed by high electrochemical potential, global hardness, and softness parameters (Table 4). Significant adsorption energy (5.32 kJ mol−1), electron releasing, and electron-donating capacity proves a strong coordinate bond with MS which in reverse donate its pπ electrons to vacant d-orbitals of Fe (MS). A similar study was observed in the weight loss study, i.e., CIE increases with the concentration of NCs which signifies an increase in adsorption power with NCs concentration.
6. Conclusions
In situ approach was adopted for synthesizing ACZ QDs decorated PANI NCs. The ACZ QDs and ACZ decorated PANI NCs were characterized by TEM, FESEM, FTIR, UV, DSC, Raman, and XRD techniques. Seven applications i.e., adsorption, magnetic, photocatalytic, conducting, antibacterial, heat resistive, and anticorrosive properties of QDs decorated PANI NCs were explored. The NCs show a maximum of 82% CIE for MS. The optical band observed from UV and computational techniques were comparable. The antibacterial properties of the ACZ QDs were found comparable to six commercial antibiotics. The adsorption power of a column packed with ACZ QDs increases six times to a pure silica gel-packed column. The magnetic susceptibility of ACZ decorated PANI NCs (χ = 0.01221) indicates that the synthesized NCs are paramagnetic. The thermal stability of ACZ decorated PANI NCs was investigated by the DSC technique. The PANI NCs show very good thermal stability and hence can act as heat resistive material. The ACZ decorated PANI NCs show very good anticorrosive, photocatalytic, thermal stability, antibacterial, electrical conductivity, paramagnetic, and adsorptive material. Hence, the synthesized NCs have huge potential in different fields like magnetic storage tapes, anticorrosive agents, photocatalytic agents (purification of impure water by degrading organic pollutants), electronic devices, and antibacterial for curing disease, catalytic convertors, thermally stable nanomaterials.
Data availability
The raw data will be made available as per request.
Author contributions
Ankita Yadav: methodology; writing – original draft; formal analysis; validation. Harish Kumar: data curation; supervision; conceptualization; formal analysis; resources; software; investigation; validation; writing – review & editing. Rahul Sharma: formal analysis; validation. Rajni Kumari: formal analysis; validation. Mony Thakur: investigation; validation.
Conflicts of interest
We declare no conflict of interest in this article.
Acknowledgements
We acknowledge the infrastructural support and laboratory facility provided by CUH, M.Garh for this research work.
References
- T. A. Skotheim, R. L. Elsenbaumer and J. R. Reynolds, Handbook of conducting polymers, Marcel Dekker, New York, 1998 Search PubMed.
- G. Gustafsson, Y. Cao, G. M. Treacy, F. Klavetter, N. Colaneri and A. Heeger, Nature, 1992, 357, 477 CrossRef CAS.
- M. J. Sailor, E. J. Ginsburg, C. B. Gorman, A. Kumar, R. H. Grubbs and N. S. Lewis, Sci, 1990, 249, 1146 CrossRef CAS PubMed.
- X. Jiang, X. Zhao, L. Duan, H. Shen, H. Liu, T. Hou and F. Wang, Ceram. Int., 2016, 42, 15160–15165, DOI:10.1016/j.ceramint.2016.05.098.
- L. Yosefi and M. Haghighi, Appl. Catal., B, 2018, 220, 367, DOI:10.1016/j.apcatb.2017.08.028.
- S. Anitha, M. Suganya, D. Prabha, J. Srivind, S. Balamurugan and A. R. Balu, Mater. Chem. Phys., 2018, 211, 88, DOI:10.1016/j.matchemphys.2018.01.048.
- H. Kumar, R. Rani, A. Yadav, R. Sharma and R. Kumari, Chem. Data Collect., 2020, 29, 100527, DOI:10.1016/j.cdc.2020.100527.
- T. Kitani, K. Akashi, S. Sugimoto and S. Ito, Synth. Met., 2001, 121, 1301 CrossRef.
- A. Drelinkiewicz, M. Hasik and M. Kloc, Catal. Lett., 2000, 64, 41 CrossRef CAS.
- Z. Q. Tian, Y. Z. Lian, J. Q. Wang, S. J. Wang and W. H. Li, J. Electroanal. Chem., 1991, 308, 357 CrossRef CAS.
- H. Yue, A. Shujaa, S. A. Sarhan, Z. Bin, Z. Yaping, L. Xianggao and F. Yaqing, RSC Adv., 2021, 11, 20760–20768, 10.1039/D1RA02683F.
- D. Sankar, S. Arnab, K. Kanika, G. Gautam and J. Subhra, Dalton Trans., 2020, 49, 6790–6800, 10.1039/D0DT01054E.
- V. Raquel, B. M. Mar, R. Laura, L. Manchado and A. Miguel, Mater. Chem., 2011, 21, 3301–3310, 10.1039/C0JM02708A.
- P. T. Radford and S. E. Creager, Anal. Chim. Acta, 2001, 449, 199 CrossRef CAS.
- K. Dutta, S. Das, D. Rana and P. P. Kundu, Polym. Rev., 2015, 55, 1–56 CrossRef CAS.
-
(a) A. Guerfi, J. Trottier, I. Boyano, I. De Meatza, J. Blazquez, S. Brewer, K. Ryder, A. Vijh and K. Zaghib, J. Power Sources, 2014, 248, 1099–1104 CrossRef CAS;
(b) Y. Zhang, Y. Zhao, A. Konarov, D. Gosselink, H. G. Soboleski and P. Chen, J. Power Sources, 2013, 241, 517–521 CrossRef CAS.
-
(a) M. Naseri, L. Fotouhi, A. Ehsani and H. M. Shiri, J. Colloid Interface Sci., 2016, 484, 308–313 CrossRef CAS PubMed;
(b) A. Ehsani, H. M. Shiri, E. Kowsari, R. Safari, J. Torabian and S. Hajghani, J. Colloid Interface Sci., 2017, 490, 91–96 CrossRef CAS PubMed;
(c) M. Naseri, L. Fotouhi, A. Ehsani and S. Dehghanpour, J. Colloid Interface Sci., 2016, 484, 314–319 CrossRef CAS PubMed.
-
(a) T. Otero, J. Martinez and J. Arias-Pardilla, Electrochim. Acta, 2012, 84, 112–128 CrossRef CAS;
(b) C. F. de Lannoy, D. Jassby, D. Davis and M. Wiesner, J. Membr. Sci., 2012, 415, 718–724 CrossRef.
- Y. Xia, K. Sun and J. Ouyang, Adv. Mater., 2012, 24, 2436–2440 CrossRef CAS PubMed.
- H. Bagheri, Z. Ayazi and M. Naderi, Anal. Chim. Acta, 2013, 767, 1–13 CrossRef CAS PubMed.
- K. Saranya, M. Rameez and A. Subramania, Eur. Polym. J., 2015, 66, 207–227 CrossRef CAS.
- M. Ates, Mater. Sci. Eng., C, 2013, 33, 1853–1859 CrossRef CAS PubMed.
- L. Yang, S. Liu, Q. Zhang and F. Li, Talanta, 2012, 89, 136–141 CrossRef CAS PubMed.
- J. Liang, M. Wei, Q. Wang, Z. Zhao, A. Liu, Z. Yu and Y. Tian, Anal. Lett., 2018, 51, 512–522 CrossRef CAS.
- S. Mazhar, U. Y. Qazi, N. Nadeem, M. Zahid, A. Jalil, F. Khan, I. Ul-Hasan and I. Shahid, Environ. Sci. Pollut. Res., 2022, 29(6), 9203–9217 CrossRef CAS PubMed.
- A. Yadav, H. Kumar, R. Sharma and R. Kumari, Colloid Interface Sci. Commun., 2021, 40, 100339, DOI:10.1016/j.colcom.2020.100339.
- A. K. Vishwakarma, B. S. Yadav, J. Singh, S. Sharma and N. Kumar, Mater. Today Commun., 2022, 31, 103229 CrossRef CAS.
- J. Iqbal, S. Bashir, M. O. Ansari, R. Jafer, A. Jilani, S. Mohammad, K. Ramesh and S. Ramesh, Advances in Supercapacitor and Supercapattery, 2021, vol. 141 Search PubMed.
- H. Hind, S. Amal, B. Wafaa, A. Mohamed and B. Noureddine, J. Compos. Sci., 2021, 5, 233 CrossRef , https://www.mdpi.com/2504-<?pdb_no 477X?>477X<?pdb END?>/5/9/233.
- H. Kebiche, F. P. Epaillard, N. Haddaoui and D. Debarnot, J. Mater. Sci., 2020, 55(14), 5782–5794 CrossRef CAS , https://www.ff10.1007/s10853-020-04406-yff.ffhal-03015936f.
- S. Sugam and V. Supriya, Int. J. Res. Sci. Innov., 2017, 4, 86–89 Search PubMed.
- M. El Rhazi, S. Majid and M. Elbasri, et al., Int. Nano Lett., 2018, 8, 79–99, DOI:10.1007/s40089-018-0238-2.
- F. M. Zahed, B. Hatamluyi, F. Lorestani and Z. Es'haghi, J. Pharm. Biomed. Anal., 2018, 161, 12–19, DOI:10.1016/j.jpba.2018.08.004.
- B. Goswami and D. Mahanta, ACS Omega, 2021, 6(27), 17239–17246, DOI:10.1021/acsomega.1c00983.
- S. Ebrahim, A. Shokry and M. M. A. Khalil, Sci. Rep., 2020, 10, 13617, DOI:10.1038/s41598-020-70678-8.
- S. Azza, E. T. Ayman, I. Hesham, S. Moataz and E. Shaker, RSC Adv., 2019, 9, 39187–39200, 10.1039/C9RA08298K.
- S. Azza, E. T. Ayman, I. Hesham, S. Moataz and E. Shaker, Desalin. Water Treat., 2019, 171, 205, DOI:10.5004/dwt.2019.24835.
- M. A. Raza, Z. Kanwal, A. Rauf, A. N. Sabri, S. Riaz and S. Naseem, Nanomater, 2016, 6, 74, DOI:10.3390/nano6040074.
- S. Gurunathan, Arabian J. Chem., 2014, 12, 168–180, DOI:10.1016/j.arabjc.2014.11.014.
- P. A. Zapata, L. Tamayo, M. Paez, ́ E. Cerda, I. Azocar and F. M. Rabagliati, Eur. Polym. J., 2011, 47, 1541–1549, DOI:10.1016/j.eurpolymj.2011.05.008.
- W. D. Sheibley and M. H. Fowler, Infrared spectra of various metal oxides in the region of 2 to 26 microns, Lewis Research Center, Ohio, Virginia, 2016 Search PubMed.
- Y. Teng, S. Yamamoto, Y. Kusano, M. Azuma and Y. Shimakawa, Mater. Lett., 2010, 64, 239–242 CrossRef CAS.
- K. Sivakumar, S. V. Kumar, J. J. Shim and Y. Haldorai, Synth. React. Inorg., Met.-Org., Nano-Met. Chem., 2014, 44, 1414–1420, DOI:10.1080/15533174.2013.809743.
- A. Bouarissa, A. Gueddim, N. Bouarissa and S. Djellali, Polym. Bull., 2017, 75, 3023–3033, DOI:10.1007/s00289-017-2189-6.
- J. Zhang, D. Shan and S. J. Mu, J. Polym. Sci., Part A: Polym. Chem., 2007, 45, 5573–5582, DOI:10.1002/pola.22303.
- J. I. Langford and A. J. C. Wilson, J. Appl. Crystallogr., 1978, 11, 102–113, DOI:10.1107/S0021889878012844.
- S. S. Challa and R. Kumar, Raman Spectroscopy for characterization of nanomaterials, Springer, Heidelberg, Dordrecht, London, New York, 2012, DOI:10.1007/978-3-642-20620-7.
- G. Gouadec and P. Colomban, Prog. Cryst. Growth Charact. Mater., 2007, 53, 1–56, DOI:10.1016/j.pcrysgrow.2007.01.001.
- A. S. Dorcheh, R. N. Durham and M. C. Galetz, Sol. Energy Mater. Sol. Cells, 2016, 144, 109–116, DOI:10.1016/j.solmat.2015.08.011.
- M. A. Deyab, Corros. Sci., 2014, 80, 359–365, DOI:10.1016/j.corsci.2013.11.056.
- A. Beran, E. Libowitzky and T. Armbruster, Can. Mineral., 1996, 34, 803–809 CAS.
- M. Gregory, M. L. Allison, S. R. Nicholas and Z. L. Hans-Conrad, J. Am. Chem. Soc., 2017, 139, 14743–14748 CrossRef PubMed.
- A. Alipour, M. Lakouraj and H. Tashakkorian, Sci. Rep., 2021, 11, 1913, DOI:10.1038/s41598-020-80038-1.
- M. Baibarac, A. Matea, M. Daescu, I. Mercioniu, S. Quillard, J. Y. Mevellec and S. Lefrant, Sci. Rep., 2018, 8, 9518, DOI:10.1038/s41598-018-27769-4.
- A. Shokry, M. M. A. Khalil, H. Ibrahim, M. Soliman and S. Ebrahim, Sci. Rep., 2019, 9(1), 16984, DOI:10.1038/s41598-019-53584-6.
- B. Sharma and N. Vasudeva, Int. J. Pharm. Sci. Res., 2016, 7, 34–41 Search PubMed.
- M. Porramezan and H. Eisazadeh, Composites, Part B, 2011, 42(7), 1980–1986, DOI:10.1016/j.compositesb.2011.05.029.
- R. G. Parr and R. G. Pearson, J. Am. Chem. Soc., 1983, 105, 7512–7516, DOI:10.1021/ja00364a005.
- K. Rajam, S. Rajendran and R. Saranya, J. Chem., 2013, 743807, 1–4, DOI:10.1155/2013/743807.
- S. K. Saha, A. Hens, A. R. Chowdhury, A. K. Lohar, N. C. Murmu and P. Banerjee, Can. Chem. Trans., 2014, 2, 489–503, DOI:10.13179/canchemtrans.2014.02.04.0137.
- S. K. Saha, P. Ghosh, A. Hens, N. C. Murmu and P. Banerjee, Phys. E, 2015, 66, 332–341, DOI:10.1016/j.physe.2014.10.035.
- W. Xiufang, S. Yuhua, X. Anjian and C. Shaohua, Mater. Chem. Phys., 2013, 140, 487–492, DOI:10.1016/j.matchemphys.2013.03.058.
- L. Pauling, The Nature of the Chemical Bond, Cornell University Press, New York, 1960 Search PubMed.
- M. Shanmugam, A. Alsalme, A. Alghamdi and R. Jayavel, ACS Appl. Mater. Interfaces, 2015, 7, 14905–14911, DOI:10.1021/acsami.5b02715.
- L. Singh and V. Singh, J. Polym. Eng., 2020, 40(8), 657–665, DOI:10.1515/polyeng-2020-0047.
|
| This journal is © The Royal Society of Chemistry 2022 |
Click here to see how this site uses Cookies. View our privacy policy here.  Open Access Article
 a,
Harish Kumar
 *a,
Rahul Sharma
 a,
Rajni Kumari
 a and
Mony Thakur
 b
b
![[thin space (1/6-em)]](https://www.rsc.org/images/entities/char_2009.gif) :
:![[thin space (1/6-em)]](https://www.rsc.org/images/entities/char_2009.gif) 4. The Sol B was mixed with Sol A dropwise with continuous stirring (600 rpm) at 70 °C. After 6 h, a light brown color appeared. The precipitates were washed with distilled water and then acetone. The precipitates were dried at 70 °C for 6 h and stored in a glass vial.
4. The Sol B was mixed with Sol A dropwise with continuous stirring (600 rpm) at 70 °C. After 6 h, a light brown color appeared. The precipitates were washed with distilled water and then acetone. The precipitates were dried at 70 °C for 6 h and stored in a glass vial.
![[double bond, length as m-dash]](https://www.rsc.org/images/entities/char_e001.gif) C stretching peak was observed at 1488 cm−1.
C stretching peak was observed at 1488 cm−1.

![[double bond, length as m-dash]](https://www.rsc.org/images/entities/char_e001.gif) C and C
C and C![[double bond, length as m-dash]](https://www.rsc.org/images/entities/char_e001.gif) N double bond in the structure of PANI. A triplet near 1400 cm−1 represents a complex pattern due to C–C and C–N bonds present in PANI. The broader peaks and pattern of bands in the Raman spectra prove somewhat amorphous character of PANI.
N double bond in the structure of PANI. A triplet near 1400 cm−1 represents a complex pattern due to C–C and C–N bonds present in PANI. The broader peaks and pattern of bands in the Raman spectra prove somewhat amorphous character of PANI.


![[thin space (1/6-em)]](https://www.rsc.org/images/entities/char_2009.gif) :
:![[thin space (1/6-em)]](https://www.rsc.org/images/entities/char_2009.gif) 1 ratio of silica gel and ACZ decorated PANI NCs, we first investigated the adsorption power of ACZ decorated PANI NCs. However, dye and PANI caused color interference. The adsorption power of ACZ QDs combined with silica gel was then examined. We didn't detect any color interference here. In ethanol solvent, the column was loaded with a 3
1 ratio of silica gel and ACZ decorated PANI NCs, we first investigated the adsorption power of ACZ decorated PANI NCs. However, dye and PANI caused color interference. The adsorption power of ACZ QDs combined with silica gel was then examined. We didn't detect any color interference here. In ethanol solvent, the column was loaded with a 3![[thin space (1/6-em)]](https://www.rsc.org/images/entities/char_2009.gif) :
:![[thin space (1/6-em)]](https://www.rsc.org/images/entities/char_2009.gif) 1 ratio of silica gel and ACZ QDs. The column's performance was evaluated using methyl red dye. The column was loaded with silica gel and silica gel + ACZ QDs as shown in Fig. 14. The methyl red dye flows out of the silica gel column in 30 min (Fig. 14a). The column's adsorption power increases (200 min) by replacing some fraction of silica gel with ACZ QDs as compared to a pure silica gel column (Fig. 14b). The small size and wide surface area of ACZ QDs were responsible for dye adsorption resulting in an increase in adsorption power. As a result, a blended silica gel + ACZ QDs column can be used instead of a traditional silica gel column. Fig. 15 shows adsorption mechanism of dye of silica gel + ACZ QDs. There is a possibility of weak electrostatic interaction between nitrogen and oxygen hetero atoms of dye with highly energetic ACZ QDs. This increases the time of flow of ethanol solvent through the column and hence adsorption power of column increases significantly by the inclusion of ACZ QDs in the column. Adsorption science and column chromatography will be revolutionized by the use of QDs in the column.
1 ratio of silica gel and ACZ QDs. The column's performance was evaluated using methyl red dye. The column was loaded with silica gel and silica gel + ACZ QDs as shown in Fig. 14. The methyl red dye flows out of the silica gel column in 30 min (Fig. 14a). The column's adsorption power increases (200 min) by replacing some fraction of silica gel with ACZ QDs as compared to a pure silica gel column (Fig. 14b). The small size and wide surface area of ACZ QDs were responsible for dye adsorption resulting in an increase in adsorption power. As a result, a blended silica gel + ACZ QDs column can be used instead of a traditional silica gel column. Fig. 15 shows adsorption mechanism of dye of silica gel + ACZ QDs. There is a possibility of weak electrostatic interaction between nitrogen and oxygen hetero atoms of dye with highly energetic ACZ QDs. This increases the time of flow of ethanol solvent through the column and hence adsorption power of column increases significantly by the inclusion of ACZ QDs in the column. Adsorption science and column chromatography will be revolutionized by the use of QDs in the column.


