
 Open Access Article
 This Open Access Article is licensed under a Creative Commons Attribution-Non Commercial 3.0 Unported Licence
Quantitative prediction of CeO2 and LaAlO3 infrared spectra based on first-principles calculations
Guangpu Luo a,
Wenyue Zhaoab,
Hongbo Guo*cd and
Shengkai Gong*a
a,
Wenyue Zhaoab,
Hongbo Guo*cd and
Shengkai Gong*a
aResearch Institute for Frontier Science, Beihang University, Beijing 100191, China. E-mail: gongsk@buaa.edu.cn
bKey Laboratory of Aerospace Materials and Performance (Ministry of Education), Beihang University, Beijing 100191, China
cSchool of Materials Science and Engineering, Beihang University, Beijing 100191, China. E-mail: guo.hongbo@buaa.edu.cn
dKey Laboratory of High-Temperature Structural Materials and Protective Coatings (Ministry of Industry and Information Technology), Beihang University, Beijing 100191, China
First published on 24th August 2022
Abstract
Oxide crystals with specific infrared spectra are widely used in the optical energy industry. Conventional density functional theory calculations reveal various properties of oxide crystals, including their electronic band structure, electronic density of states, vibrational modes, phonon band structure, and phonon density of states, but only provide qualitative analyses of infrared spectra. Herein, we provide a theoretical approach to analyzing how the basic mechanisms of infrared absorption are affected by the above properties and then predicting quantitatively the infrared spectra. The derivation and details of this method are clarified, and the CeO2 and LaAlO3 infrared spectra are finally calculated through an application. The calculated infrared properties are in good agreement with previously reported experiments, demonstrating the accuracy of our method. This study provides a less expensive approach to identifying the infrared spectra of oxide crystals through the use of theoretical calculations and is potentially applicable in the optical energy industry, improving the efficiency by which appropriate materials can be selected.
1 Introduction
Oxide crystals with specific infrared spectra play a key role in the optical energy industry. Solar panels better utilize materials that effectively absorb visible and near-infrared light and rarely emit radiation in the mid-infrared or far-infrared range. The radiative cooling surface requires high emissivity in the 3–5 μm and 8–14 μm range, as infrared radiation in this range can easily travel in air. Moreover, an energy-saving coating is required to absorb the majority of thermal radiation from the high-temperature oven. According to Wien's law, an oven operated at 600–1200 °C has a radiation peak at 2.0–3.5 μm. Absorption and radiation share similar mechanisms as forward and reverse processes. The discussion below focuses on infrared absorption but is also applicable to infrared radiation. The growing industry motivates research in the discovery of suitable appropriate infrared materials. These materials include oxide crystals, which have attracted widespread interest due to their ease of synthesis and stability at high temperatures.In recent years, a great amount of cost has been paid towards investigating the infrared properties of various materials by experimentation. Alternatively, theoretical analysis can reduce these costs. Since 1965,1,2 first-principles calculations based on density functional theory (DFT) have undergone rapid development. These first-principles calculations have been applied in multiple industries with desirable results. DFT calculations used in the investigation of oxide crystals provide properties such as electronic band structure, electronic density of states (DOS), molecular vibrational modes, phonon band structure, and phonon DOS. However, conventional DFT analyses only provide qualitative results of the infrared spectra. When the electronic band structure and the electronic DOS were investigated, the narrow band gap and high density of the free carriers indicated strong infrared absorption. All modes that may influence infrared absorption were provided when the molecular vibrational modes were investigated. These molecular vibrational modes are compared with the experimental infrared spectra to determine which were infrared active. In addition, the phonons on transverse optical branches were found to affect infrared absorption when the phonon band structure and phonon DOS were investigated. A theoretical method combined with first-principles calculations and basic mechanisms of infrared absorption is presented further in the paper, which provides quantitative predictions of the infrared spectra of oxide crystals.
Four basic mechanisms result in infrared absorption within the wavelength range of 0.3–14.0 μm: intrinsic absorption, exciton absorption, free-carrier absorption, and lattice absorption.3 For semiconductors at temperatures lower than −200 °C, an exciton absorption spectrum is rarely found near an intrinsic absorption spectrum. Considering the industrial requirements, only the infrared spectra of oxide crystals at 0–1200 °C were investigated and exciton absorption was considered negligible. In our method, intrinsic absorption was obtained from the quantitative analyses of the electronic band structure and the electronic DOS. Free-carrier absorption was affected by phonons, electronic band structure, and electronic DOS, while lattice absorption consists of molecular vibrational absorption and phonon absorption. Compared with conventional analyses, our method adds a step to identify the infrared activity of the molecular vibrational modes and quantitatively predicts the infrared absorption peaks and their amplitudes.
The derivation and details of our method are introduced in the Computational methodology section. Then, the infrared spectra of CeO2 and LaAlO3 as calculated by our method are described in the Result and discussion section. The calculated spectra are in good agreement with previously reported experimental results. Our method accurately provides the infrared properties of oxide crystals without the dependence of experiments, with promising applicability in the efficient selection of oxide crystals with high efficiency and related research.
2 Computational methodology
The DFT-based first-principles calculations were performed using the Vienna Ab initio Simulation Package (VASP).4–8 In all calculations, plane-wave pseudopotential approximation was applied with the generalized gradient approximation (GGA) Perdew–Burke–Ernzerhof (PBE) exchange functional.9–11 The properties of the phonons were calculated by VASP and using PHONOPY code based on the finite displacement method and the supercell approach.12,13 The Hessian matrix was determined with density-functional perturbation theory (DFPT).Considering practical applications, we only considered an infrared spectrum with a wavelength range of 0.3–14.0 μm. Most solar energy is distributed around 0.5 μm, the wavelengths of the thermal radiation peaks of objects at 0–1200 °C range from 2.0 to 10.6 μm, and infrared radiation can travel in air for long distances when its wavelength is 3–5 μm or 8–14 μm. Thus, a spectrum with a wavelength range of 0.3–14.0 μm covers all the necessary infrared radiations and absorptions.
2.1 Conventional density functional theory (DFT) results of ABO
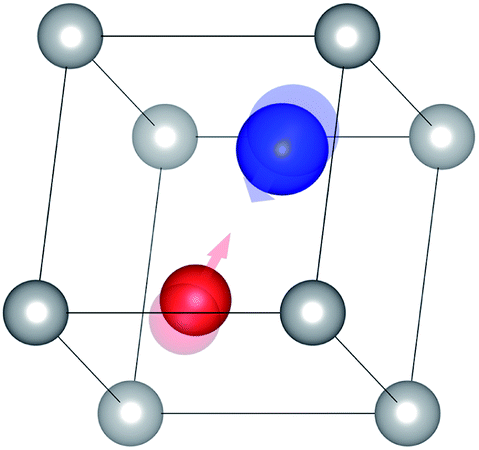
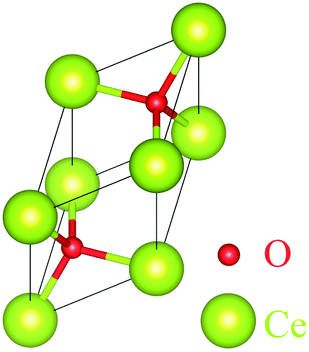
Assume that there exists a simple hypothetical oxide crystal ABO whose unit cell is a cube (Fig. 1).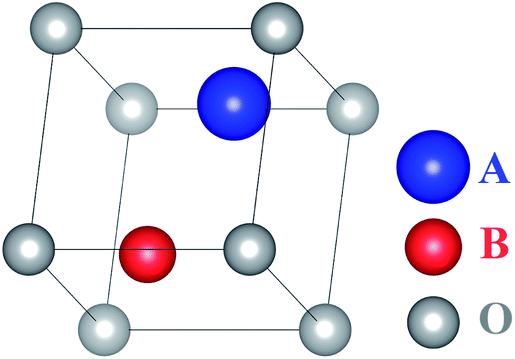 | ||
| Fig. 1 Molecular geometry of the hypothetical oxide crystal ABO. | ||
The first-principles calculations provide the electronic DOS and electronic band structure indicated in Fig. 2, the molecular vibrational modes are depicted in Fig. 3, and the band DOS and band structure of the phonons are shown in Fig. 4.
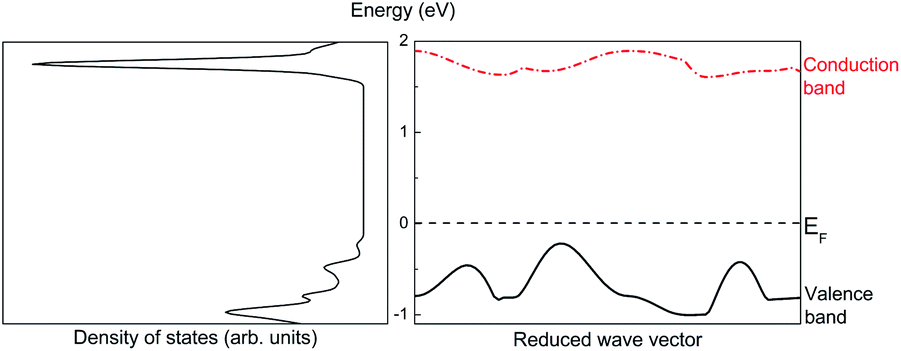 | ||
| Fig. 2 Density of states (left) and band structure (right) of ABO. | ||
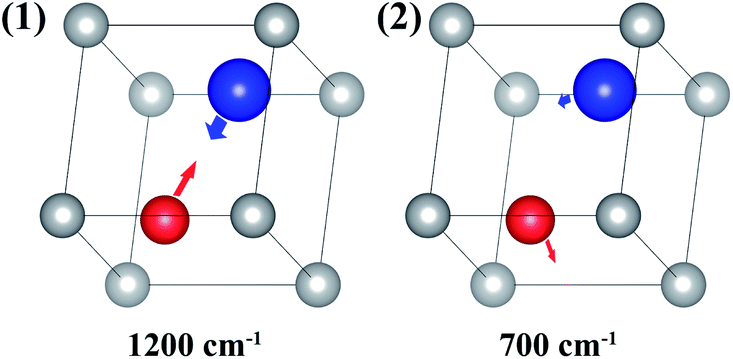 | ||
| Fig. 3 Two molecular vibrational modes of ABO; the vectors represent the eigenvector of the vibrational modes. | ||
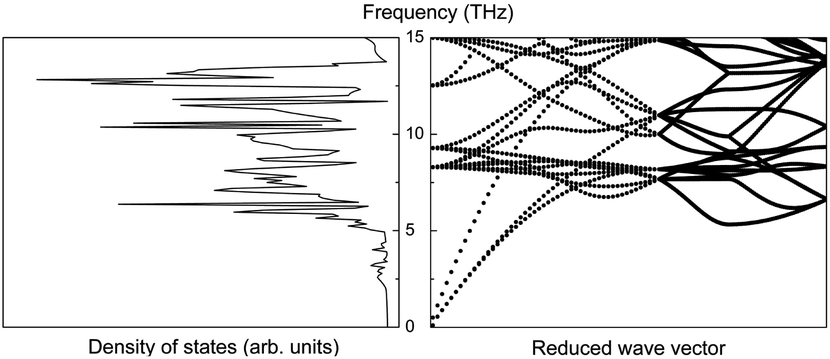 | ||
| Fig. 4 Phonon density of states (left) and phonon band structure (right) of ABO. | ||
It is assumed that ABO has two molecular vibrational modes with eigenvalues of 1200 and 700 cm−1, respectively.
2.2 Theoretical infrared spectra of ABO
Our method predicts the infrared spectra based on the results of the calculations shown above. The method individually considers the influence of the basic mechanisms of infrared absorption (i.e., intrinsic absorption, free-carrier absorption, and lattice absorption).To simplify the analysis, we considered only two transitions that would lead to intrinsic absorptions. The intrinsic absorptions of ABO are depicted in Fig. 5. The valence band is located below the Fermi level and is fully occupied by valence electrons, while the conduction band is located above the Fermi level and is not occupied. If a photon is absorbed by an electron occupied at state |i〉 on the valence band, a transition occurs, and the electron occupies another state |j〉 on the conduction band. Considering that a photon transfers at a momentum negligibly small relative to the size of the Brillouin zone, the conservation of momentum leads to ki = kj. This equation indicates a “vertical transition”, which is also known as a “direct transition”. Direct transitions are the primary process since indirect transitions occur with much smaller probabilities. Energy is conserved via the transition, so Ephoton = Eη = Ej − Ei.
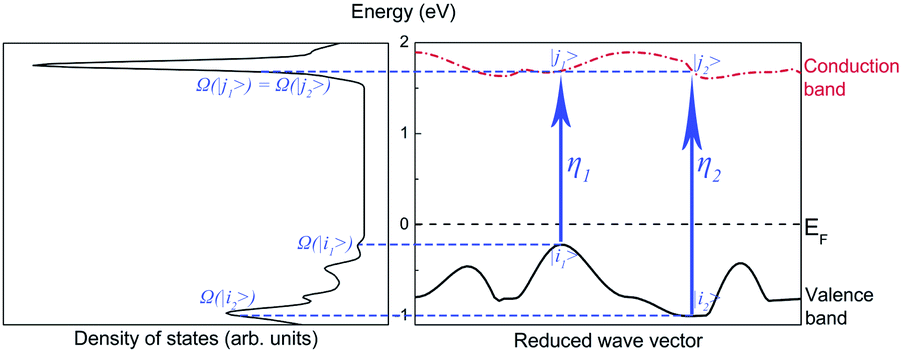 | ||
| Fig. 5 Intrinsic absorptions of ABO. | ||
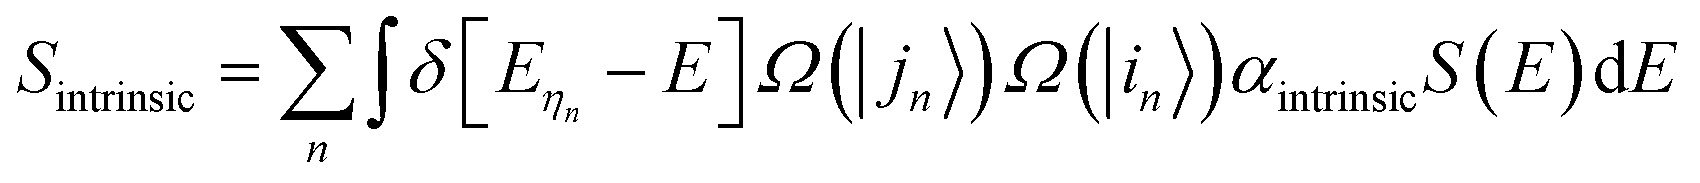
Assuming that ηn represents a direct transition from a state |in〉 at the valence band to a state |jn〉 at the conduction band, the intrinsic absorption spectrum Sintrinsic is defined as:
 | (1) |
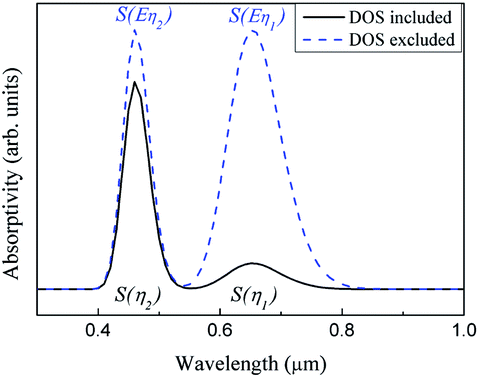 | ||
| Fig. 6 Infrared spectra of the intrinsic absorption of ABO. | ||
 | (2) |
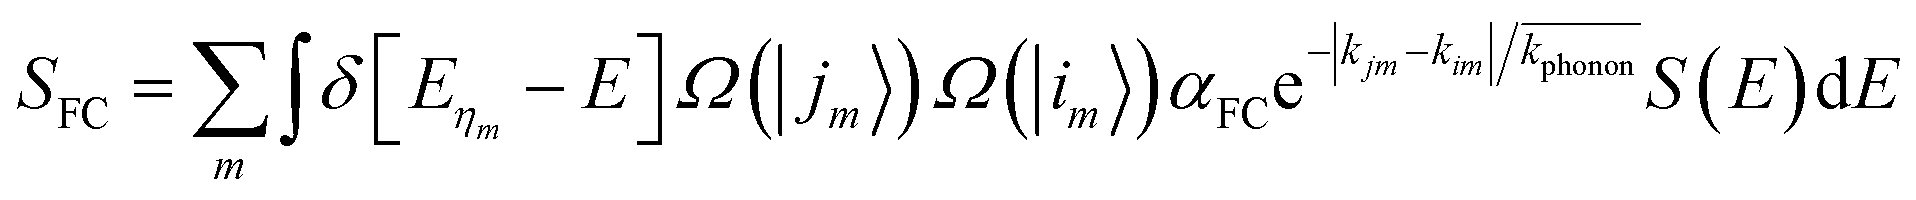
 is the average momentum of the phonons. Five interband transitions were observed to influence the free-carrier absorption of ABO, and the SFC of ABO is depicted in Fig. 7.
 | ||
| Fig. 7 Infrared spectrum of the free-carrier absorption of ABO. | ||
(1) The electric dipole moment of the original molecular structure is calculated and marked as Poriginal.
(2) The molecular structure is then modified by taking the eigenvector of the vibrational mode as a perturbation (Fig. 8).
 | ||
| Fig. 8 Molecular structure modified by the eigenvector of the vibrational mode shown in Fig. 3(1); the transparent atoms indicate their original positions. | ||
(3) Finally, the electric dipole moment of the modified molecular structure is calculated and marked as Pmodified. The change in the electric dipole moment is the difference between Poriginal and Pmodified.
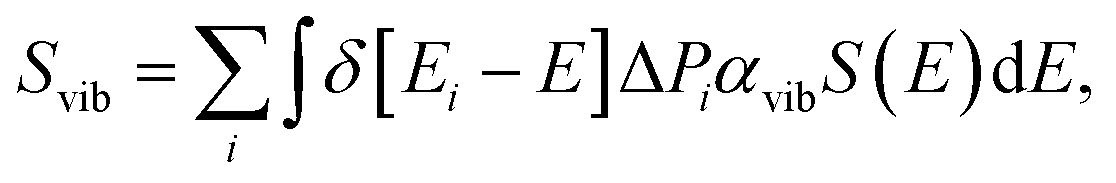
The molecular vibrational absorption spectrum Svib is defined as:
 | (3) |
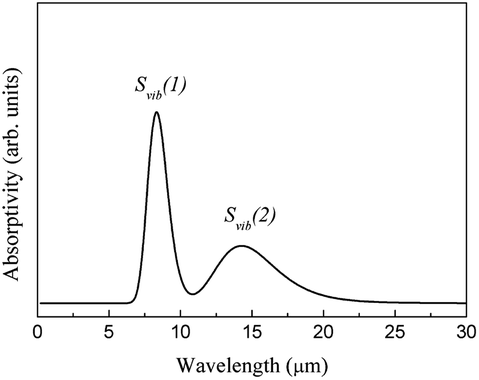 | ||
| Fig. 9 Infrared spectrum of the molecular vibrational absorption of ABO. | ||
The phonon band structure of a lattice consists of multiple branches. A phonon of frequency fphonon on a transverse optical branch can absorb a photon of the same frequency. The phonon absorption spectrum Sphonon can be defined as follows:
 | (4) |
The integral over possible frequencies of phonons can be calculated, where Ω(f) is the phonon density of states with frequency f. The Sphonon of ABO is depicted in Fig. 10.
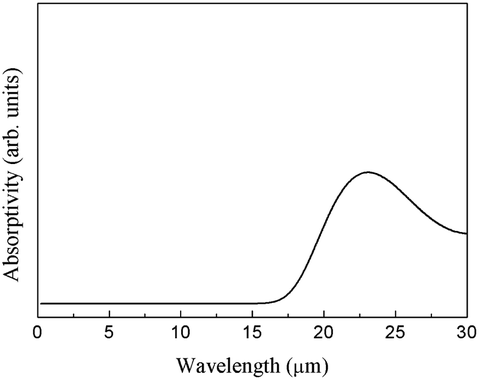 | ||
| Fig. 10 Infrared spectrum of the phonon absorption of ABO. | ||
A combined infrared spectrum of ABO was then obtained through the summation of previous results (Fig. 6–10) Fig. 11.
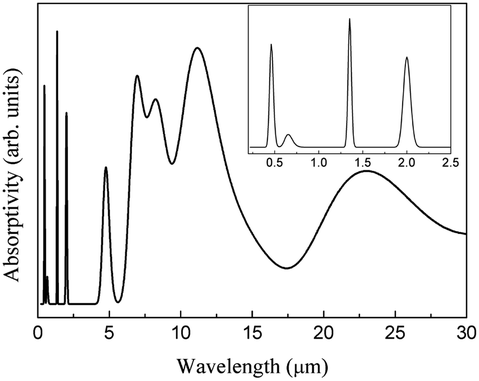 | ||
| Fig. 11 Theoretical ABO infrared spectrum. | ||
3 Results and discussion
3.1 CeO2 infrared spectra
 | ||
| Fig. 12 Optimized molecular structure of CeO2. | ||
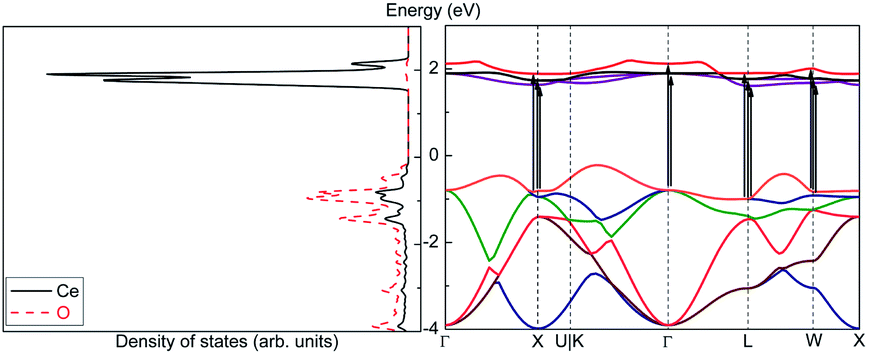 | ||
| Fig. 13 Density of states (left) and band structure (right) of CeO2. | ||
The molecular vibrational modes of CeO2 were calculated when the width of the displacement of each ion was set as ±0.02 Å. Finite differences were used to calculate the second derivatives and Hessian matrix (Table 1).
| Vibrational mode | 1 | 2 | 3 | 4 | 5 | 6 |
| Wavenumber (cm−1) | 435.57 | 435.36 | 435.35 | 275.29 | 275.03 | 275.00 |
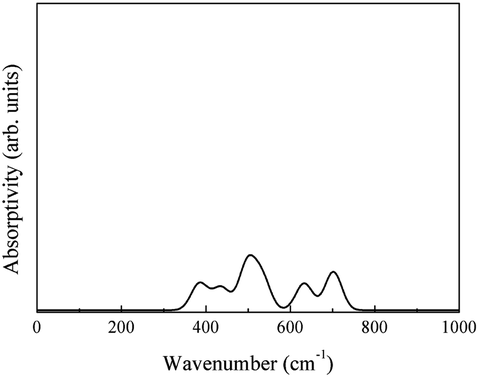
The phonon properties of CeO2 were calculated using a 4 × 4 × 2 supercell. The cut-off energy for the plane-wave basis set was 500 eV, the convergence criterion for SCF energy was 10−8 eV, and a Monkhorst–Pack k-mesh size of 5 × 5 × 5 was used in the full Brillouin zone. The phonon density of states and phonon band structure are shown in Fig. 14.
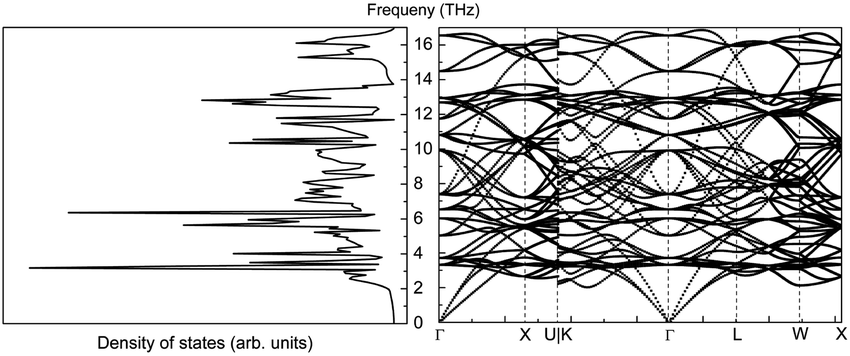 | ||
| Fig. 14 Phonon density of states (left) and phonon band structure (right) of CeO2. | ||
 | ||
| Fig. 15 Infrared spectrum of the intrinsic absorption of CeO2. | ||
Similarly, the free-carrier absorption infrared spectrum was calculated using eqn (2) (Fig. 16).
 | ||
| Fig. 16 Infrared spectrum of the free-carrier absorption of CeO2. | ||
Changes in the electric dipole moment of different molecular vibrational modes are listed in Table 2.
| Vibrational mode | 1 | 2 | 3 | 4 | 5 | 6 |
| Wavenumber (cm−1) | 435.57 | 435.36 | 435.35 | 275.29 | 275.03 | 275.00 |
| Change in the electric dipole moment (arb. units) | 0.004 | 0.006 | 0.004 | 2.460 | 2.458 | 2.461 |
The molecular vibrational absorption infrared spectrum was calculated using eqn (3) (Fig. 17).
 | ||
| Fig. 17 Infrared spectrum of the molecular vibrational absorption of CeO2. | ||
The phonon absorption infrared spectrum was calculated using eqn (4) (Fig. 18).
 | ||
| Fig. 18 Infrared spectrum of the phonon absorption of CeO2. | ||
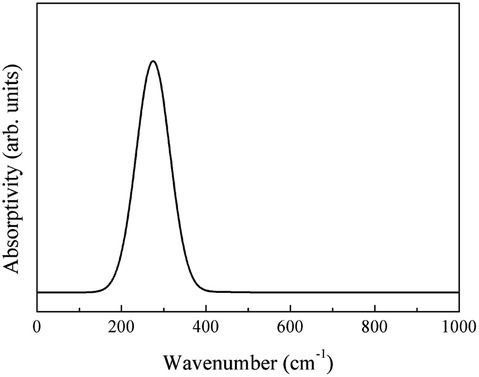
The theoretical CeO2 infrared spectrum is depicted in Fig. 19.
 | ||
| Fig. 19 Theoretical infrared spectra of CeO2. | ||
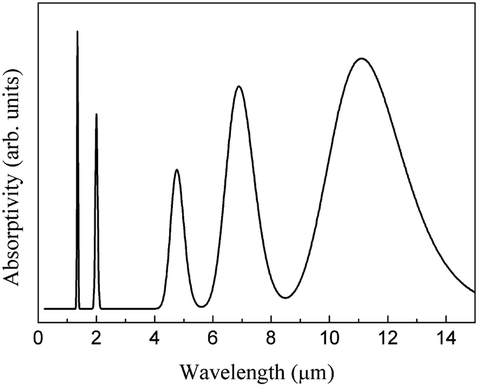
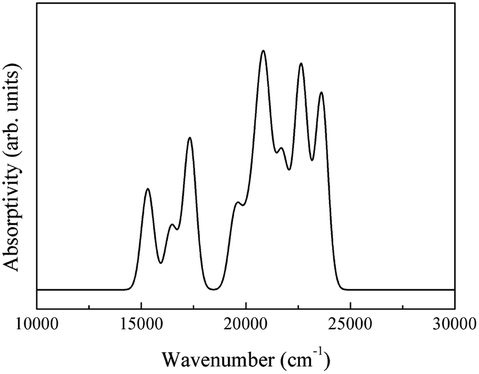
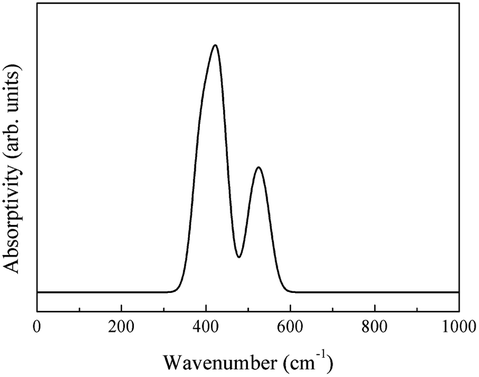
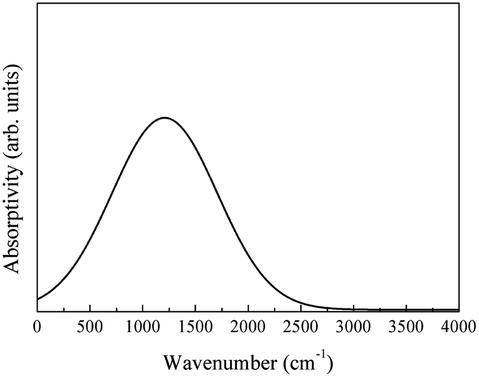
The spectra obtained from calculations and an experimental report are shown in Fig. 20.16
 | ||
| Fig. 20 (a) Theoretical infrared spectrum of CeO2 and (b) experimental infrared spectrum of CeO2 cited from ref. 16 with permission. | ||
The theoretical spectrum is in good agreement with the reported spectrum. The infrared absorption peaks of CeO2 are located at 450 cm−1 and near cm−1 (Fig. 20(a)). The peak near 1200 cm−1 splits and a smaller branch with a higher frequency appears. The shapes of peaks are similar to those found in Fig. 20(b), with the peak near 1200 cm−1 shifting by about 200 cm−1. An obvious difference between the spectra is the broad absorption peak at 3425 cm−1 (Fig. 20(b)). This absorption peak can be ascribed to the O–H group from impurities during synthesis.16 It is not within the scope of this work to include the infrared dependence of impurities, thus the absence of the peak at 3525 cm−1 was not analyzed further. The experimental absorption properties can be obtained by broadening and shifting the peaks near 1200 cm−1 towards higher frequencies (Fig. 20(a)). Our calculations present the experimental infrared spectra of CeO2 with accuracy.
3.2 Infrared spectra of LaAlO3
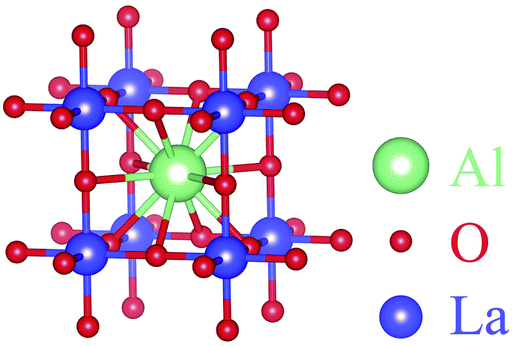 | ||
| Fig. 21 Optimized molecular structure of LaAlO3. | ||
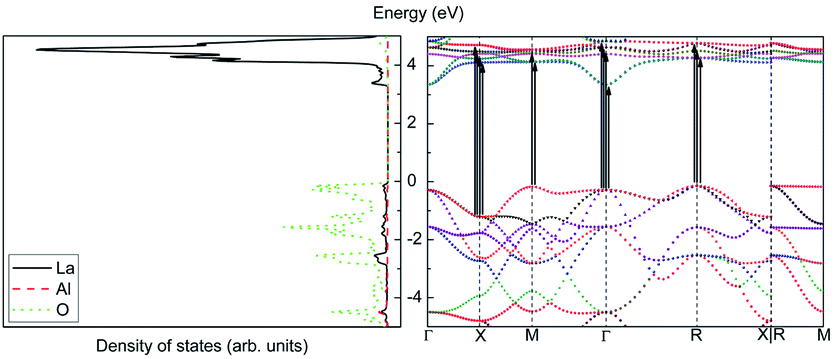 | ||
| Fig. 22 Density of states (left) and band structure (right) of LaAlO3. | ||
The molecular vibrational modes of LaAlO3 were calculated with the same procedure as for CeO2 (Table 3).
| Vibrational mode | 1 | 2 | 3 | 4 | 5 | 6 | 7 | 8 | 9 | 10 | 11 | 12 |
| Wavenumber (cm−1) | 645.98 | 645.95 | 645.84 | 401.87 | 401.85 | 401.77 | 271.39 | 271.31 | 271.11 | 133.14 | 133.12 | 132.84 |
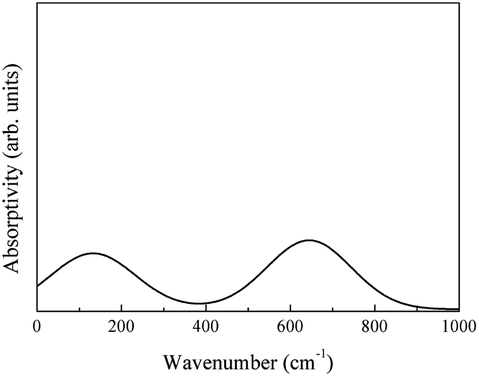
The phonon properties of LaAlO3 were calculated for a 2 × 2 × 2 supercell and a 3 × 3 × 3 Monkhorst–Pack k-mesh. The phonon density of states and phonon structure are depicted in Fig. 23.
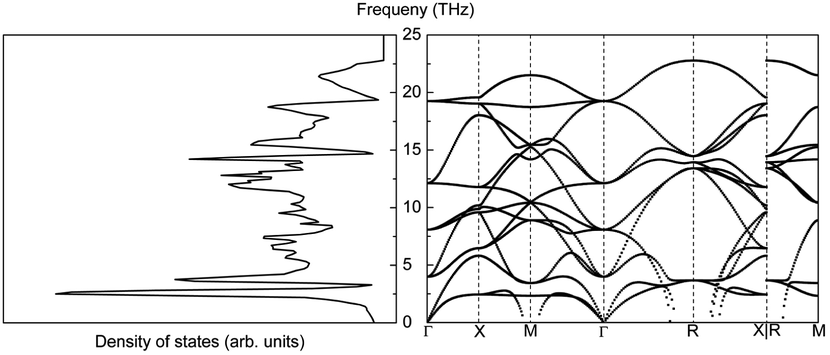 | ||
| Fig. 23 Phonon density of states (left) and phonon band structure (right) of LaAlO3. | ||
 | ||
| Fig. 24 Infrared spectrum of the intrinsic absorption of LaAlO3. | ||
The free-carrier absorption of LaAlO3 originates from the highest valence band. The spectrum of the free-carrier absorption SFC was calculated using eqn (2) (Fig. 25).
 | ||
| Fig. 25 Infrared spectrum of the free-carrier absorption of LaAlO3. | ||
Changes in the electric dipole moment (ΔP) of different molecular vibrational modes of LaAlO3 are listed in Table 4.
| Vibrational mode | 1 | 2 | 3 | 4 | 5 | 6 | 7 | 8 | 9 | 10 | 11 | 12 |
| Wavenumber (cm−1) | 645.98 | 645.95 | 645.84 | 401.87 | 401.85 | 401.77 | 271.39 | 271.31 | 271.11 | 133.14 | 133.12 | 132.84 |
| ΔP (arb. units) | 11.507 | 11.507 | 11.507 | 0.183 | 0.183 | 0.183 | 0 | 0 | 0 | 9.339 | 9.339 | 9.339 |
The molecular vibrational absorption spectrum Svib was calculated using eqn (3) (Fig. 26).
 | ||
| Fig. 26 Infrared spectrum of the molecular vibrational absorption of LaAlO3. | ||
The phonon absorption spectrum Sphonon was calculated by eqn (4) (Fig. 27).
 | ||
| Fig. 27 Infrared spectrum of the phonon absorption of LaAlO3. | ||
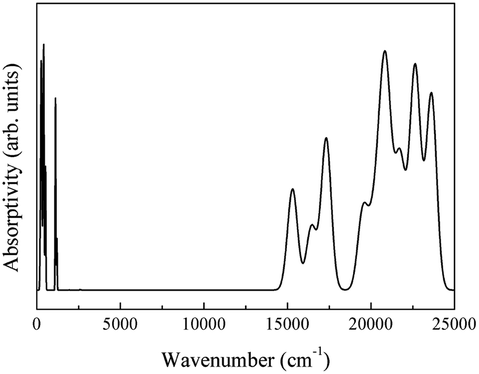
Finally, the complete theoretical LaAlO3 spectrum is presented in Fig. 28.
 | ||
| Fig. 28 Theoretical spectra of LaAlO3. | ||
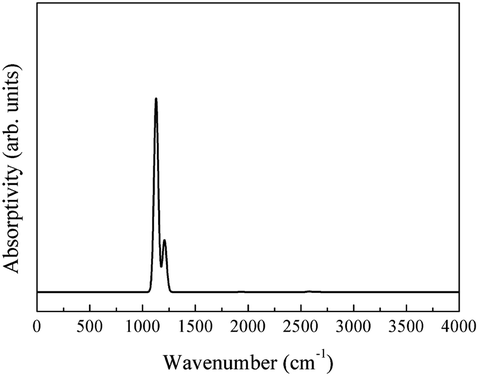
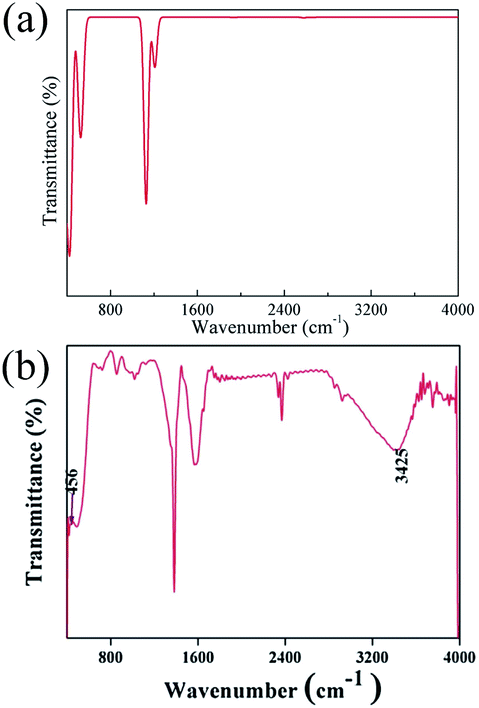
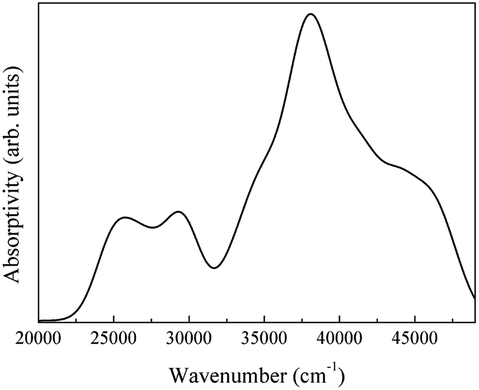
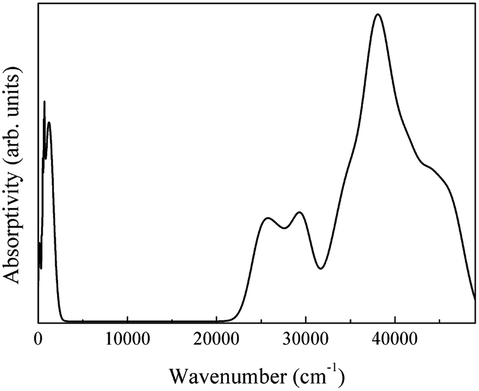
The calculated and experimental infrared spectra of LaAlO3 are shown in Fig. 29.17
 | ||
| Fig. 29 (a) Theoretical infrared spectra of LaAlO3 and (b) experimental infrared spectra of LaAlO3 cited from ref. 17 with permission. | ||
The theoretical spectrum is in good agreement with the reported spectrum. The absorptivity is high at 0.3 μm and 4–14 μm. The absorptivity decreases slightly when the wavelength is 14 μm. The spectrum shown in Fig. 29(b) can be reproduced by broadening the absorption peaks observed in Fig. 29(a). Overall, the experimental infrared properties of LaAlO3 were in good agreement with our calculations.
4 Conclusion
In this study, we have used a new theoretical method to predict quantitatively the infrared spectra of oxide crystals with high accuracy.First, the principles and derivations of the method were shown, with a hypothetical oxide crystal ABO used as an example. Conventional DFT calculations were applied in the analysis of ABO, revealing properties including the electronic band structure, electronic DOS, molecular vibrational modes, phonon band structure, and phonon DOS would be provided. Based on these properties, our calculations predicted the spectra caused by basic mechanisms including intrinsic absorption, free-carrier absorption, molecular vibrational absorption, and phonon absorption. Intrinsic absorption was determined by the interband transitions of electrons; free-carrier absorption was determined by the transitions of electrons in one partially occupied band, in which phonons are involved; molecular vibrational absorption was determined by the vibrational modes changing the electric dipole moments; phonon absorption was determined by phonons on the transverse optical branches. The theoretical infrared spectra of ABO were presented through the summation of the spectra of different mechanisms.
The method was verified by comparing the theoretical and experimental CeO2 and LaAlO3 spectra. The theoretical spectra of CeO2 successfully reproduced the experimental spectra, with similar shapes in the characteristic absorption peaks at 450 and 1200 cm−1. Two differences hindered the accuracy of our method. At 1200 cm−1, the frequency of the absorption peak in the theoretical spectrum differs from the peak in the experimental spectrum by nearly 200 cm−1 and was ascribed to a mathematical error in the first-principles calculations. The absorption peak in the experimental spectrum at 3425 cm−1, which was likely caused by impurities during synthesis, is absent in the theoretical spectrum. For LaAlO3, the theoretical and experimental spectra are in good agreement. Moreover, both the thin absorptivity peak at 0.3 μm and the broad absorptivity peak at 4–14 μm are similar. In all, the method successfully provided a rapid and accurate preview of the infrared spectra of oxide crystals.
This method sheds light on the theoretical investigation of the infrared properties of oxide crystals. The only initial requirement for our method is the molecular structure of the oxide crystal. Theoretical spectra that are in good agreement with the experimental results can then be provided. Applying this method in the initial assessment of materials will reduce the cost of numerous experiments, improving the efficiency of material screening.
There are still problems with this method. Even though the characteristic CeO2 and LaAlO3 peaks are accounted for in the theoretical spectra, the exact positions of these peaks differ slightly from the experimental peaks. The method works well for CeO2 and LaAlO3, whose unit cells are both small and simple but is less accurate in predicting the peaks for larger complex oxide crystals. Future studies aim to solve these problems. The equations used in this methodology would account for more complex models to carry out the mechanisms more precisely. Different calculation conditions and exchange functionals in the DFT calculations will be tested to improve the accuracy of the proposed method. The ignored parts in the analyses of basic mechanisms, such as the exciton absorption and indirect interband transitions, will be reintroduced to provide more detailed results. The improved method aims to be more accurate and practicable for future studies.
Author contributions
Guangpu Luo: conceptualization, data curation, formal analysis, investigation, methodology, resources, software, validation, visualization, and writing – original draft. Wenyue Zhao: methodology and software. Hongbo Guo: conceptualization, funding acquisition, project administration, supervision, validation, and writing – review & editing. Shengkai Gong: conceptualization, funding acquisition, project administration, supervision, validation, and writing – review & editing.Conflicts of interest
The authors declare that they have no known competing financial interests or personal relationships that could have appeared to influence the work reported in this paper.Acknowledgements
This research has been sponsored by Science Center for Gas Turbine Project (P2021-A-IV-001-003) and the National Natural Science Foundations of China no. 52101117. The high performance computing resources at Beihang University is also acknowledged for providing supercomputing time. The authors would like to thank TopEdit (https://www.topeditsci.com) for its linguistic assistance during the preparation of this manuscript.References
- P. Hohenberg and W. Kohn, Phys. Rev., 1964, 136, B864–B871 CrossRef.
- W. Kohn and L. J. Sham, Phys. Rev., 1965, 140, A1133–A1138 CrossRef.
- K. Huang and R. Q. Han, Solid State Physics, Higher Education Press, Beijing, 1st edn, 1991 Search PubMed.
- G. Kresse and J. Hafner, Phys. Rev. B: Condens. Matter Mater. Phys., 1993, 47, 558–561 CrossRef CAS PubMed.
- G. Kresse and J. Furthmüller, Comput. Mater. Sci., 1996, 6, 15–50 CrossRef CAS.
- G. Kresse and J. Furthmüller, Phys. Rev. B: Condens. Matter Mater. Phys., 1996, 54, 11169–11186 CrossRef CAS PubMed.
- V. Wang, N. Xu, J.-C. Liu, G. Tang and W.-T. Geng, Comput. Phys. Commun., 2021, 267, 108033 CrossRef CAS.
- Y. Hinuma, G. Pizzi, Y. Kumagai, F. Oba and I. Tanaka, Comput. Mater. Sci., 2017, 128, 140–184 CrossRef CAS.
- G. Kresse and J. Hafner, J. Phys.: Condens. Matter, 1994, 6, 8245–8257 CrossRef CAS.
- G. Kresse and D. Joubert, Phys. Rev. B: Condens. Matter Mater. Phys., 1999, 59, 1758–1775 CrossRef CAS.
- J. P. Perdew, K. Burke and M. Ernzerhof, Phys. Rev. Lett., 1996, 77, 3865–3868 CrossRef CAS PubMed.
- A. Togo and I. Tanaka, Scr. Mater., 2015, 108, 1–5 CrossRef CAS.
- J. Neugebauer and T. Hickel, Wiley Interdiscip. Rev.: Comput. Mol. Sci., 2013, 3, 438–448 CAS.
- M. J. Weber, Phys. Rev., 1968, 171, 283–291 CrossRef CAS.
- L. A. Riseberg and H. W. Moos, Phys. Rev., 1968, 174, 429–438 CrossRef CAS.
- P. Latha, P. Kasirajan and S. Karuthapandian, Optik, 2017, 154, 242–250 CrossRef.
- Z. Han, X. Li, J. Ye, L. Kang, Y. Chen, J. Li and Z. Lin, J. Am. Ceram. Soc., 2015, 98, 2336–2339 CrossRef CAS.
| This journal is © The Royal Society of Chemistry 2022 |