
 Open Access Article
 This Open Access Article is licensed under a Creative Commons Attribution-Non Commercial 3.0 Unported Licence
Preparation of solvent-free starch-based carbon dots for the selective detection of Ru3+ ions†
Menglin Chenab,
Can Liu *c,
Jichao Zhaic,
Yulong Anc,
Yan Lic,
Yunwu Zhengc,
Hao Tiand,
Rui Shib,
Xiahong Heb and
Xu Lin*ab
*c,
Jichao Zhaic,
Yulong Anc,
Yan Lic,
Yunwu Zhengc,
Hao Tiand,
Rui Shib,
Xiahong Heb and
Xu Lin*ab
aYunnan Key Laboratory of Wood Adhesives and Glued Products National Joint Engineering Research Center for Highly-Efficient Utilization of Forest Biomass Resources, Southwest Forestry University, 300 Bailong Road, Kunming 650224, Yunnan Province, China. E-mail: linxunefu@126.com
bKey Laboratory for Forest Resources Conservation and Utilization in the Southwest Mountains of China, Ministry of Education, Southwest Forestry University, Kunming, China
cNational Joint Engineering Research Center for Highly-Efficient Utilization Technology of Forestry Resources, Southwest Forestry University, Kunming, China
dAgro-products Processing Research Institute, Yunnan Academy of Agricultural Sciences, Kunming, China
First published on 28th June 2022
Abstract
A simple, green, and solvent-free pyrolysis method for the preparation of starch-based carbon dots (CDs) was developed. The CDs prepared at 300 °C exhibited a highest quantum yield of 21.0%, which was mainly due to the high degree of graphitisation of the CDs. The CDs were selective for the detection of Ru3+ ion solutions.
Heavy metal ions are essential to human social and life activities. The rapid development of the mining, chemical and metal smelting industries has resulted in negative impacts on the environment, such as water pollution, and metal ions are particularly harmful pollutants.1 Ruthenium is a platinum group metal with excellent chemical stability and catalytic properties and therefore is suitable for a wide range of applications in the electronic, electrical and electrochemical industries.2 However, with the extensive use of ruthenium, industrial effluents containing ruthenium are discharged into the environment, causing environmental pollution and accumulation in living organisms, thus posing a risk to human health, especially to the skin and eyes.3 The environmental requirements for ruthenium emissions are more stringent than those for other elements, but the detection of ruthenium has been less well reported. Therefore, there is an urgent need for a greener, more sensitive and simpler detection method.
In recent years, fluorescent probes have become a hot topic of research due to their high sensitivity, selectivity and ease of use. As one of the more important properties of carbon dots (CDs), fluorescence detection has received considerable attention in recent years. CDs can be used for the fluorescence analysis of different objects, e.g., metal ions,4 nonmetal ions,5 organic small molecules6 and others.7 Metal ions are highly efficient in quenching the fluorescence of CDs, allowing the concentration of the metal ions to be determined within a certain range and thus enabling the quantitative detection of metal ions in real water samples.
Scientific researchers have gradually introduced the concept of green and environmental protection into the preparation and application of CDs, etc8. Although there are a wide variety of mechanisms of action and sources of CDs, there are still many drawbacks, such as the need for strong acids, bases and toxic organic reagents; the use of time-consuming and difficult large-scale preparation; the high costs of raw materials. Therefore, the development of environmentally friendly preparation methods and the search for new green carbon sources are urgently needed for CDs. Among available carbon sources, starch is widely found in various plants in nature and is a readily available, low-cost, renewable and environmentally friendly raw material.9 Starch is a polysaccharide consisting of glucose units and is abundant in plant seeds, tubers and roots. Starch is also rich in hydroxyl groups, which is beneficial for increasing the quantum yield (QY) of CDs.10 Starch has a large specific surface area, which facilitates the formation of CDs.11,12 Therefore, starch is a good raw material for the preparation of CDs. Solvent-free preparation of CDs is a simple, clean and inexpensive method of synthesis. This method does not use toxic dopants, and the preparation process and steps are environmentally sustainable. The prepared CDs have good water solubility and can be directly applied for the detection of metal ions in aqueous environments.
Herein, we report a method for the preparation of fluorescent carbon dots using biomass (starch) by solvent-free pyrolysis. As the biomass can be incompletely charred or burnt to ash when charred at different temperatures, using 50 °C as a temperature gradient, the temperature range for starch charcoal is 250 ∼ 350 °C. After biomass carbon black was obtained, it was added to ethanol, extracted for a period of time and purified to obtain a yellow carbon dot solution with bright blue fluorescence under 365 nm ultraviolet light excitation (Fig. 1). These CDs were named CD-(250 ∼ 350). To differentiate them from those prepared via the traditional hydrothermal method, the CDs prepared by starch hydrothermal methods are called CDs-hydro. No blue fluorescence was observed at pyrolysis temperatures below 250 °C or above 350 °C for starch. These carbon dots are simple, quick, and inexpensive to produce; the ethanol solution used for extraction is reusable, and the carbon dots react surprisingly well to Ru3+, making them strong candidates for metal ion detection.
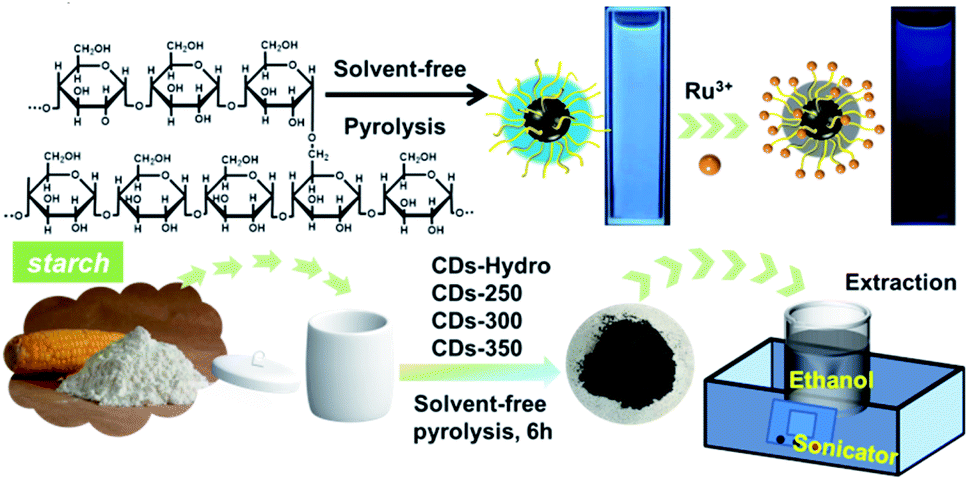 | ||
| Fig. 1 The synthesis route of starch-based CDs by solvent-free pyrolysis. | ||
The pyrolysis reactions of starch were characterised by thermogravimetric analysis and mass spectrometry (TGA-MS) (Fig. S1†). This sample released weakly physically adsorbed water and volatiles at all temperatures above 100 °C. As shown in Fig. S1a,† the starch lost most of its weight from 250 to 400 °C, with an initial decomposition temperature of 250 °C. In this temperature range, the polysaccharide chains first underwent depolymerisation, and then the glucose rings began extensive thermal degradation, generating various gaseous products and forming solid char.13 The maximum weight loss rate of starch occurred at 310 °C. The volatile fractions were analysed in real time by mass spectrometry, and the four main small-molecule gas products were detected at m/z = 15 (CH3), m/z = 18 (H2O), m/z = 28 (CO) and m/z = 44 (CO2) (m represents the number of protons, and z represents the charge).14 Gaseous products such as CO2, CO, H2O and CH3 increased when the temperature was in the range of 250 ∼ 400 °C. The elimination of the four small molecules mentioned above occurred in starch at approximately 320 °C, which is consistent with the temperature at which the maximum weight loss rate occurred. At temperatures below 200 °C, only small amounts of H2O and CO were present in the curve due to the release of adsorbed water and low-molecular-weight carbonyl compounds by evaporation. In this case, the dehydration between hydroxyl groups and the cleavage of glycosidic bonds lead to more significant elimination of H2O and CO, which reduces the oxygen content and promotes the formation of more graphitized structures.15
The UV/Vis absorption spectra of the CDs were measured in ethanol, as shown in Fig. 2a. In the UV region, absorption peaks at 203 ∼ 220 nm were observed for all four CDs; these peaks correspond to π–π* transitions among C![[double bond, length as m-dash]](https://www.rsc.org/images/entities/char_e001.gif) C bonds in the carbon core. The CDs-hydro show a more pronounced absorption band at approximately 275 nm, which was attributed to the π–π* transition of aromatic carbons and the n–π* transition between the sp2 domains. Unlike many previously reported CDs,16 these CDs do not give rise to an absorption band in the visible region as a result of surface defects.
C bonds in the carbon core. The CDs-hydro show a more pronounced absorption band at approximately 275 nm, which was attributed to the π–π* transition of aromatic carbons and the n–π* transition between the sp2 domains. Unlike many previously reported CDs,16 these CDs do not give rise to an absorption band in the visible region as a result of surface defects.
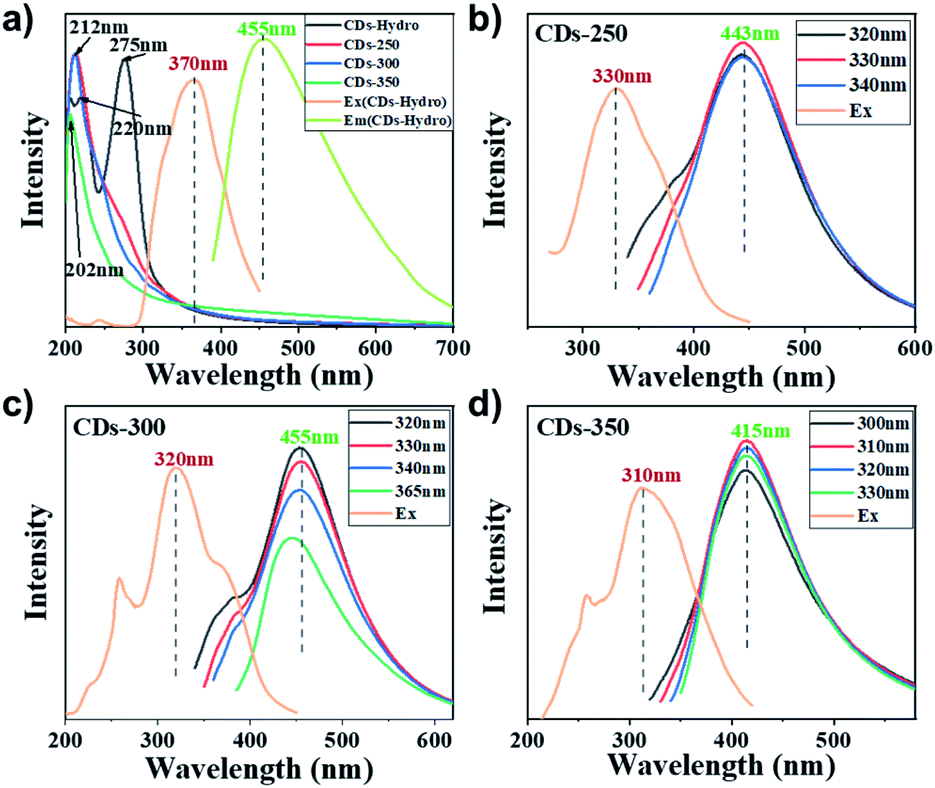 | ||
| Fig. 2 (a) UV/vis absorption spectra of CDs based on starch and PL emission spectra of CDs-hydro in ethanol solution (c = 1.0 mg mL−1). (b–d) PL emission spectra and the maximum emission spectrum of CDs-250, CDs-300 and CDs-350 in ethanol solution (c = 1.0 mg mL−1). | ||
Fig. 2b–d shows the fluorescence emission (PL) spectra of the four kinds of CDs in ethanol solution. After varying the wavelength of the excitation light, no significant excitation dependence was found in the fluorescence emission (PL) spectra of the CDs. The maximum fluorescence wavelength of these carbon dots is 415–455 nm, corresponding to blue fluorescence. The maximum fluorescence wavelength of CDs-300 is approximately 455 nm, which is consistent with the CDs prepared by hydrothermal methods. The best excitation wavelength for the solvent-free method is approximately 310 ∼ 330 nm, while the best excitation wavelength for CDs-hydro is 370 nm, which corresponds to a lower energy requirement. Different carbonisation temperatures have no significant effect on the maximum fluorescence wavelength of the CDs but have a significant effect on the fluorescence quantum yield (QY). As the carbonisation temperature increases, the QYs of these CDs first increase and then decrease. The maximum quantum yield of starch CDs was observed at 300 °C (21%). The QYs of the CDs prepared by solvent-free pyrolysis were usually higher than those of CDs prepared by hydrothermal methods (Fig. 3i). Combined with the data of QYs and TG-mass, the elimination reaction of H2O and CO are probably most closely related to the formation and fluorescence of CDs.
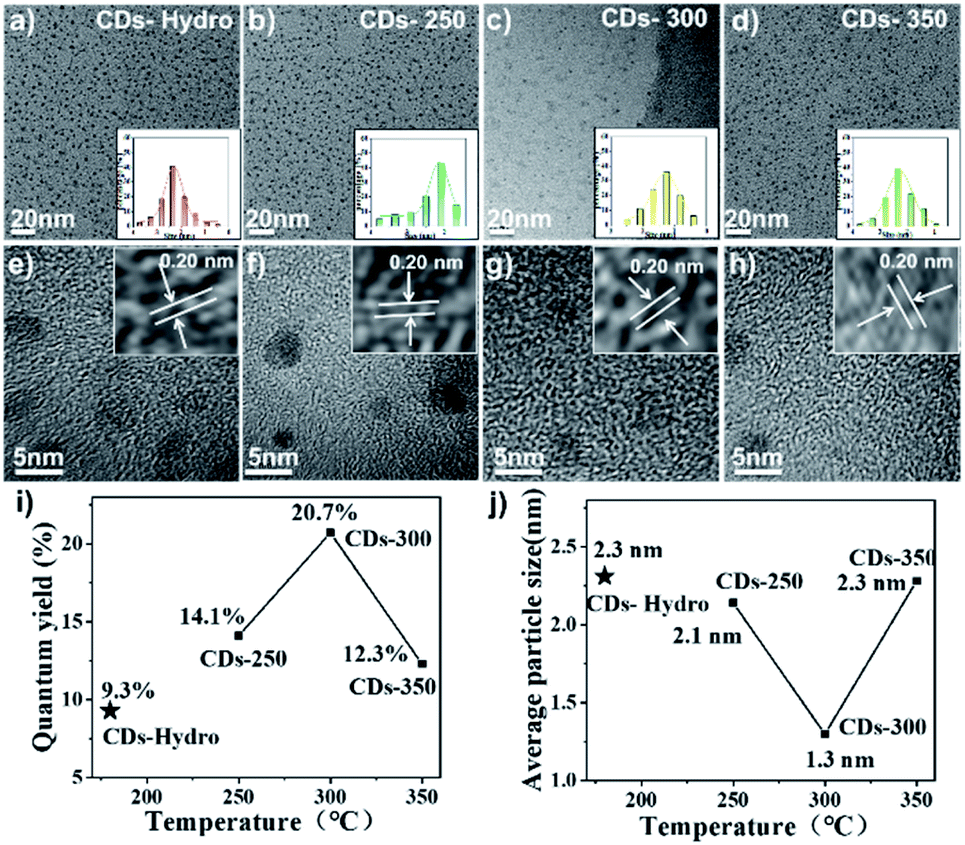 | ||
| Fig. 3 (a–d) TEM images of CDs-hydro, CDs-250, CDs-300 and CDs-350 (from left to right), inset: histograms and Gaussian fittings of particle size distribution; (e–h) HR-TEM images of CDs-hydro, CDs-250, CDs-300 and CDs-350 (from left to right). (i) Dotted line plot of CDs quantum yield versus reaction temperature. (j) Dotted line plot of average particle size of CDs versus reaction temperature. | ||
Transmission electron microscopy (TEM) is an important characterisation tool for examining the morphology of the prepared CD samples. As shown in Fig. 3a–d, the TEM images show that all CDs were dot-like with a uniform distribution and no obvious aggregation. The average particle sizes of these CDs were found to be 1.3 ∼ 2.3 nm. With increasing carbonisation temperature, the particle size first decreased and then increased. Higher QY values corresponded to smaller particle sizes of the CDs. In addition, the particle size of the CDs prepared by the solvent-free pyrolysis method was smaller than that of CDs prepared by the hydrothermal method. As shown in the high-resolution transmission electron microscopy (HR-TEM) images in Fig. 3e–h, the lattice stripe spacing was 0.20 nm, corresponding to the (100) crystal plane of graphite.17
Fourier transform infrared (FT-IR) spectroscopy is an important tool for the qualitative analysis of the surface functional groups of CDs. As seen in Fig. 4a, the prepared CDs gave rise to similar infrared peaks, indicating that they have similar surface functional groups and similar chemical compositions. The broad peak near 3447 cm−1 corresponds to the O–H stretching vibration, and it can be inferred that the presence of hydrophilic groups on the surface of the CDs makes them effectively soluble in solvents such as water and ethanol and that aqueous solutions of CDs are also more stable. This provides the basis for the detection of metal ions in the water column near the CDs. Their IR spectra showed absorption peaks at 1032 cm−1, which were attributed to the C–O functional group.18 Raman spectra (Fig. 4b) showed two peaks at approximately 1348 and 1590 cm−1. According to general guidelines, the D band appears to be indicative of disordered graphite structures, whereas the G band is indicative of crystalline graphitic carbons. The ID/IG ratios for CDs-hydro and CDs-300 were 2.16 and 2.09, respectively. According to the ID/IG ratio, the graphitisation of the carbon dots prepared by the solvent-free pyrolysis method is greater than that of the CDs prepared by the hydrothermal method.19 As shown in Fig. S2,† The XRD pattern shows two characteristic diffraction peaks at 2θ values of 23.1° and 43.5°, indicating that these carbon dots have an amorphous carbon and graphitic carbon structure20
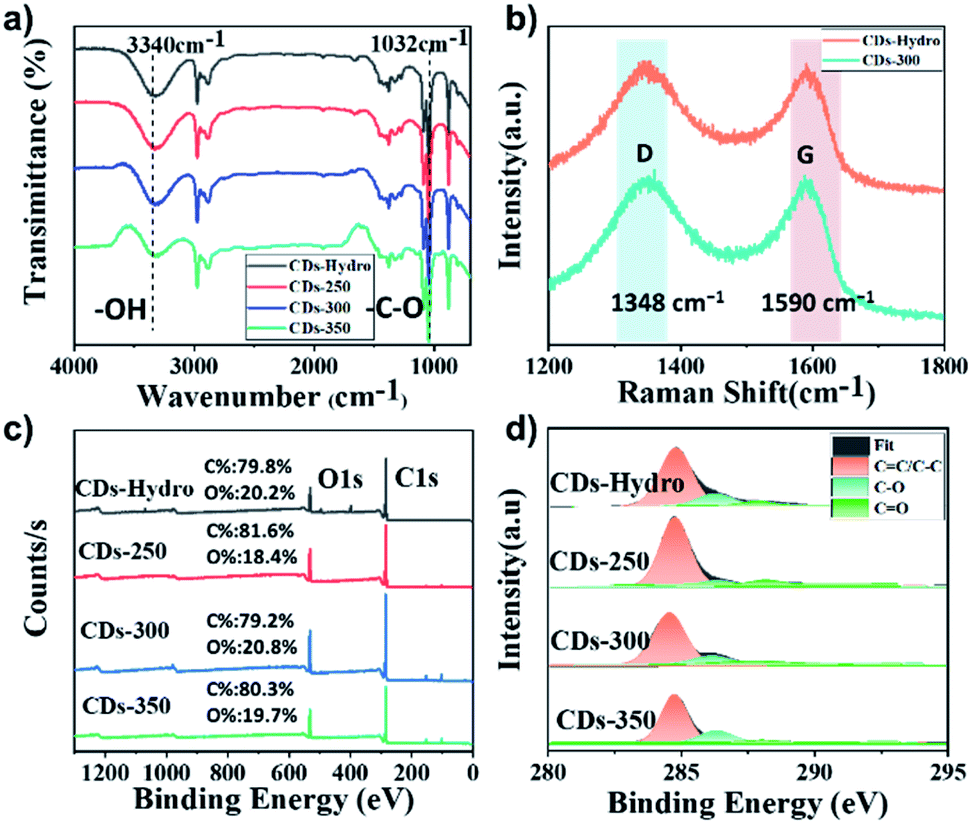 | ||
| Fig. 4 (a) FT-IR spectra of CDs based on starch (b) Raman spectra of CDs-hydro and CDs-300. (c) XPS survey spectra, and (d) high-resolution C 1s spectra of CDs-hydro, CDs-250, CDs-300 and CDs-350. | ||
Further investigation of the CD surface composition was performed via X-ray photoelectron spectroscopy (XPS). As shown in Fig. 4c, a similar element composition was observed in all examined CDs. There are typically two intense peaks at 284.8 and 531.2 eV in the XPS spectrum, which correspond to C 1s and O 1s respectively.21 The results of further investigation of the surface state of the CDs are listed in Table. S1.† With high-resolution XPS, surface information can be acquired for CDs. The resolved C 1s spectrum contained peaks at 284.8, 286.4 and 287.8 eV, indicating the presence of CC/C–C (sp2 carbon), C–O (sp3 carbon) and CO (carbonyl carbon) bonds, respectively22 (Fig. 4d). For these four CDs, the presence of more C–O bonds in the CDs prepared by the hydrothermal method was probably due to the involvement of the solvent in the carbonisation reaction. In addition, the carbon content increased and then decreased as the carbonisation temperature increased, suggesting that high temperatures induce oxidative degradation of starch. Detailed analysis shows that CDs-300 has the highest sp2 carbon content and carbonyl carbon content, indicating a high degree of graphitisation and oxidation, which may be the main factors contributing to the high fluorescence efficiency.
There are two general mechanisms for the CD photoluminescence phenomenon. One is the band gap transition based on the conjugate structure in the sp2 carbon core, and the other is the presence of surface defects in the CDs.23 Because no absorption associated with surface defects was observed for our samples, we believe that the band gap transition of the conjugated structure was the main factor controlling the PL in our system. The experimental Raman and XPS results also support the speculation and discussion of the fluorescence mechanism. With increasing reaction temperature, starch condenses via dehydration and the removal of hydroxyl and other functional groups by carbon dioxide to form a conjugated graphite carbon structure, which can emit fluorescence through electronic transitions. According to the experimental results, the CDs prepared by solvent-free pyrolysis have a better conjugated carbon core structure (sp2 carbon) and better fluorescence quantum yield than those prepared by the hydrothermal method.
CDs-hydro and CDs-300 with the highest fluorescence efficiency were chosen for the detection of various metal ions, as shown in Fig. 5a and b. The fluorescence intensity of the CDs was greatly reduced in the presence of Ru3+, while other ions had a weaker effect on the fluorescence intensity, indicating that CDs have excellent selectivity for Ru3+. We suggest that the hydroxyl groups on the surface of CDs interact with Ru3+, resulting in fluorescence quenching due to changes in the electronic structure of the CDs.24,25 Therefore, we further investigated the detailed sensor response of the two CDs to Ru3+ ions. The fluorescence intensity varied with Ru3+ concentration from 0–1000 μM (Fig. 5c and d). The fluorescence intensities of the CD solutions were linearly related to the Ru3+ concentration over a range of Ru3+ concentrations (Fig. 5e and f). In conclusion, the CDs obtained in this study exhibited good selectivity for Ru3+, supporting the use of these CDs as metal ion detection probes. The detection limit of the CDs obtained by the solvent-free method was less than 20 μM, while the detection limit of the control CDs was only 100 μM, indicating that the CDs obtained by the solvent-free method are more sensitive for the detection of Ru3+.
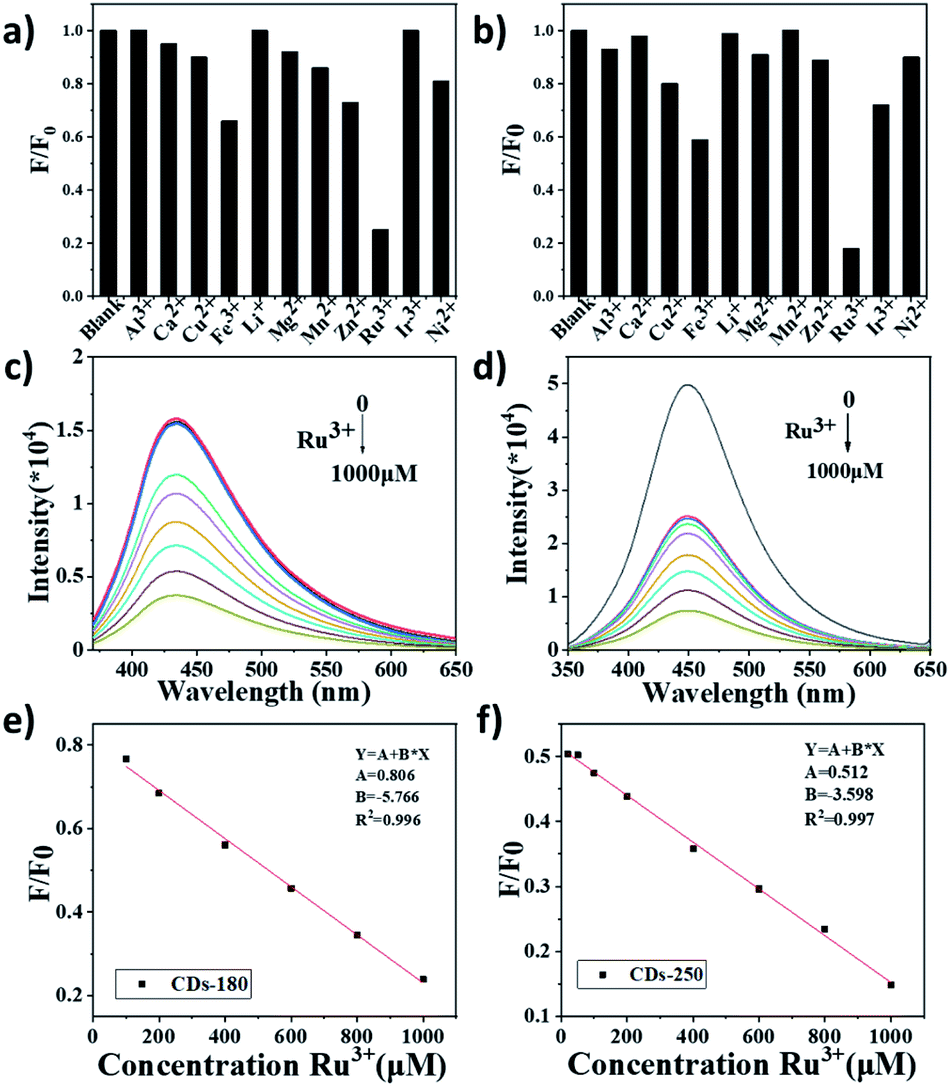 | ||
| Fig. 5 a and b) Fluorescent responses of 1000 μM CDs-hydro and CDs-300 to different metal ions, F0 and F present the fluorescence intensity of CDs before and after adding metal ions. (c and d) Fluorescence emission spectra of CDs-hydro and CDs-300 after the addition of different concentrations of Ru3+. (e and f) Plots of the F/F0 with different concentrations of Ru3+. | ||
In summary, the biomass CDs were prepared by a solvent-free pyrolysis method using starch as a carbon source. The synthesis temperature influenced the QY of the CDs, with CDs-300 exhibiting a higher QY of 21% and having a higher CC/C–C content, indicating that CDs with a high degree of graphitisation can be formed at this temperature. The surface of the CDs was found to be rich in oxygen-containing functional groups, which are more conducive to Ru3+ coordination and show good sensitivity to Ru3+, making these materials suitable for use as fluorescent Ru3+ sensors. The solvent-free preparation of the CDs described in this paper is simple and green, and the reaction solvent can be reused, which not only effectively reduces the production cost of the CDs but also provides a new method for the efficient conversion of biomass resources and green development and a new strategy for the detection of Ru3+ in aqueous solution.
Conflicts of interest
There are no conflicts to declare.Acknowledgements
This work was partially supported by the National Key Research and Development Program of China (No. 2019YFD1002404, 2021YFD1000202), and National Natural Science Foundation (No. 21961036, No. 31860338), China Agriculture Research System of MOF & MARA (CARS-21-05B), and the Programs of Science and Technology Department of Yunnan Province (202101AT070041, 202204BI090003, 202002AA10007, 202102AE090042), and Key Research and Development Program of Yunnan province (2018BB025), and Major Science and Technology Project of Kunming (2021JH002).Notes and references
- N. Gogoi, M. Barooah, G. Majumdar and D. Chowdhury, ACS Appl. Mater. Interfaces, 2015, 7, 3058–3067 CrossRef CAS PubMed.
- B. Rezaei and N. Majidi, Spectrochim. Acta, Part A, 2007, 66, 869–873 CrossRef PubMed.
- A. S. Amin, Spectrochim. Acta, Part A, 2002, 58, 1831–1837 CrossRef.
- A. D. Chowdhury and R. Doong, ACS Appl. Mater. Interfaces, 2016, 8, 21002–21010 CrossRef PubMed.
- J. L. He, H. R. Zhang, J. L. Zou, Y. L. Liu, J. L. Zhuang, Y. Xiao and B. F. Lei, Biosens. Bioelectron., 2016, 79, 531–535 CrossRef CAS PubMed.
- S. Huang, L. M. Wang, C. S. Huang, J. N. Xie, W. Su, J. R. Sheng and Q. Xiao, Sens. Actuators, B, 2015, 221, 1215–1222 CrossRef CAS.
- F. L. Yuan, L. Ding L, Y. C. Li, X. H. Li, L. Z. Fan, S. X. Zhou, D. C. Fang and S. H. Yang, Nanoscale, 2015, 7, 11727–11733 RSC.
- P. Wang, M. J. Meziani, Y. Q. Fu, C. E. Bunker, X. F. Hou, L. J. Yang, H. Msellek, M. Zaharias, J. P. Darby and Y. P. Sun, Nanoscale Adv., 2021, 3, 2316–2324 RSC.
- I. Roy and M. N. Gupta, Enzyme Microb. Technol., 2004, 34, 26–32 CrossRef CAS.
- Y. Q. Zhang, X. Y. Liu, Y. Fan, X. Guo, L. Zhou, Y. Lv and J. Lin, Nanoscale, 2016, 8, 15281–15287 RSC.
- J. M. Criado and A. Ortega, Thermochim. Acta, 1992, 195, 163–167 CrossRef CAS.
- M. Shui, L. H. Yue, Y. M. Hua and Z. D. Xu, Thermochim. Acta, 2002, 386, 43–49 CrossRef CAS.
- R. S. A. Sonthanasamy, W. Y. W. Ahmad, S. Fazry, N. I. Hassan and A. M. Lazim, Carbohydr. Polym., 2016, 137, 488–496 CrossRef CAS PubMed.
- Y. W. Zheng, J. D. Wang, D. H. Li, C. Liu, Y. Lu, X. Lin and Z. F. Zheng, J. Energy Inst., 2021, 97, 58–72 CrossRef CAS.
- D. Chen, K. Cen, X. Zhuang, Z. Gan, J. Zhou, Y. Zhang and H. Zhang, Combust. Flame, 2022, 242, 112142 CrossRef CAS.
- H. Ding, Y. Ji, J. S. Wei, Q. Y. Gao, Z. Y. Zhou and H. M. Xiong, J. Mater. Chem. B, 2017, 5, 5272–5277 RSC.
- P. Wang, C. Liu, W. Q. Tang, S. X. Ren, Z. J. Chen, Y. R. Guo, R. Rostamian, S. L. Zhao, J. Li, S. X. Liu and S. J. Li, ACS Appl. Mater. Interfaces, 2019, 11, 19301–19307 CrossRef CAS PubMed.
- K. Jiang, S. Sun, L. Zhang, Y. Lu, A. Wu, C. Cai and H. Lin, Angew. Chem., Int. Ed., 2015, 127, 5450–5453 CrossRef.
- Y. X. Zheng, K. Arkin, J. W. Hao, S. Y. Zhang, W. Guo, L. L. Wang, Y. N. Guo and Q. K. Shang, Adv. Opt. Mater., 2021, 9, 2100688 CrossRef CAS.
- H. Dang, L. K. Huang, Y. Zhang, C. F. Wang and S. Chen, Ind. Eng. Chem. Res., 2016, 55, 5335–5341 CrossRef CAS.
- M. Ge, S. Y. Han, Y. L. Ma, J. Li, S. X. Liu, Z. J. Chen and S. J. Li, Adv. Opt. Mater., 2021, 9, 2101092 CrossRef CAS.
- B. Chen, F. L. Song, S. G. Sun, J. L. Fan and X. J. Peng, Chem. – Eur. J., 2013, 19, 10115–10118 CrossRef CAS PubMed.
- H. Ding, S. B. Yu, J. S. Wei and H. M. Xiong, ACS Nano, 2016, 10, 484–491 CrossRef CAS PubMed.
- N. Cacita and S. Nikolaou, J. Lumin., 2016, 169, 115–120 CrossRef CAS.
- F. Du, Q. Zeng, Z. Lai, Z. Cheng and G. Ruan, New J. Chem., 2019, 43, 12907–12915 RSC.
Footnote |
| † Electronic supplementary information (ESI) available. See https://doi.org/10.1039/d2ra03277e |
| This journal is © The Royal Society of Chemistry 2022 |