 Open Access Article
A facile imine-linked covalent organic framework doped with a carbon dot composite for the detection and removal of Hg2+ in surface water†
Q. I. N. Shili a,
H. E. Xudonga,
J. I. N. Fenglongb,
W. A. N. G. Yinga,
C. H. U. Hongtaoa,
H. A. N. Shuang
 a,
S. U. N. Yangyanga and
G. A. O. Lidi‡
*a
aCollege of Chemistry and Chemical Engineering, Qiqihar University, Qiqihar, Heilongjiang 161006, P. R. China
bCenter of Inspection and Testing, Qiqihar Administration for Market Regulation, Qiqihar, Heilongjiang 161006, P. R. China. E-mail: gaolidi@163.com; Tel: +86 0452 2738214
First published on 28th June 2022
Abstract
Hg2+ is one of the most toxic chemical species in the water environment, and thus developing a new fluorescent covalent organic framework for both the detection and removal of Hg2+ is highly desirable. Herein, a fluorescent composite, termed TpPa-1 COF@CDs, was synthesized by inverse emulsion polymerization method using an imine covalent organic framework as the supporting material and carbon dots as the fluorescent sensor element. The crystallinity, porosity, rich functional receptors (hydroxyl and amino groups), thermal stability and fluorescent properties of TpPa-1 COF@CDs were characterized. The results showed that TpPa-1 COF@CDs exhibited a good detection and removal performance for Hg2+, which was evidenced by its high sensitivity (LOD = 0.75 μg L−1), superior selectivity, large adsorption capacity (235 mg g−1), fast adsorption rate (30 min equilibrium time) and good regeneration (at least five cycles). More importantly, the simple functional monomer, short reaction time and metal-free raw material made TpPa-1 COF@CDs reliable, cost effective and eco-friendly. This research demonstrated the facile construction of a functional covalent organic framework composite for water environmental remediation technologies of metal pollution.
1 Introduction
Heavy metal pollution of the water environment has drawn increasing attention because of the public health damage and the environmental toxicity.1,2 Hg2+, one of the most toxic heavy metal elements, may result in a wide range of serious diseases such as acrodynia, Hunter-Russell syndrome, Minamata disease, and so forth, even at a relatively low dose level.3,4 Therefore, the development of a new methodology for the effective removal and detection of Hg2+ from polluted water is essential. Among all the wastewater treatment techniques, adsorption holds considerable promise in view of the advantages of an easier operation and lower cost.5,6 The key to this technology is the adsorbent. In recent years, covalent organic framework (COF) materials as a kind of superior adsorbent have attracted great attention owing to their characteristics of a high porosity, high surface area, controllable pore size and low mass density,7–10 and have applied to selective separation,11 gas storage,12 catalysis,13 sensors,14 etc. Especially, imine-linked COFs have been used to remove Hg2+ with a high efficiency and selectivity, which could be due to rationally placed functional groups within the frameworks to optimize the performance.15,16However, detection or removal can only be performed separately by most COFs, which has restricted their practical applications. In recent years, photoluminescent COFs for the selective detection and removal of Hg2+ have attracted wide interest. Ding17 introduced a thioether-functionalized hydrazine linked COF-LZU8 constructed by a bottom-up strategy and applied it to the sensing and removal of Hg2+. Yu18 designed a fluorescent covalent organic framework with allyl and hydroxy groups, which reached with as much as an 82% quenching ratio after treatment of only 40.0 μmol L−1 of Hg2+. In addition, an amine and sulfonyl group-based fluorescent covalent organic framework was synthesized by a bottom-up hydrothermal procedure and had an effective removal capacity of Hg2+ (99.8%).19 Although these successful applications have been developed, the strong π–π interactions, the complicated functional monomers, the tedious preparation process or the uneconomical raw material resulted in the practical preparation and application of the photoluminescent COFs being challenging.20,21 Therefore, it is worth designing COFs combined with quantum dots, which not only compensate for these defects but also maintain the superior adsorption ability. Jiang et al. developed a new ratiometric fluorescence composite based on nanohybrids and an enzyme-catalyzed reaction using black phosphorus as quantum dots, which could enable the detection of baicalin in the range of 0.01–500 μg mL−1, with a limit of detection of 3 ng mL−1.22 As can be seen, fluorescent nanoparticle-doped COFs for fluorescence detection have great potential for a wide use in practice.23–26
Carbon dots (CDs), carbon-based quasi-spherical fluorescent nanoparticles, have unique physical and chemical properties;27,28 especially because CDs as fluorescent probes show great promise for the selective detection of Hg2+.29–33 Luo et al. prepared nitrogen-rich carbon dots from 2,4,6-triaminopyrimidine, which exhibited a highly sensitive and selective response to Hg2+ by adjusting pH values.34 And carbon dots derived from ampicillin sodium reached a detection limit of 33.4 nmol L−1 Hg2+ in water. However, so far CDs were only applied for the detection of Hg2+, and no application to the adsorption removal of Hg2+ was reported, which may be due to CDs' good water solubility. In order for both the detection and removal of Hg2+, an appropriate solid matrix should be found for CDs to improve their stability and performances. CDs could effectively combine a solid matrix through electrostatic interactions, covalent bonds, non-covalent bonds or hydrogen bonds.35,36 Recent research in the development of CDs loaded on molecularly imprinted polymers, hydrogels, metallic and nonmetallic materials have had extensive attention.37 However, a study of CDs as the fluorescence probe and imine-linked COFs as the encapsulated matrix for the detection and removal of Hg2+ has not been found.
Herein, a fluorescent sensor based on COFs and CDs was synthesized for the detection and removal of Hg2+ in environmental water by using 1,3,5-triformylphloroglucinol/p-phenylenediamine covalent organic frameworks (TpPa-1 COF) as the supporting materials and sorbents and CDs as the fluorescent sensor element. The composite material (TpPa-1 COF@CDs) was characterized by various characterization methods, such as Fourier-transform infrared (FT-IR) spectroscopy, scanning electron microscopy (SEM), X-ray diffraction (XRD), nitrogen adsorption/desorption (BET) and so on. Further, the selective detection and batch adsorption performances of TpPa-1 COF@CDs for Hg2+ were systematic studied. Finally, the TpPa-1 COF@CDs were successfully applied to the detection of Hg2+ in surface water samples and the recovery results were satisfactory.
2 Experimental
2.1 Materials and instruments
Phloroglucinol, hexamethylenetetramine, N,N-dimethylformamide (DMF), aminopropyl triethoxysilane (APTES), tetraethyl orthosilicate (TEOS), p-phenylenediamine (Pa-1) were analytical reagents and purchased from Aladdin Chemical Co., Ltd (Shanghai, China). Tartaric acid, Triton X-100 and ethylenediamine were obtained from Alfa Aesar Chemical Co., Ltd (Shanghai, China); 1,3,5-triformylphloroglucinol (Tp) was prepared with phloroglucinol and hexamethylenetetramine according to previous research38 and characterized by 1H Nuclear Magnetic Resonance (AV600, Bruker Instrument Co., Ltd) (Fig. S1†). The other solvents and reagents were of analytical grade. The water used in all the instrumental experiments was ultrapure.2.2 Synthesis of TpPa-1 COF@CDs
The preparation of CDs39 and TpPa-1 COF40 were previously reported and are via a one-step hydrothermal method and a mechanical stirring method, respectively. TpPa-1 COF@CDs was synthesized by a reverse microemulsion method. Firstly, 10 mL of ethanol, 1.8 mL of Triton X-100 and 7.5 mL of cyclohexane were added into a 50 mL round bottom flask and magnetically stirred for 30 min at room temperature. Then, 1 mL of CDs, 50 μL of TEOS and 100 μL of ammonia water were added and sonicated for 5 min. After 2 h of stirring, 20 μL of APTES and 1.0 mg of TpPa-1 COF were added into the mixture solution in sequence, and stirred for 8 h. Finally, the product was collected by centrifugation and washed sequentially with acetone and ultrapure water until no fluorescence signal was detectable. In each washing process, the mixture was centrifuged at 5000 rpm for 10 min to remove the supernatant, and then re-dispersed in the next solvent. The final product was dried in a vacuum oven at 50 °C overnight.2.3 Fluorescence measurement
A 10 mg sample of TpPa-1 COF@CDs was accurately weighed and uniformly dispersed into 25 mL of different solvents, and the fluorescence spectra of the mixed system was measured by a LS55 fluorescence spectrophotometer. The effects of excitation wavelengths, solvent types and pH values on the fluorescence intensity of TpPa-1 COF@CDs were evaluated. The examined excitation wavelength region ranged from 330 to 365 nm with 5 nm intervals; the examined solvents were water, ethanol, DMF and cyclohexane; and the examined pH values were in the 4.0–11.0 range. Subsequent experiments were performed under the optimal conditions obtained above.2.4 Adsorption properties of TpPa-1 COF@CDs
Hg2+ adsorption thermodynamics and kinetics were studied on TpPa-1 COF@CDs to evaluate the adsorption properties of the material. In the isothermal adsorption experiment, 10 mg of TpPa-1 COF@CDs were dispersed in 25 mL of Hg2+ aqueous solution with a concentration ranging varying from 10 to 150 μg L−1 (C0) and incubated for 35 min. The mixed system was centrifuged and filtered, and then the Hg2+ concentration in the filtrate (Ce, equilibrium concentration) was measured by an A3F atomic absorption spectrophotometer (AAS) from Beijing Pu Analysis General Instrument Co., Ltd. In the kinetic adsorption experiments, 25 mL of a 120 μg L−1 Hg2+ aqueous solution (C0) were selected according to the same methods as described above, and the Hg2+ concentrations in the supernatant (Ce) were measured at the indicated intervals from 2.5 min to 35 min. The adsorption capacities (qe, adsorption capacity at equilibrium; qt, adsorption capacity at any time) were calculated according to the equation: q = (C0 – Ce) × V/m,41 where q represents qe or qt, and C0 and Ce are the initial and equilibrium concentrations of Hg2+ in the aqueous solution, respectively; V and m are the solution volume and the mass of TpPa-1 COF@CDs, respectively.2.5 Application of surface water samples
To test the performance of the novel composite material on an actual sample, a surface water sample was collected from Nengjiang River in July 2021, and filtered by a 0.45 μm filter membrane to remove the suspended particles. The water quality was detected in accordance with the Chinese Environmental Quality Standards for Surface Water (GB 3838-2002). The obtained values are listed in Table S1.† The actual surface water sample was named as the blank water sample because no Hg2+ was detected. The fluorescent titration curves of the matrix standard addition were conducted by adding Hg2+ to the blank water sample. Meanwhile, the same method was used for a standard curve prepared in pure water. And then the recovery experiments were conducted by detecting Hg2+ spiked at concentrations of 20, 60 and 90 μg L−1 in the blank water samples five consecutive times.3 Results and discussion
3.1 Preparation and characterization of TpPa-1 COF@CDs
The preparation scheme of TpPa-1 COF@CDs is illustrated in Fig. S2.† CDs were synthesized using tartaric acid as the carbon source and ethylenediamine as the nitrogen source by a hydrothermal method. The typical imine-linked COF, TpPa-1, was synthesized using Tp and Pa-1 as the monomers and had a remarkable stability, porosity, large surface area and rich functional groups.42 In this reverse microemulsion system, TpPa-1 COF, surfactant (Triton X-100), APTES and TEOS were applied as the supporting material, dispersant, amino modifier of the CDs and cross-linker, respectively. The amino modified CDs reacted with TpPa-1 COF to form the composite material TpPa-1 COF@CDs by a Schiff base reaction. In order to characterize the TpPa-1 COF@CDs, SEM, TEM, FT-IR, XRD, TG, XPS and the adsorption and desorption of nitrogen were performed. As shown in Fig. 1A and B, the CDs showed a spherical morphology with an average diameter of 2.9 nm and were uniformly distributed, and TpPa-1 presented a fiber framework with a rod structure that resulted from the strong π–π stacking interaction between adjacent rods. Meanwhile, the TpPa-1 COF@CDs had a spherical core–shell structure with an average diameter of about 200 nm, shown in Fig. 1C and D. The morphology characteristics of TpPa-1 COF@CDs had been changed to a regular sphere from the rod structure of TpPa-1 COF, which might be due to the formation of a thin silica layer.43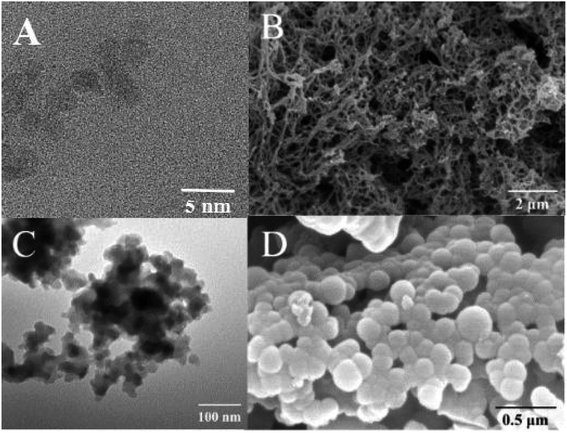 | ||
| Fig. 1 TEM images of CDs (A) and TpPa-1 COF@CDs(C); SEM images of TpPa-1 COF (B) and TpPa-1 COF@CDs(D). | ||
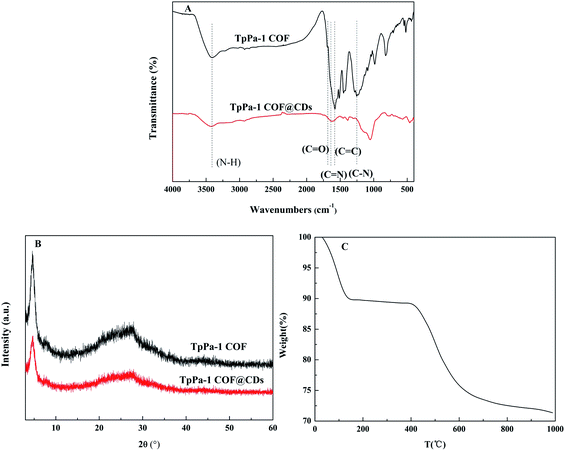
FT-IR was used to identify the functional groups in the structure of TpPa-1 COF@CDs. As seen in Fig. 2A, the stretching vibration absorption peaks of C–N and C![[double bond, length as m-dash]](https://www.rsc.org/images/entities/char_e001.gif) O of TpPa-1 COF showed at 1250 cm−1 and 1690 cm−1. The skeleton vibration of the benzene ring was observed at 1577 cm−1 due to the conjugation effect. Furthermore, the new vibration absorption peak C
O of TpPa-1 COF showed at 1250 cm−1 and 1690 cm−1. The skeleton vibration of the benzene ring was observed at 1577 cm−1 due to the conjugation effect. Furthermore, the new vibration absorption peak C![[double bond, length as m-dash]](https://www.rsc.org/images/entities/char_e001.gif) N of TpPa-1 COF@CDs appeared at 1621 cm−1, and the absorption peaks of the other groups (e.g., N–H and C
N of TpPa-1 COF@CDs appeared at 1621 cm−1, and the absorption peaks of the other groups (e.g., N–H and C![[double bond, length as m-dash]](https://www.rsc.org/images/entities/char_e001.gif) C) did not change throughout the reaction, which indicated that TpPa-1 COF doped with the CD composite was successfully prepared and kept the original covalent structure.
C) did not change throughout the reaction, which indicated that TpPa-1 COF doped with the CD composite was successfully prepared and kept the original covalent structure.
There was a strong diffraction peak at 4.66°, corresponding to the reflection of the [100] plane, in XRD spectrum of TpPa-1 COF@CDs (Fig. 2B).44 This meant that TpPa-1 COF@CDs maintained the basic crystal structure of TpPa-1 COF. The TG curve (Fig. 2C) showed that the mass loss before 150 °C was mainly caused by the evaporation of water and solvent. The weight loss from 400 °C to 590 °C was attributed mainly to the collapse of the framework. These results demonstrated that TpPa-1 COF@CDs had a good crystallinity and thermal stability, which were not significantly affected by the polymerization reaction of the reverse microemulsion system.
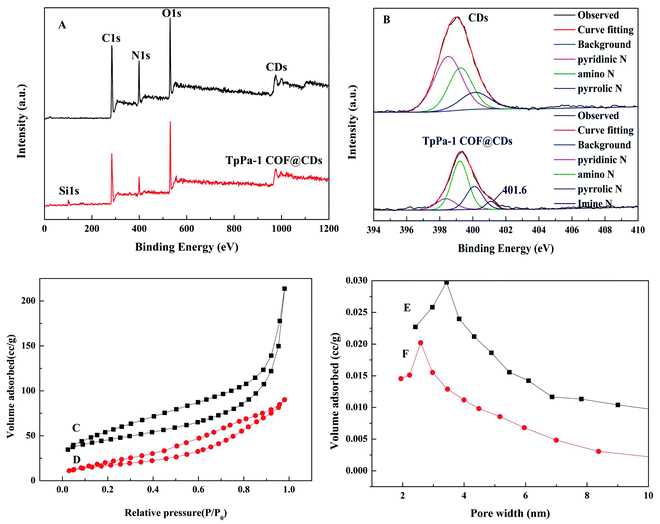
The chemical composition and element states of the CDs and TpPa-1 COF@CDs were characterized by XPS spectra. As shown in Fig. 3A, three typical peaks of C1s, N1s, and O1s were observed at 284.8, 399.6 and 532.6 eV, respectively. In addition, a new small peak was observed at 103 eV, corresponding to Si1s in the XPS spectrum of the TpPa-1 COF@CDs. High resolution N1s XPS spectra of the CDs and TpPa-1 COF@CDs are shown in Fig. 3B. The peaks at 398.4, 399.1 and 400.2 eV were attributed to the pyridinic, amino and pyrrolic nitrogens, and a new peak at 401.6 eV in the N1s spectrum of TpPa-1 COF@CDs indicated the formation of a carbon–nitrogen double bond by a Schiff base polymerization reaction between TpPa-1 and the CDs.
The specific surface area and porosity of TpPa-1 COF and the TpPa-1 COF@CDs were evaluated by the adsorption and desorption of nitrogen at 77 K (Fig. 3C). Their isotherms were typical and reversible type-IV, indicative of adsorption hysteresis and a capillary mechanism between the adsorbate and adsorbent. The specific surface area and pore diameter of TpPa-1 COF@CDs decreased from 122.87 m2 g−1 to 75.95 m2 g−1 and from 3.08 nm to 2.59 nm (Fig. 3D), respectively, due to the introduction of CDs.
3.2 Fluorescence performance of TpPa-1 COF@CDs
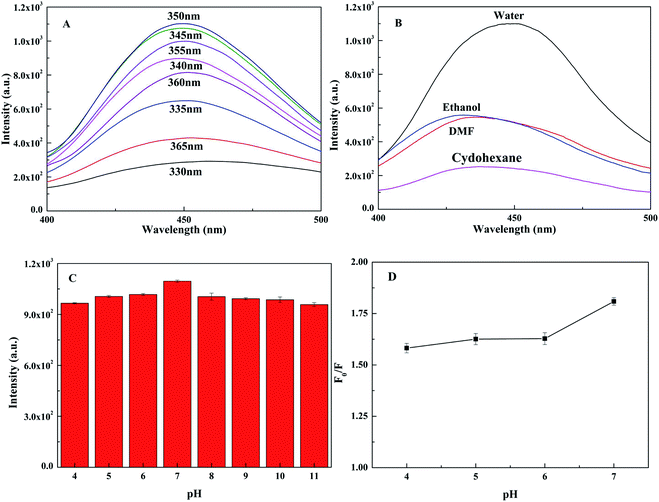
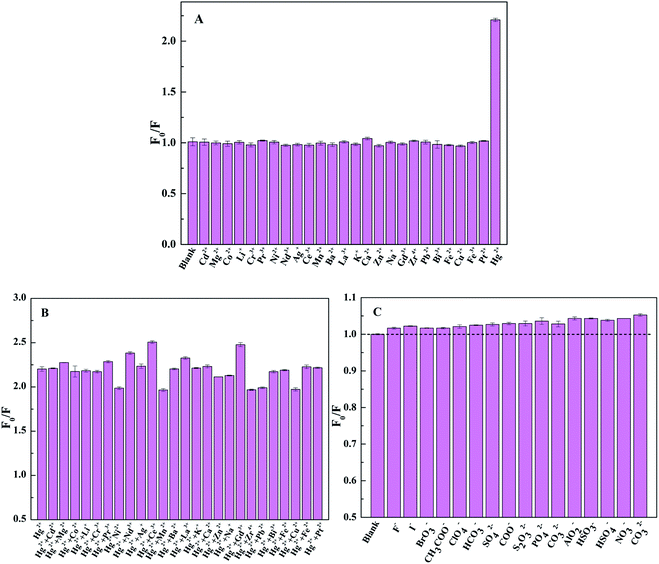
To explore the fluorescence performance of TpPa-1 COF@CDs, the effects of the excitation wavelength, solvent type and pH value on the fluorescence intensity were investigated. As shown in Fig. 4A, the optimal excitation wavelength was collected at 350 nm, within the measured wavelength range of 330-365 nm, and the corresponding emission wavelength of the maximum fluorescence intensity was 450 nm. TpPa-1 COF@CDs in water showed the strongest fluorescence compared with those of the other solvents (e.g. ethanol, DMF and cyclohexane) (Fig. 4B). This might be because the introduction of CDs improved the dispersion of the composite materials in water.45 The fluorescence intensity of TpPa-1 COF@CDs first increased and then decreased with pH values ranged from 4.0 to 11.0 (Fig. 4C), which was caused by the dissociation of the silica matrix of TpPa-1 COF@CDs at high pH values or low pH values.46 However, the difference in the fluorescence intensity with pH changes was not obvious. Meanwhile, the fluorescence intensity of TpPa-1 COF@CDs was quenched by Hg2+ in a neutral aqueous solution up to 45% (Fig. 4D).The selectivity of TpPa-1 COF@CDs is one of the most important factors in the practical application of detection, and was evaluated by detecting the fluorescence intensity of TpPa-1 COF@CDs in water with the presence of different metal ions (20 μmol L−1). As shown in Fig. 5A, the maximum fluorescence quenching was observed with the addition of Hg2+, whereas the other metal ions only caused a slight quenching. The fluorescence quenching of TpPa-1 COF@CDs by Hg2+ (20 μmol L−1) was evaluated in the presence of the other metal ions (50 μmol L−1). A contrast histogram is shown in Fig. 5B, which indicates that the TpPa-1 COF@CDs exhibited a good selectivity for Hg2+. According to Pearson's HSAB principle, Hg2+ as a soft acid always preferentially forms a coordination complex with a soft base, like the abundant amine groups of TpPa-1 COF@CDs, which could interact quickly, selectively and efficiently with Hg2+.47 Meanwhile, similar selective experiments by adding TpPa-1 COF@CDs to the various anion solutions (50 μmol L−1) were conducted (Fig. 5C). The results showed that all 16 kinds of anions gave rise to a slight influence on the fluorescence quenching of TpPa-1 COF@CDs compared with that of the blank sample. Thus, TpPa-1 COF@CDs possessed an excellent selectivity and recognition for Hg2+, making it a promising application to detect Hg2+ in real water samples.
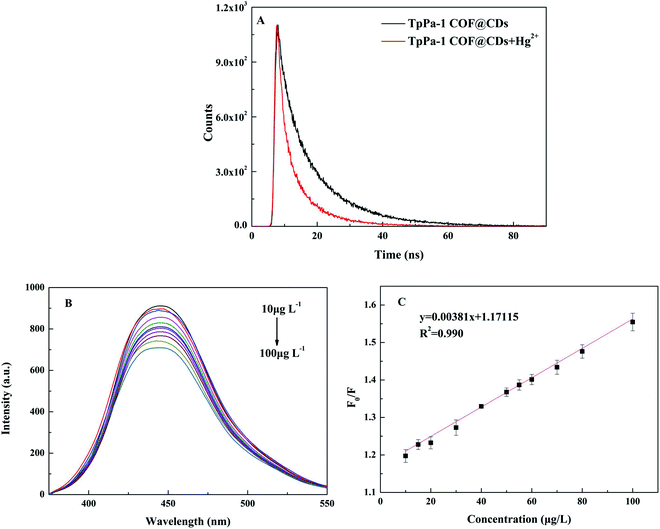
The fluorescent sensing platform was established through the Hg2+ and TpPa-1 COF@CDs interaction and investigated by the fluorescence decay lifetime. As shown in Fig. 6A, the fluorescence lifetime decay curve of TpPa-1 COF@CDs changed after adding Hg2+, which indicated that the fluorescence quenching by Hg2+ belonged to dynamic quenching.48,49 In order to more accurately prove the mechanism of this quenching, the mean fluorescence decay lifetimes of TpPa-1 COF@CDs before and after adding Hg2+ were analyzed, and the test results were fitted by a double exponential function.50 As shown in Table S2,† the average fluorescence delay lifetime of TpPa-1 COF@CDs in water was 11.99 ns, and that of TpPa-1 COF@CDs with the addition of Hg2+ was 7.08 ns. Hg2+ had a larger radius and a stronger affinity for nitrogen and oxygen atoms making it easier with TpPa-1 COF@CDs to form stable non-fluorescent complexes,51 where the ligand-to-metal charge transfer effect led to fluorescence quenching.52
3.3 Sensing of Hg2+ in actual water samples
The fluorescent titration curve of the matrix standard addition and recovery experiments were used to confirm the sensitivity, stability and repeatability of Hg2+ detection in blank actual water samples by TpPa-1 COF@CDs. In Fig. 6B, the fluorescence of TpPa-1 COF@CDs was effectively quenched in the presence of different concentrations of Hg2+ (10–100 μg L−1). Meanwhile, the calibration curve of fluorescence quenching (F0/F) versus the concentration of Hg2+ showed a good linearity with correlation coefficients higher than 0.990 (Fig. 6C). The limit of detection (LOD) was estimated to be 0.75 μg L−1 based on International Union of Pure and Applied Chemistry (IUPAC) criterion [LOD=(3 × standard deviation)/slope of the fitted linear equation].53 The fluorescent titration curve of the matrix standard addition and that of pure water did not differ much (Fig. S3†). These results demonstrated that this method had a minor matrix interference, and the LOD satisfied the fourth grade limited values of the Chinese Environmental Quality Standards for Surface Water (GB 3838-2002). Meanwhile, the recoveries of the actual water samples were in range of 95.76–104.68%, and the relative standard deviation (RSD) was less than 7.62% (Table S3†). The results indicated that the established fluorescence detection method was suitable for the detection of Hg2+ in actual water samples.3.4 Batch adsorption performance of TpPa-1 COF@CDs
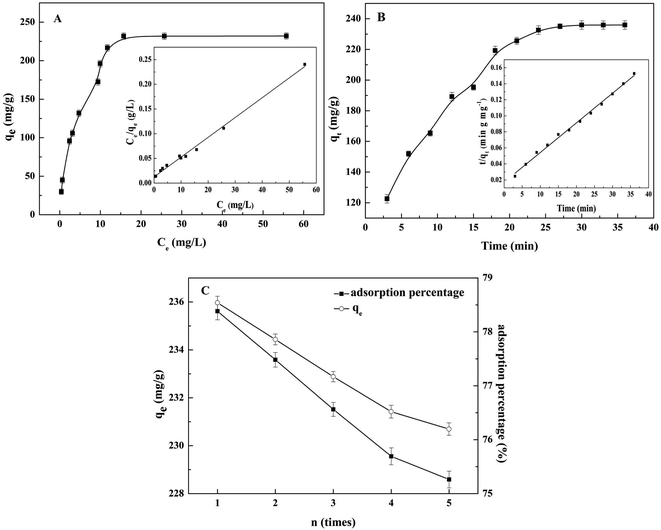
Recently, many adsorbents have been reported and applied for the removal of Hg2+.54 Compared with other sulfur-based adsorbents, functional materials with abundant nitrogen-based ligands may also apply for the selective adsorption of Hg2+.55 Specifically, the key advantage of a nitrogen-based-Hg2+ ligand is reversible binding process. Among porous functional materials, COFs were superior in scalability, stability, tunable porosity and environmentally friendly potential. Therefore, the adsorption isotherms, the adsorption kinetics and the reversible binding of Hg2+ on TpPa-1 COF@CDs were investigated, which was done by adding 10 mg of TpPa-1 COF@CDs to a concentration series of Hg2+ at pH 7.0.The adsorption capacity increased rapidly with the increase of the equilibrium concentration of Hg2+, and then slowly increased until equilibrium was reached. As shown in Fig. 7A, the saturated adsorption capacity of TpPa-1 COF@CDs for Hg2+ was 235 mg g−1. And the adsorption isotherm was close to that of the ideal type-I model, indicating the excellent affinity of TpPa-1 COF@CDs for Hg2+.56,57 The experimental data are fitted to a Langmuir isotherm (correlation coefficient 0.993) in the inset of Fig. 7A.
The study on the adsorption rate was essential. The contact time of the adsorption capacity was investigated in the range of 0-40 min. As shown in Fig. 7B, a fast adsorption process was observed in the initial 20 min, and the adsorption equilibrium was achieved in 30 min. The results showed that the adsorption fitted a pseudo-second-order adsorption model with a correlation coefficient of 0.994.58 Moreover, the initial adsorption rate was 58.2 mg g−1 min−1, which indicated that the adsorption process of TpPa-1 COF@CDs for Hg2+ was a fast adsorption kinetics attributed to the porous network structure and the rich and evenly distributed binding sites in the skeleton of TpPa-1 COF@CDs.57
The regeneration of TpPa-1 COF@CDs was investigated. The adsorption process was by adding 10 mg of TpPa-1 COF@CDs to 25 mL of a 120 μg L−1 Hg2+ aqueous solution, and then the desorption process was carried out by washing the absorbents with 1 mol L−1 Na2S aqueous solution to exchange the bound Hg2+ into the soluble [HgS2]2−. The adsorption capacity and adsorption percentage of Hg2+ was used to evaluate the regeneration of TpPa-1 COF@CDs (Fig. 7C). It was noted that the adsorption of TpPa-1 COF@CDs for Hg2+ could be cycled at least five times. The adsorption capacity and adsorption percentage only decreased by 4.20% and 2.35%, respectively.
The above results of the batch adsorption performance suggested that TpPa-1 COF@CDs exhibited a relatively large adsorption capacity, fast adsorption rate and good regeneration for Hg2+, and could be utilized as a promising adsorbent for Hg2+ removal from water.
3.5 Comparison of TpPa-1 COF@CDs with other fluorescent COFs
Given the adverse effect of Hg2+ on the ecological environment and human health, a sensitive detection and efficient removal method of Hg2+ is highly desirable (Table S4†). Although TpPa-1 COF@CDs still have a certain gap in the maximal adsorption capacity, the LOD and regeneration were comparable with those of other fluorescent COFs reported. Notably, the preparation process of TpPa-1 COF@CDs was less time-consuming and simpler, and the functional monomers were less costly. TpPa-1 COF@CDs satisfied the requirements of stability and reproducibility, and more importantly, it was capable of both detecting and removing Hg2+ in actual water samples.Conclusion
In summary, a new composite of imine-linked COF doped with CDs was rationally designed and synthesized by a reverse microemulsion method. It exhibited a good sensitive and selective fluorescence response to low concentrations of Hg2+ in water. The linear range of detection was 10–100 μg L−1, and the LOD was 0.75 μg L−1. Moreover, the high adsorption capacity (235 mg g−1), the fast adsorption rate (58.2 mg g−1 min−1) and the good regeneration (5 consecutives cycles) of the composite demonstrated a tremendous application potential for Hg2+ removal from water. This less costly and easily constructed fluorescent COF provides opportunities for both the sensitive detection and effective removal of a wide variety of pollutants in environmental water.Conflicts of interest
There are no conflicts to declare.Acknowledgements
We gratefully acknowledge the support of the basic special engineering general program of the Heilongjiang Provincial Education Department (No: 135509206); the student innovation and entrepreneurship training program of Heilongjiang Province (No: 202110232093); the Young Creative Program of the Fundamental Research Funds in Heilongjiang Provincial Universities (YJSCX2020030)References
- R. Z. Zhang and W. Chen, Biosens. Bioelectron., 2014, 55, 83–90 CrossRef CAS PubMed.
- T. Florian, D. G. Neil, C. Massimo, A. Philippe, W. Walter and P. John, Sci. Total Environ., 2011, 412–413, 239–247 Search PubMed.
- M. Yuan, Y. G. Zhu, X. H. Lou, C. Chen, G. Wei, M. B. Lan and J. L. Zhao, Biosens. Bioelectron., 2012, 31, 330–336 CrossRef CAS PubMed.
- S. Şahin, M. O. Caglayan and Z. Üstündağ, Talanta, 2020, 220, 121437 CrossRef PubMed.
- V. Srivastava, Y. C. Sharma and M. Sillanpää, J. Mol. Liq., 2015, 211, 613–620 CrossRef CAS.
- G. K. Ren, X. L. Wang, P. H. Huang, B. H. Zhong, Z. Y. Zhang, L. Yang and X. S. Yang, Sci. Total Environ., 2017, 607–608, 900–910 CrossRef CAS PubMed.
- U. Díaz and A. Corma, Coord. Chem. Rev., 2016, 311, 85–124 CrossRef.
- E. A. Gendy, J. S. Ifthikar, J. Ali, D. T. Oyekunle, Z. Elkhlifia, I. I. Shahib, A. I. Khodair and Z. Q. Chen, J. Environ. Chem. Eng., 2021, 105687 CrossRef CAS.
- M. Chen, H. Li, C. Liu, M. H. Chen, H. R. Li, C. X. Liu, J. Y. Liu, Y. Q. Feng, A. G. H. Wee and B. Zhang, Coord. Chem. Rev., 2021, 435, 213778 CrossRef CAS.
- Y. X. Yu, G. L. Li, J. H. Liu and D. Q. Yuan, Chem. Eng. J., 2020, 401, 126139 CrossRef CAS.
- J. Huang, X. Han, S. Yang, Y. Cao, C. Yuan, Y. Liu, J. Wang and Y. J. Cui, J. Am. Chem. Soc., 2019, 141, 8996–9003 CrossRef CAS PubMed.
- H. C. Gulbalkan, Z. P. Haslak, C. Altintas, A. Uzun and S. Keskin, Sep. Purif. Technol., 2022, 287, 120578 CrossRef CAS.
- H. C. Ma, C. C. Zhao, G. J. Chen and Y. B. Dong, Nat. Commun., 2019, 10, 3368–3377 CrossRef PubMed.
- L. R. Ahmed, A. EI-Mahdy, C. T. Pan and S. W. Kuo, Mater. Adv., 2021, 2, 4617–4629 RSC.
- J. Ge, J. Xiao, L. Liu, L. Qiu and X. Jiang, J. Porous Mater., 2016, 23, 791–800 CrossRef CAS.
- M. X. Zheng, C. Yao, W. Xie, Y. H. Xu and H. Hu, Bull. Chem. Soc. Jpn., 2021, 94, 2133–2138 CrossRef CAS.
- S. Ding, M. Dong, Y. Wang, Y. Chen, H. Wang, C. Su and W. Wang, J. Am. Chem. Soc., 2016, 138, 3031–3037 CrossRef CAS PubMed.
- Y. Yu, G. Li, J. Liu and D. Yuan, Chem. Eng. J., 2020, 401, 126139 CrossRef CAS.
- A. Panda, Y. Q. Yang, S. Venkateswarlu, Y. H. Son, T. H. Bae and M. Y. Yoon, Microporous Mesoporous Mater., 2020, 306, 110399 CrossRef CAS.
- Y. Liu, X. Yan, H. S. Lu, W. D. Zhang and Z. G. Gu, Sens. Actuators, B, 2020, 323, 128708 CrossRef CAS.
- M. Wang, L. Guo and D. Cao, ACS Appl. Mater. Interfaces, 2018, 10, 21619–21627 CrossRef CAS PubMed.
- X. W. Jiang, H. Jin, Y. J. Sun, Z. J. Sun and R. J. Gui, Biosens. Bioelectron., 2020, 152, 112012 CrossRef CAS PubMed.
- J. Zheng, H. Zhao, G. Ning, W. Sun, L. Wang, H. Liang, H. Xu, C. He, H. Zhao and C. P. Li, Tatanla, 2021, 233, 122520 CAS.
- K. Ge, Y. Peng, Z. Lu, Y. Hu and G. Li, J. Chromatogr. A, 2020, 1615, 460741 CrossRef CAS PubMed.
- Y. Guo, S. Yang, Q. Xu, P. Wu, Z. Jiang and G. F. Zeng, J. Mater. Chem. A, 2021, 9, 13625–13630 RSC.
- H. T. Nguyen, J. Lee, E. Kwon, G. Lisak, B. X. Thanh, W. D. Oh and K. Y. A. Lin, J. Colloid Interface Sci., 2021, 591, 161–172 CrossRef CAS PubMed.
- H. Lee, J. Goak, J. Choi, B. Kong, C. H. Lee, K. B. Kim, J. Y. Park, Y. Seo, Y. C. Choi and Y. H. Song, Carbon, 2012, 50, 2126–2133 CrossRef CAS.
- V. Žužek and J. Bojkovski, Measurement, 2021, 109619 CrossRef.
- C. Y. Zou, Z. P. Liu, X. F. Wang, H. Liu, M. Yang, D. Q. Huo and C. J. Hou, Spectrochim. Acta, Part A, 2021, 120346 Search PubMed.
- L. L. Wu, H. R. Liu, T. H. Liu and C. L. Li, Chem. Res. Chin. Univ., 2019, 35, 577–580 CrossRef CAS.
- S. Perumal, R. Atchudan, P. Thirukumaran and D. H. Yoon, Chemosphere, 2021, 131760 Search PubMed.
- X. T. Yuan, Y. J. Tu, W. Chen, Z. W. Xu, Y. L. Wei, K. H. Qin, Q. Zhang, Y. Y. Xiang, H. C. Zhang and X. L. Ji, Dyes Pigm., 2020, 108187 CrossRef CAS.
- L. Cai, Z. Fu and F. L. Cui, J. Fluoresc., 2020, 30, 11–20 CrossRef CAS PubMed.
- L. Luo, P. Wang, Y. H. Wang and F. Wang, Sens. Actuators, B, 2018, 273, 1640–1647 CrossRef CAS.
- W. I. Lee, Y. Bae and A. J. Bard, J. Am. Chem. Soc., 2004, 27(126), 8358–8359 CrossRef PubMed.
- F. Messina, L. Sciortino, G. Buscarino, S. Agnello, F. Gelardi and M. Cannas, Mater. Today: Proc., 2016, 3, S258–S265 Search PubMed.
- S. Han, X. Li, Y. Wang and S. Chen, Chem. Eng. J., 2015, 271, 87–95 CrossRef CAS.
- S. K. Chauthe, S. B. Bharate, G. Periyasamy, A. Khanna, K. K. Bhutani, P. D. Mishra and I. P. Singh, Bioorg. Med. Chem. Lett., 2012, 22, 2251–2256 CrossRef CAS PubMed.
- T. Wang, H. Luo, X. Jing, J. Yang and Y. Wang, Molecules, 2021, 26, 1246 CrossRef CAS PubMed.
- Y. J. Li, X. T. Lin, S. L. Qin, L. D. Gao, Y. M. Tang, S. R. Liu and Y. Wang, Chirality, 2020, 32, 1008–1019 CrossRef CAS PubMed.
- M. A. Ahmadi and S. R. Shadizadeh, Fuel, 2015, 159, 15–26 CrossRef CAS.
- Y. Han, J. Li, B. He and L. Li, J. Eng. Fibers Fabr., 2021, 16, 1193–1226 Search PubMed.
- P. Zuo, J. Gao, J. Peng, J. Liu, M. Zhao, J. Zhao, P. Zuo and H. He, Microchim. Acta, 2016, 183, 329–336 CrossRef CAS.
- K. Sharath, M. Arijit, L. Binit, V. M. Manoj, H. Thomas and B. Rahul, J. Am. Chem. Soc., 2012, 134, 19524–19527 CrossRef PubMed.
- K. R. Vijesh, P. N. Musfir, T. Thomas, M. Vaishakh and S. Thomas, Opt. Laser Technol., 2020, 121, 105776 CrossRef CAS.
- B. M. Lowe, C. K. Skylaris and N. G. Green, J. Colloid Interface Sci., 2015, 451, 231–244 CrossRef CAS PubMed.
- S. Lone, D. H. Yoon, H. Lee and I. W. Cheong, Environ. Sci.: Water Res. Technol., 2019, 5, 83–90 RSC.
- M. J. Molaei, Anal. Methods, 2020, 12, 1266–1287 RSC.
- R. Anjana, R. Devi, J. S. Anjali, M. Jayasree and S. Aparna, Microchim. Acta, 2018, 185, 11–22 CrossRef PubMed.
- G. Li and C. Tong, Anal. Chim. Acta, 2020, 1133, 11–19 CrossRef CAS PubMed.
- S. Barman and M. Sadhukhan, J. Colloid Interface Sci., 2016, 482, 8–18 CrossRef PubMed.
- B. Wang, S. Zhuo, L. Chen and Y. Zhang, Spectrochim. Acta, Part A, 2014, 131, 384–387 CrossRef CAS PubMed.
- J. Wang, D. Li, Y. Qiu, X. Liu and J. Hu, Talanta, 2020, 220, 121377 CrossRef CAS PubMed.
- Y. Li, L. Yang, X. Li, T. Miki and T. Nagasaka, J. Hazard. Mater., 2021, 411, 125044 CrossRef CAS PubMed.
- W. R. Cui, W. Jiang, C. R. Zhang, R. P. Liang, J. Liu and J. D. Qiu, ACS Sustainable Chem. Eng., 2020, 8, 445–451 CrossRef CAS.
- M. Syafiqah and H. W. Yussof, Mater. Today: Proc., 2018, 5, 21690–21697 Search PubMed.
- Y. Fu, W. G. Yu, W. J. Zhang, Q. Huang, J. Yan, C. Y. Pan and G. P. Yu, Polym. Chem., 2018, 9, 4125–4131 RSC.
- L. Yu, Colloids Surf., A, 2008, 320, 275–278 CrossRef.
Footnotes |
| † Electronic supplementary information (ESI) available. See https://doi.org/10.1039/d2ra01236g |
‡ Present address: College of Chemistry and Chemical Engineering, Qiqihar University, Qiqihar, Heilongjiang, 161![[thin space (1/6-em)]](https://www.rsc.org/images/entities/char_2009.gif) 006, P. R. China. 006, P. R. China. |
| This journal is © The Royal Society of Chemistry 2022 |

