 Open Access Article
Synthesis and characterization of tung oil-based UV curable for three-dimensional printing resins†
Zicheng Zhaoab,
Hong Wub,
Xudong Liub,
Desheng Kangc,
Zhihong Xiaob,
Qiquan Lin*a and
Aihua Zhang*b
aCollege of Mechanical Engineering and Mechanics, Xiangtan University, Xiangtan 411105, China. E-mail: xtulqq@163.com
bState Key Laboratory of Utilization of Woody Oil Resource, Hunan Academy of Forestry, Changsha 410000, China. E-mail: zhangaihua909@163.com
cHunan Xiangchun Agricultural Technology Co., Ltd, Changsha 410000, China
First published on 10th August 2022
Abstract
Using tung oil as the raw material, a new bio-based prepolymer was successfully synthesized by reacting with acrylic-modified rosin (β-acryloyl nutrient ethyl) ester (ARA)/acrylic-2-hydroxyethyl ester (HEA) followed by the use of the above composite material as the matrix and then reacting with the active diluent (2-HEMA, TPGDA) and the photoinitiator TPO and Irgacure1173 to successfully synthesize a new type of bio-based prepolymer-acrylate-epoxy tung oil polypolymer (AETP). The tung oil monomer before and after the epoxy formation was compared by proton NMR spectroscopy, and the chemical structure of AETP was analyzed by Fourier transform spectroscopy. Tung oil has an acid value of 1.5 mg KOH per g, an epoxy value of 5.38%, an iodine value of 11.28 g/100 g, and a refractive index of n25 = 1.475. Composite-based 3D printing resins (like AETP) were cured using digital light treatment, while some samples were also post-treated via ultraviolet (UV) light treatment. The AETP-based 3D printing resin has excellent thermal and mechanical properties, and the viscosity of its system is 313 mPa s; exposure time 4.5 s; the tensile strength, flexural strength and flexural modulus were 62 MPA, 63.84 MPa and 916.708 MPa, respectively; Shore hardness was 80 HD and shrinkage was 4.00%. The good performance of the AETP-based 3D printing resin is attributed to the rigidity of their tightly crosslinked structure. This study pioneered a method for producing photoactive acrylates (e.g., tung oil-based acrylate oligomer resins) from renewable, low-cost biomass for light-curing 3D printing.
1. Introduction
Three-dimensional (3D) printing has revolutionized product design and manufacturing since its inception. The advantage of 3D printing is that it has higher precision, convenience, speed, and lower environmental impact compared to the traditional mold casting technology.1In recent years, the 3D printing technology based on light curing has developed rapidly. Numerous processes, including direct ink writing (DIW), selective laser sintering (SLS), stereolithography equipment (SLA), digital light processing (DLP), and continuous liquid interface production (CLIP), have been developed to meet a variety of requirements.2 The applicability of this technology continues to expand and it is currently used in healthcare, aerospace, automotive, food industry, art, textiles and fashion, and construction. This technology has revolutionized the manufacture and development of products and has attracted widespread attention around the world.3
The most widely used light-curing 3D printing materials typically consist of acrylic oligomers, including epoxy acrylates, polyesters, polyethers, polyurethanes, and silicones.4 They have the advantages of fast curing and low energy consumption.5–7 However, there are plenty of challenges to overcome before light-curing-based 3D printing technology can be effectively implemented as a common manufacturing technique.8 Materials used in light-curing-based 3D printing must have a low environmental impact while being compatible with light-curing printers, which hinders the large-scale application of the technology.9 Therefore, in numerous light-curing-based 3D printing applications, the development of biomass-based materials to replace petroleum-based prepolymers offers potential for a truly sustainable circular economy.10 Bio-based materials, from the ocean,11 wood,12–14 agricultural residues,15,16 are the most abundant renewable raw materials on the earth, and have shown great potential to replace fossil fuels.
The main component of tung oil is tung oleic acid (>80%), which contains 3-member conjugated double bonds and carboxyl groups and other active groups in its structure, which has strong chemical reaction activity and derivatization potential. Free radical polymerization17,18 and cationic polymerization can also occur under the condition of UV light, especially in light-curing coatings,19,20 and it has been found that when tung oil is added at 20%, together with 50% epoxy, 25% active diluent acryloyl morpholine, 5% triaryl thiol salt and 1% free radical photoinitiator benzoin diethyl ether, the film light curing rate is 93.25%, and the mechanical properties are excellent.21
In addition, tung oil can also be used to prepare plastics,22,23 biodiesel,24 microcapsules,25 etc. Tung oil can also be used as a resin-modified matrix, mixed with other raw materials via chemical modification to prepare tung oil-based coatings.26 The annual output of tung oil in China is more than 100![[thin space (1/6-em)]](https://www.rsc.org/images/entities/char_2009.gif) 000 tons, accounting for 80% of the world's tung oil production. Tung oil-based products have the characteristics of good adhesion, strong water resistance, and excellent electrical insulation,27 and have been widely used in the modification of synthetic resins. The level of utilization technology of tung oil in China is low, and past research has mainly focused on the direct use of tung oil as an anti-corrosion coating, ink additive, or release oil; or its boiling mature oil as a rain gear tarpaulin coating, waterproofing and anti-rust coating for steel components, and varnish and insulating varnish.28 These uses are generally achieved by the oxygen polymerization reaction of the 3-member conjugated double bond in tung oil, the resulting material has strong brittleness, greatly affecting the durability and use performance of the material, if you can use the active group contained in tung oil, through the Diel–Alder reaction,29,30 Friedel–Crafts reaction,31 epoxidation, amidation and esterification, and other chemical reactions through the introduction of more reactive reaction groups. In addition, the molecular structure and size are designed through atomic transfer radical polymerization, which can not only greatly improve the brittleness of tung oil-based products but also increase the added value of tung oil products and further expand the scope for the use of tung oil.32 In recent years, with the increase in the depletion of petrochemical resources, renewable resources have attracted the attention of various countries. The use of China's rich tung oil resources to develop tung oil downstream products has great practical significance in today's era of increasing shortage of petrochemical resources.33
000 tons, accounting for 80% of the world's tung oil production. Tung oil-based products have the characteristics of good adhesion, strong water resistance, and excellent electrical insulation,27 and have been widely used in the modification of synthetic resins. The level of utilization technology of tung oil in China is low, and past research has mainly focused on the direct use of tung oil as an anti-corrosion coating, ink additive, or release oil; or its boiling mature oil as a rain gear tarpaulin coating, waterproofing and anti-rust coating for steel components, and varnish and insulating varnish.28 These uses are generally achieved by the oxygen polymerization reaction of the 3-member conjugated double bond in tung oil, the resulting material has strong brittleness, greatly affecting the durability and use performance of the material, if you can use the active group contained in tung oil, through the Diel–Alder reaction,29,30 Friedel–Crafts reaction,31 epoxidation, amidation and esterification, and other chemical reactions through the introduction of more reactive reaction groups. In addition, the molecular structure and size are designed through atomic transfer radical polymerization, which can not only greatly improve the brittleness of tung oil-based products but also increase the added value of tung oil products and further expand the scope for the use of tung oil.32 In recent years, with the increase in the depletion of petrochemical resources, renewable resources have attracted the attention of various countries. The use of China's rich tung oil resources to develop tung oil downstream products has great practical significance in today's era of increasing shortage of petrochemical resources.33
To date, significant research has been conducted on the development of tung oil light curing, a process that uses photosensitive tung oil as a light curing material. However, the light curing of tung oil oligomers for 3D printing has rarely been reported. To evaluate the potential application of tung oil-based acrylates in the field of 3D printing, we prepared acrylate-epoxy tung oil polypolymers (AETPs) and analyzed their properties using chemical and spectroscopic methods. The AETP-based 3D printing resin with excellent printing performance was prepared. In general, 3D products printed using AETP have excellent thermal and mechanical properties. The good material properties exhibited by bio-based AETP resins demonstrate the utility of photoactive acrylates over a wide range of applications.
2. Experimental
2.1 Raw materials
Tung oil was obtained from Guosheng Bioenergy Co., Ltd. in Chenzhou City, Hunan Province. Acrylic modified rosin (β monoacryloyloxyethyl) ester (ARA), synthesized according to literature,34 n-butanol, absolute ethanol, 2-hydroxyethyl methacrylate (HEMA), hydroquinone, xylene, H2O2, formic acid, NaCl solution, tripropylene glycol diacrylate (TPGDA) and 2,4,6-trimethylbenzoyldiphenylphosphine (TPO) were purchased from Aladdin Industries. Photoinitiator 2-hydroxy-2-methyl-1-phenyl-1-acetone (trade name Irgacure1173), ACROS, and all other materials were used as-received without further purification.2.2 Preparation of tung oil-based photosensitive monomers
2.3 Preparation of UV-curable composites based on tung oil
The epoxy tung oil was mixed with the active diluents HEA, ARA, and photoinitiator according to the proportions given in Table 1, and 5 groups of ultraviolet curable paint samples were prepared, coated into a film at 25 μm, and light cured at a distance of 5 cm. Subsequently, one of the sets of samples was prepared by homogeneously mixing one of the samples with the reactive diluent (2-HEMA, TPGDA) and the photoinitiators TPO and Irgacure1173. The recipes are shown in Table 2.| Samples | Epoxy tung oil (g) | ARA (%) | HEA (%) | 1173 (%) |
|---|---|---|---|---|
| 1# | 20 | 97 | 0 | 3 |
| 2# | 20 | 87 | 10 | 3 |
| 3# | 20 | 77 | 20 | 3 |
| 4# | 20 | 67 | 30 | 3 |
| 5# | 20 | 57 | 40 | 3 |
| Formulation | Composites (wt%) | 2-HEMA (wt%) | TPGDA (wt%) | TPO (wt%) | 1173 (wt%) |
|---|---|---|---|---|---|
| AETP-1 | 55 | 20 | 20 | 3 | 2 |
| AETP-2 | 65 | 15 | 15 | 3 | 2 |
| AETP-3 | 75 | 10 | 10 | 3 | 2 |
2.4 Preparation of AETP resin based on UV curing materials
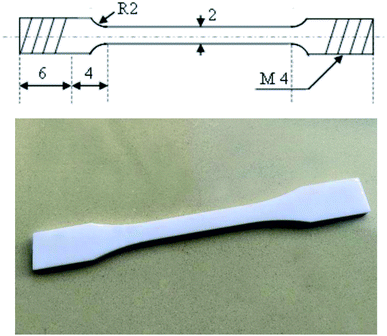
3D architecture used was a commercial Lite600HD 3D printer (Shanghai Luen Thai Technology Co., Ltd.). Solidworks 2018 modeling software was used to create samples for bending, tensile, and impact performance testing. The specimen was prepared according to the sample size specified in the national model standards, such as GB/T 1040.2-2006, GB/T 9341-2000, and GB/T 1843-2008. The file was saved in the STL format, imported into a 3D printer, and printed using the prepared photosensitive resin. The 3D printed product was soaked in an anhydrous ethanol bath for 5 min to remove any unreacted substances and then dried under ambient conditions.2.5 Characterization
![[thin space (1/6-em)]](https://www.rsc.org/images/entities/char_2009.gif) :
:![[thin space (1/6-em)]](https://www.rsc.org/images/entities/char_2009.gif) 40 (volume ratio), shaken well, and placed in the reagent bottle, capped and set aside. A certain amount of NaOH was weighed, and 95% ethanol was used to prepare a 0.1 mol L−1 NaOH ethanol solution, which was shaken well and placed into the reagent bottle, and the lid was covered for later use. The above solution should be used quickly to avoid its deterioration. A 0.5 g of the sample was taken into a clean Erlenmeyer flask, and 20 mL of the prepared hydrochloric acid-acetone solution was slowly added; the solution was covered and shaken thoroughly until it was uniform for about 0.5–1 h. Five drops of phenolphthalein were added and the added NaOH ethanol solution was titrated until the solution was light pink, and the color did not fade within 30 s. Two blank titrations were performed according to the above method.
40 (volume ratio), shaken well, and placed in the reagent bottle, capped and set aside. A certain amount of NaOH was weighed, and 95% ethanol was used to prepare a 0.1 mol L−1 NaOH ethanol solution, which was shaken well and placed into the reagent bottle, and the lid was covered for later use. The above solution should be used quickly to avoid its deterioration. A 0.5 g of the sample was taken into a clean Erlenmeyer flask, and 20 mL of the prepared hydrochloric acid-acetone solution was slowly added; the solution was covered and shaken thoroughly until it was uniform for about 0.5–1 h. Five drops of phenolphthalein were added and the added NaOH ethanol solution was titrated until the solution was light pink, and the color did not fade within 30 s. Two blank titrations were performed according to the above method.E: epoxide value, mol/100 g;
V: blank experiments consumed the average volume of NaOH ethanol solution, mL;
V1: the titration of the sample taken consumes the volume of NaOH ethanol solution, mL;
c: molar concentration of NaOH ethanol solution, mol L−1;
m: the weight of the specimen, g.
DB: molar fraction of double bonds in 100 g sample, mol/100 g;
wstandard: mass of 1,4-dioxane, g;
wsample: the weight of the specimen, g;
88 is the relative molecular mass of 1,4-dioxane, g mol−1;
8 is the number of H protons for 1,4-dioxane;
3 is the number of H protons for the double bond;
A is the peak area of double bond NMR absorption;
B is the peak area of the methylene NMR in 1,4 dioxane.35
 .
.3. Results and discussion
3.1 Results and analysis of the influence of univariate factors on the epoxidation reaction of tung oil
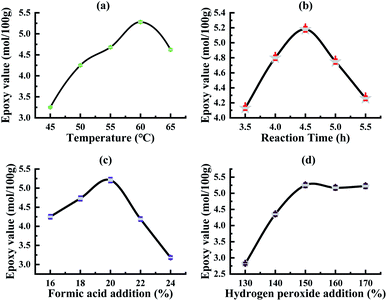
The results are shown in Fig. 2(a): temperature has a more obvious impact on tung oil epoxidation. As the reaction temperature increases, the epoxy value of tung oil increases first; when the reaction temperature reaches 60 °C, the epoxy value reaches the maximum; as the temperature continues to rise, epoxy value begins to decline. The reason is that when the temperature is low, the oil epoxy rate is low, while the increase in temperature will promote the epoxidation reaction. When the temperature is higher, the side reactions will occur in the reaction system, so that the ring-opening reaction rate in the oil system is accelerated, and at this time, the reaction rate of the oil ring-opening reaction in the system is greater than the epoxidation reaction rate, and the solid epoxy value is reduced. Therefore, considering the analysis, the most suitable reaction temperature for tung oil epoxidation is 60 °C.
The results are shown in Fig. 2(b): as the reaction time gradually increases, the epoxy value of tung oil increases first; when the reaction time reaches 4.5 h, the epoxy value of tung oil reaches the maximum; and as the reaction time continues to extend, the epoxy value of tung oil continues to decrease.
Because in the autocatalytic reaction system, as the reaction is carried out, the epoxy bonding is gradually increased, the hydrogen peroxide concentration gradually decreases with the reaction and a large amount of free formic acid is gradually generated;38 after a certain period of time, in the reaction system, the epoxy oil ring opening side reaction occurs, and at this time, the oil ring opening reaction rate is greater than the epoxy reaction rate, and the epoxy value of the solid tung oil continues to decrease, and the most suitable epoxy reaction time in the process of the tung oil epoxidation reaction in the self-catalytic system can be obtained at 4.5 h.
The results are shown in Fig. 2(c): as the amount of formic acid is added, the epoxy value shows at first an increasing trend and then decreasing, and the epoxy value reaches the maximum when the amount of formic acid added (the mass percentage of tung oil) is 20%. As the amount of formic acid added continues to increase, the epoxy value becomes smaller due to the excessive amount of formic acid added, resulting in too much free formic acid being produced in the reaction system, so that the ring opening reaction of epoxy grease is accelerated; when the ring opening rate is greater than the epoxy rate, the tung oil epoxy value decreases; hence, the analysis shows that the most suitable formic acid addition amount is 20%.
The results are shown in Fig. 2(d): the epoxy value of the obtained oil by the tung oil epoxidation reaction varies significantly with the different amounts of hydrogen peroxide added, and in the tung oil epoxidation autocatalytic reaction system, with the increase in the amount of hydrogen peroxide, the epoxy value of the tung oil epoxidation reaction gradually reaches equilibrium and stabilizes after the rapid growth of the epoxidation reaction. Because the amount of hydrogen peroxide added at the initial stage is relatively small, the content of peroxyformic acid in the autocatalytic reaction system is low, which generates a large amount of free formic acid in the reaction system, which will aggravate the side reactions in the reaction, thereby reducing the epoxy rate. Moreover, when the amount of hydrogen peroxide is continuously increased, the amount of hydrogen peroxide added increases to 150% of the oil mass, and the epoxy value reaches the maximum value and then tends to be stable. When the amount of formic acid is a certain value, the amount of peroxide generated in the system remains unchanged. As such, the analysis can be seen that the optimal hydrogen peroxide addition amount is 150% (oil mass fraction).
Based on the above experiments and the analysis of the results, it can be seen that the optimal reaction conditions for the tung oil epoxidation reaction in the autocatalytic reaction system are: the temperature of 60 °C, reaction time of 4.5 h, amount of formic acid as 20% (oil mass percentage) and amount of hydrogen peroxide as 150% (oil mass percentage).
3.2 Optimization of the epoxidation reaction process of tung oil by the response surface method
See Pages S16–S20.†3.3 Characterization and performance analysis of epoxy greases
3.3.1.1 Nuclear magnetic analysis. From Fig. S4,† it can be seen that the absorption peak at 5.0–5.5 ppm belongs to the hydrogen atom on the tung oil conjugate double bond. The absorption peak at 4.0–4.5 ppm is due to the chemical displacement of the hydrogen in –CH–O–. The absorption peak at around 3.1 ppm is the characteristic absorption peak of the generated epoxy group. The absorption peak at 2.0–2.2 ppm is due to the chemical shift of the hydrogen in CH2–C
![[double bond, length as m-dash]](https://www.rsc.org/images/entities/char_e001.gif) C. The absorption peak at 2.4 ppm is the chemical displacement of the O
C. The absorption peak at 2.4 ppm is the chemical displacement of the O![[double bond, length as m-dash]](https://www.rsc.org/images/entities/char_e001.gif) C–CH2– hydrogen. The absorption peak at 1.2–1.3 ppm is due to the chemical displacement of –CH2–hydrogen, and that at 1.6 ppm is due to the chemical displacement of the –CH2–C
C–CH2– hydrogen. The absorption peak at 1.2–1.3 ppm is due to the chemical displacement of –CH2–hydrogen, and that at 1.6 ppm is due to the chemical displacement of the –CH2–C![[double bond, length as m-dash]](https://www.rsc.org/images/entities/char_e001.gif) C
C![[double bond, length as m-dash]](https://www.rsc.org/images/entities/char_e001.gif) C– hydrogen. The absorption peak near 0.9 ppm is due to the chemical shift of –CH3. It can be seen that before the tung oil reaction and after the epoxidation reaction, the hydrogen on the double bond and the hydrogen displacement on the carbon near the double bond have changed; the hydrogen absorption peak due to the double bond of tung oil before the reaction appears at 5.36 ppm and the absorption peak of epoxy tung oil disappears at this location after the epoxy reaction. The hydrogen absorption peak corresponding to the new epoxy bond appears at 3.12 ppm, and the hydrogen displacement on the other bonds does not change, which indicates that the carbon–carbon double bond is generated after the hydrogen-catalytic reaction of hydrogen peroxide–formic acid.38
C– hydrogen. The absorption peak near 0.9 ppm is due to the chemical shift of –CH3. It can be seen that before the tung oil reaction and after the epoxidation reaction, the hydrogen on the double bond and the hydrogen displacement on the carbon near the double bond have changed; the hydrogen absorption peak due to the double bond of tung oil before the reaction appears at 5.36 ppm and the absorption peak of epoxy tung oil disappears at this location after the epoxy reaction. The hydrogen absorption peak corresponding to the new epoxy bond appears at 3.12 ppm, and the hydrogen displacement on the other bonds does not change, which indicates that the carbon–carbon double bond is generated after the hydrogen-catalytic reaction of hydrogen peroxide–formic acid.38
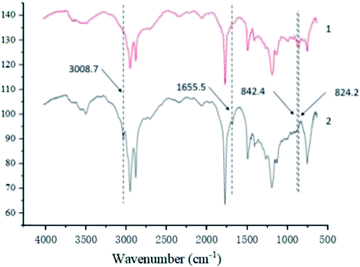
3.3.1.2 Infrared spectral analysis. Fig. 3 shows the amplified vibration absorption peak of the carbon–hydrogen bond in the carbon–carbon double bond at the 3008.7 cm−1 and the carbon–carbon double bond telescopic vibration absorption peak at the 1655.5 cm−1 in epoxy tung oil has basically disappeared, it can also be seen from the spectra that the epoxy tung oil has generated a ternary cyclic ether C–O–C asymmetric cis-C asymmetric telescopic vibration absorption peaks at the position of 24.2 cm−1 and 842.4 cm−1, which can indicate that the tung oil has undergone epoxidation reaction and the target epoxy tung oil has been generated, consistent with the results of MRI characterization.
| Acid (mg KOH per g) | Epoxy value (g/100 g) | Iodine value (gI2/100 g) | Refractive index (25 °C) |
|---|---|---|---|
| 1.5 | 5.38 | 11.28 | 1.475 |
3.4 Characterization of tung oil-based UV-curable materials
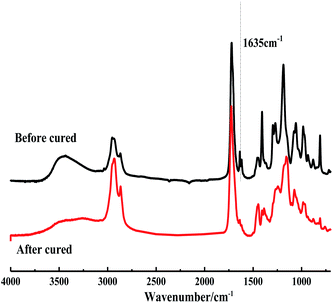
![[double bond, length as m-dash]](https://www.rsc.org/images/entities/char_e001.gif) O of the acrylate group and the C–H telescopic vibration peaks in CH
O of the acrylate group and the C–H telescopic vibration peaks in CH![[double bond, length as m-dash]](https://www.rsc.org/images/entities/char_e001.gif) CH, respectively, of which the C–H telescopic vibration peaks in CH
CH, respectively, of which the C–H telescopic vibration peaks in CH![[double bond, length as m-dash]](https://www.rsc.org/images/entities/char_e001.gif) CH are the reaction peaks and the telescopic vibration peaks of C
CH are the reaction peaks and the telescopic vibration peaks of C![[double bond, length as m-dash]](https://www.rsc.org/images/entities/char_e001.gif) O are reference peaks. As can be seen from Fig. S5,† the characteristic vibration of the C
O are reference peaks. As can be seen from Fig. S5,† the characteristic vibration of the C![[double bond, length as m-dash]](https://www.rsc.org/images/entities/char_e001.gif) C double bond located at the 1636 cm−1 position gradually decreases with the extension of the curing time, and only one C
C double bond located at the 1636 cm−1 position gradually decreases with the extension of the curing time, and only one C![[double bond, length as m-dash]](https://www.rsc.org/images/entities/char_e001.gif) C double bond absorption peak can be observed at 240 s, indicating that the curing reaction is basically complete.
C double bond absorption peak can be observed at 240 s, indicating that the curing reaction is basically complete.| Series | Left contact angle/degrees | Right contact angle/degrees | Average contact angle/degrees |
|---|---|---|---|
| 1# | 46.37 | 48.22 | 47.23 |
| 2# | 36.41 | 36.23 | 36.17 |
| 3# | 29.27 | 29.16 | 28.97 |
| 4# | 19.91 | 19.46 | 19.91 |
| 5# | 18.83 | 18.02 | 18.15 |
| Series | Content of HEA/% | Adhesion/degree | Pencil hardness |
|---|---|---|---|
| 1# | 0 | 3 | 3H |
| 2# | 10 | 2 | 3H |
| 3# | 20 | 1 | 2H |
| 4# | 30 | 1 | H |
| 5# | 40 | 1 | HB |
Under the same amount of the initiator addition, on the one hand, the molecular weight of BP is large, and the mole number of BP actually added is relatively small. On the other hand, the free radicals produced by BP are still inactivated. Therefore, considering that in this system, Darocur 1173 has a better effect than BP initiation.
3.5 Characterization of tung oil-based 3D printing AETP resins and products
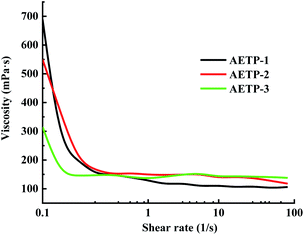
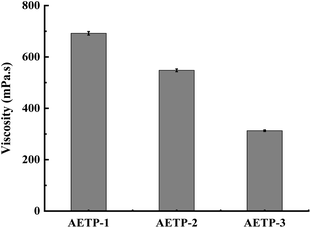
In addition to preventing the pressure of the resin from being severely sheared and thinning caused by the lifting and moving of the table when printing, it is also necessary to avoid the problem that the resin stick is very large and the flow is poor, resulting in the filling of the bottom printing layer in a timely manner. Therefore, a formulation with a low shear thinning degree, low viscosity, and stable flow should be selected. Compared with the viscosity of the EPIC type resin from a German company of 361.7 mPa s and the NHC02 type resin of a company in Shanghai with 300 mPa s, it can be seen that the viscosity of the 3D printed resin products on the market is about 1000 mPa s or less. As shown in Fig. 11, the viscosity of different formulations at a shear rate of 0.1 s−1, compared with the viscosities of formulation AETP-1, AETP-2, AETP-3, AETP-3, the viscosity reduction was the most significant and could effectively control the viscosity of the system at about 313–548 mPa s, and can be used as the preferred formulation to reduce viscosity.
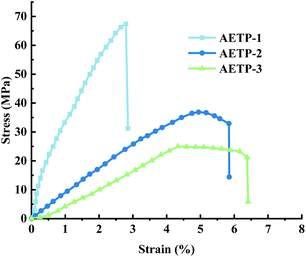
The stress and strain curves of the specimen being stretched and deformed to break at different times are shown in Fig. 14.
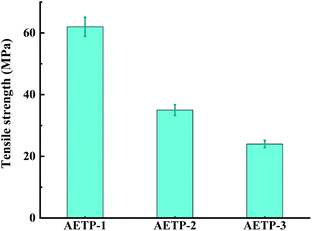
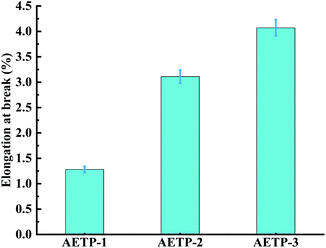
Formulation AETP-1 was consistent with Hooke's law when stress increases during tension as the strain increases, and fracture occurs when the maximum stress is reached.42 The material has linear elasticity and the test strip undergoes brittle fracture. The curves for the formulations AETP-2 and AETP-3 are divided into two stages, and the stress increased linearly with the increase in strain at the beginning, which belonged to the linear elastic stage. After reaching the maximum stress, the stress changed nonlinearly with the increase in strain and gradually decreased, which belongs to the shaping and softening stage.43 This is because when the sample is stretched by external forces, the long chain of polymers will be stretched oriented, and a more obvious yield phenomenon occurred.44 Compared with the German company's EPIC type resin's elongation at the break of 7.46%, WIC100 type resin elongation was at the break of 6.3%, its flexibility is better than that of the homemade one. Follow-up should also be performed in the aspect of flexibility and toughening. Overall, formulations AETP-1 and AETP-2 have greater tensile strength after curing, while formulations AETP-2 and AETP-3 have better flexibility and toughening effect after curing (Fig. 15).
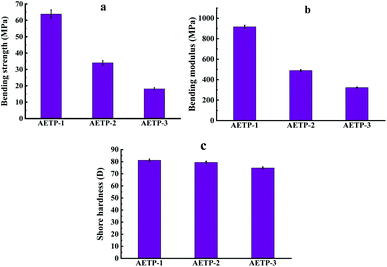
As can be seen from Fig. 16(a) and (b), with the increase in the diacrylate content of dipropylene glycol diacrylate and the decrease of the matrix content of the composite material, the flexural strength and flexural modulus of the resin after curing are significantly increased. It is explained that the increase of benzene ring content in the printing material can improve the bending resistance of the resin after curing, show extremely high rigidity, and resist greater bending stress. Compared with the bending strength of 23 MPa of the EPIC type resin from a German company and the bending strength of 50 MPa of the NHC02 type resin from a company in Shanghai of, it can be seen that formulation AETP-1 and formulation AETP-2 show good tensile strength. As can be seen from Fig. 16(c), the surface hardness of the cured AETP-1 and AETP-2 print materials was excellent, and the Shore hardness could reach about 80 D, without significant differences. The cured formulation AETP-3 showed a slightly weaker Shore hardness (75 D), which was 6.25% lower than that of the other two.
In order to show better-bending resistance and surface hardness after resin light curing, priority should be given to the ratio of the two printing materials of the formulation AETP-1 and AETP-2, which is more conducive to printing precision small components such as gem. This ensures that the components under the table shovel and cleaning process avoid obvious elongation deformation caused by the resin being too flexible.
4. Conclusions
Acrylate-epoxy tung oil polypolymer AETP was prepared from tung oil. The structure of the compound was determined by infrared spectroscopy. Using tung oil matrix composites as prepolymers, a new type of AETP resin suitable for light-curing 3D printing was developed (2-HEMA, TPGDA as active diluent; TPO and Irgacure 1173 as photoinitiators). This resin meets the requirements for use in desktop-grade 3D printers. The prepared tung oil-based 3D printing resin has good mechanical properties and is suitable for the application of ultraviolet curing materials. The prepared 3D printing products have good mechanical properties and thermal properties. The benzene ring in the formulation can effectively improve the performance of 3D printing products. When the AETP content in the resin reached 55%, the tensile strength of the 3D printing product was 63.84 MPa, the hardness was 80 HD, the exposure time was 4.5 s, and the viscosity was 313 mPa s. The results show that UV photo reparation can effectively improve the performance of 3D printed products. The crosslinking density effectively improves the mechanical properties of 3D printing products based on MCPP resin. Tung oil-derived AETP forms a bio-based acrylate that could be a suitable alternative to petrochemical acrylates. This study not only reports a preparation method of photoactive acrylate for light-curing 3D printing but also strongly promotes the application of woody oil biomass resources in light-curing 3D printing, which is of particular significance for the development of sustainable polymers.Funding
This work was supported by Major Landmark Innovation Demonstration Project, 2019XK2002; Changsha Functional Oil Technology Innovation Center, KH2101007; Hunan Forestry Bureau Outstanding Training Research Project, XLK202108-2.Author contributions
Zicheng Zhao: methodology, software, formal analysis, investigation, writing—original draft preparation, writing—review, and editing; Hongwu: modification; Xudong Liu: methodology, data curation, writing—original draft preparation, writing—review and editing; Desheng Kang: software; Zhihong Xiao: validation and funding acquisition; Qiquan Lin: conceptualization; Aihua Zhang: methodology, resources, and funding acquisition;Conflicts of interest
The authors announce that they have no known competing financial interests or personal relationships that could have appeared to influence the work reported in this paper.Acknowledgements
The authors gratefully appreciate the support of this work by the Hunan Academy of Forestry by providing the necessary facilities.References
- I. Volyanskii and I. V. Shishkovsky, New Trends in 3D Printing, IntechOpen, 2016, DOI:10.5772/63565.
- X. Kuang, D. J. Roach, J. Wu, C. M. D. Hamel, Z. Ding, T. Wang, M. L. Dunn and H. J. Qi, Adv. Funct. Mater., 2019, 29, 1805290 CrossRef.
- F. P. W. Melchels, M. A. N. Domingos, T. J. Klein, J. Malda, P. J. Bartolo and D. W. Hutmacher, Prog. Polym. Sci., 2012, 37, 1079–1104 CrossRef CAS.
- J. Zhang and P. Xiao, Polym. Chem., 2018, 9, 1530–1540 RSC.
- D. Chattopadhyay and K. Raju, Prog. Polym. Sci., 2007, 32, 352–418 CrossRef CAS.
- M. Sangermano, N. Razza and J. V. Crivello, Macromol. Mater. Eng., 2014, 299, 775–793 CrossRef CAS.
- R. D. Farahani, K. Chizari and D. Therriault, Nanoscale, 2014, 6, 10470–10485 RSC.
- C. Williams, A. James, M. P. Chae and D. J. Hunter-Smith, J. Foot Ankle Res., 2015, 8, O41 CrossRef.
- B. Zhang, K. Kowsari, A. Serjouei, M. L. Dunn and Q. Ge, Nat. Commun., 2018, 9, 1831 CrossRef PubMed.
- A. V. Wijk and I. v. Wijk, 3D Printing with Biomaterials: Towards A Sustainable and Circular Economy, 2015 Search PubMed.
- S. K. Bhatia and K. W. Ramadurai, 3D Printing and Bio-Based Materials in Global Health, Springer International Publishing AG, 2017 Search PubMed.
- E. M. Fernandes, R. A. Pires, J. F. Mano and R. L. Reis, Prog. Polym. Sci., 2013, 38, 1415–1441 CrossRef CAS.
- J. Liu, R. Korpinen, K. S. Mikkonen, S. Willför and C. Xu, Cellulose, 2014, 21, 2587–2598 CrossRef CAS.
- L. Zhang, Z. Liu, G. Cui and L. Chen, Prog. Polym. Sci., 2015, 43, 136–164 CrossRef CAS.
- C. Zhang, T. F. Garrison, S. A. Madbouly and M. R. Kessler, Prog. Polym. Sci., 2017, 71, 91–143 CrossRef CAS.
- Q. Wu, Y. Hu, J. Tang, J. Zhang, C. Wang, Q. Shang and W. Lei, ACS Sustainable Chem. Eng., 2018, 6, 8340–8349 CrossRef CAS.
- N. Thanamongkollit, K. R. Miller and M. D. Soucek, Prog. Org. Coat., 2012, 73, 425 CrossRef CAS.
- X. Yang, S. Li, J. Xia, J. Song, K. Huang and M. Li, Ind. Crops Prod., 2015, 63, 17 CrossRef CAS.
- B. Liang, J. Zhao, G. Li, Y. Huang, Z. Yang and T. Yuan, Ind. Crops Prod., 2019, 138, 111585 CrossRef CAS.
- L. Man, Y. Feng, Y. Hu, T. Yuan and Z. Yang, J. Cleaner Prod., 2019, 241, 118341 CrossRef CAS.
- Z. Yang, X. Ye, J. Huang, B. Liang and T. Yuan, Mater. Rep., 2018, 32, 3831–3838 Search PubMed.
- M. Li, S. Li, J. Xia, C. Ding, M. Wang, L. Xu, X. Yang and K. Huang, Mater. Des., 2017, 122, 366 CrossRef CAS.
- D. Wu, B. Chen, R. Sun and G. Liu, J. Anal. Appl. Pyrolysis, 2017, 128, 143–155 CrossRef CAS.
- D. H. Qi, K. Yang, D. Zhang, B. Chen, Q. Wei and C. H. Zhang, Renewable Energy, 2017, 113, 1201 CrossRef CAS.
- H. Li, Y. Cui, Z. Li, Y. Zhu and H. Wang, Prog. Org. Coat., 2018, 115, 164 CrossRef CAS.
- M. Desroches, M. Escouvois, R. Auvergne, S. Caillol and B. Boutevin, Polym. Rev., 2012, 52, 38 CrossRef CAS.
- M. Y. Shah and S. Ahmad, Prog. Org. Coat., 2012, 75, 248–252 CrossRef CAS.
- M. Li, S. Li, J. Xia, C. Ding, M. Wang, L. Xu, X. Yang and K. Huang, Mater. Des., 2017, 366–375 CrossRef CAS.
- S. Levine, H. J. Stevenson and P. W. Kabler, Arch. Biochem. Biophys., 1953, 45, 65–73 CrossRef CAS PubMed.
- M. Wang, J. Xia, J. Jiang, S. Li, K. Huang, W. Mao and M. Li, Polym. Degrad. Stab., 2016, 133, 136–143 CrossRef CAS.
- J. Seetula, K. Kalliorinne and J. Koskikallio, J. Photochem. Photobiol., A, 1988, 43, 31–41 CrossRef CAS.
- V. V. Korshak, S. L. Sosin, G. L. Slonimskii, A. A. Askadskii, L. I. Zakharkin, A. I. Kovredov, B. A. Antipova, K. A. Bychko and Z. S. Shaugumbekova, Pergamon, 1986, 28, 265–271 Search PubMed.
- X. Liu, F. P. Bouxin, J. Fan, V. L. Budarin, C. Hu and J. H. Clark, ChemSusChem, 2020, 13, 4296–4317 CrossRef CAS PubMed.
- H. Wu, M. Lin, J. Wang, C. Wang and F. Chu, Chem. Ind. For. Prod., 2009, 30, 43–46 Search PubMed.
- X. Wang, Master thesis, Guangdong University of Technology, 2019 Search PubMed.
- Y. Zhong, Master thesis, Guangdong University of Technology 2018 Search PubMed.
- K. Li, Master thesis, South China University of Technology, 2018 Search PubMed.
- G. Lu and W. Liu, Journal of Henan University of Technology (Natural Science Edition), 2019, 40, 26–31 Search PubMed.
- N. Moszner and U. Salz, Prog. Polym. Sci., 2001, 26, 535–576 CrossRef CAS.
- X. Chen, J. Zhang, W. Xu and J. Liu, Polym. Bull., 2019, 6, 68–70 Search PubMed.
- J. Hu, P. Fu, H. x. Ma and W. Sang, Mod. Paint Finish., 2012, 15, 1–3 CAS.
- X. Gao, W. Yang, B. Chi, Z. Jiao and J. Tan, China Plastics, 2015, 29, 73–76 CAS.
- F. Wang, Master thesis, South China University of Technology, 2012 Search PubMed.
- W. Zhang, P. Du, G. Jiang, L. Sun and S. Song, Modern Machinery, 2008, 93–94 Search PubMed.
Footnote |
| † Electronic supplementary information (ESI) available. See https://doi.org/10.1039/d2ra03182e |
| This journal is © The Royal Society of Chemistry 2022 |


