 Open Access Article
A theoretical study on the on–off phosphorescence of novel Pt(II)/Pt(IV)–bisphenylpyridinylmethane complexes†
Guoxun Zhu a,
Zhenping Chena,
Huacan Songab,
Ao You*c and
Zhengquan Li*a
aGuangdong Provincial Key Laboratory of Chemical Measurement and Emergency Test Technology, Institute of Analysis, Guangdong Academy of Sciences (China National Analytical Center, Guangzhou), Guangzhou, 510070, P. R. China. E-mail: lzq@fenxi.com.cn
bSchool of Chemical Engineering and Technology, Sun Yat-sen University, Zhuhai, 519082, P. R. China
cSchool of Eco-Environmental Technology, Guangdong Industry Polytechnic, 152 Xingang West Road, Guangzhou, 510300, P. R. China. E-mail: 2015100029@gdip.edu.cn
First published on 22nd June 2022
Abstract
An in-depth theoretical study on the Pt(II)/Pt(IV)–bisphenylpyridinylmethane complexes was carried out, which focused on the geometric/electronic structures, excitation procedures, on–off phosphorescence mechanisms, and structure–optical performance relationships. The key roles of the linkages (LK) connected in the middle of phenylpyridines were carefully investigated using multiple wavefunction analysis methods, such as non-covalent interaction (NCI) visualizations and natural bond orbital (NBO) studies. The phosphorescence-off phenomenon was considered by hole–electron analysis and visualizations, spin–orbit coupling (SOC) studies, and NBO analysis. Through these investigations, the relationship of the substituents in LK and the optical performances were revealed, as well as the fundamental principles of the phosphorescence-quenching mechanism in Pt(IV) complexes, which pave the way for further performance/structural renovation works. In addition, an intuitive visualization method was developed using a heatmap to quantitatively express the SOC matrix elementary (SOCME), which is helpful for big data simplification for phosphorescence analysis.
Introduction
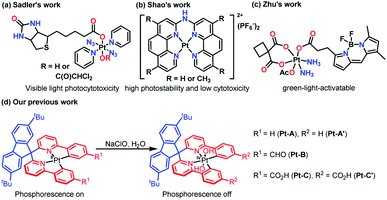
Taking advantage of the special reactivities of Pt and adjustable properties of ligands, Pt complexes have been widely applied in catalysis,1a medical fields,1b,c trace detection of ions/organic compounds,1d,e identification of biostructures,1f and optical applications.1g The biocompatibility and photosensitivity of Pt have inspired Pt-based photoactivatable prodrugs design, and a lot of novel Pt complexes have been synthesized to explore the structure–activity relationships.For instance, Sadler's group synthesized trans,trans,trans-[Pt(py)2(N3)2(biotin)(OH)] and trans,trans,trans-[Pt(py)2(N3)2(biotin)(DCA)] by an esterification reaction2a (Fig. 1a), through which the binding properties to avidin and the aqueous solubility were improved. The products exhibited high visible light photocytotoxicities, which showed potential in phototherapy. Shao and co-workers prepared two Pt complexes ([Pt(bpa)]2+ and [Pt(dmbpa)]2+) that possessed high photostabilities and low cytotoxicities via chelation,2b and the products were developed as fluorogenic imaging probes specific for RNA G-quadruplexes in live cells (Fig. 1b). Zhu's team synthesized a carboplatin-based Pt(IV) prodrug functionalized with a boron dipyrromethene ligand at the axial position,2c which photoactivated the compound and improved the efficacies and selectivities (Fig. 1c). Apparently, the ligand structures were closely related to the photoreactivity, making a comprehensive understanding of the structure–optical performance relationship a key point in the fields of Pt-based detection and phototherapy. Taking advantage of density functional theory (DFT) studies and the development of time-dependent DFT (TD-DFT) methods, numerous theoretical works3a,b have focused on the excitation mechanisms for Pt-based compounds, which have promoted a better understanding of the optical performance and brought insights for advanced material design.
In our previous work, three Pt(II)–bisphenylpyridinylmethane complexes (Pt-A, Pt-B, and Pt-C) were synthesized and applied for the detection of hypochlorite ions through an oxidizing process,4 during which Pt(IV) species (Pt-A′ and Pt-C′) were yielded and turned phosphorescence off (Fig. 1d). Some preliminary DFT studies, including theoretical spectra interpretations and frontier orbitals visualizations, were incidentally performed. However, a few key points were not fully revealed, e.g. what was the role of the LK (Fig. 1d, coloured in blue) for absorption/emission, why did the oxidized Pt(IV) complexes lose phosphorescence, how were the electronic structures changed during the excitations process, etc. Answering these questions may supply a clearer understanding about the structure–optical performance relationship and pave the way for further structural renovations or performance modification works. In this paper, an in-depth theoretical study on the related Pt(II)/Pt(IV) complexes was performed focused on the geometric/electronic structures, and detailed mechanism in the absorption/emission process, as well as the relationship between the ligand structures and optical properties.
Computational details
For the purpose of investigating the SOC and accelerating computing, ORCA5a–d computational suite 5.0.0 was applied in this work. DFT methods, including B3LYP,6a–c PBE0 (ref. 6d and e), TPSS,6f and TPSSh6f,g were screened in geometry optimization tasks along with the Ahlrichs double-zeta basis set def2-SVP6h,i (standard) and def2-SVP/J6i (auxiliary), combining the D3 version of Grimme's dispersion6j,k in the gas phase. The resolution of identity (RI) approximation6l,m and tight SCF criteria were employed in the calculations. Frequency analysis was performed for the optimized structures at the same level and no virtual frequency was found, which ensured the optimization of the structures to a minimum point. The wavefunction generated at the PBE0-D3/def2-SVP level was selected for NCI studies7a and NBO analysis.5e,7b–d Excited states (ES) were calculated at the TD-PBE0/ZORA-def2-SVP6n–s level with the SARC-def2-SVP/J6t auxiliary basis set and RI-SOMF(1X)6u approximation. Also, the results were applied for hole–electron analysis,7e SOC studies, and absorption wavelength summaries. Triplet structures were optimized at the PBE0-D3/def2-SVP level by setting the multiplicity as 3, and the wavefunctions of the optimized structures were utilized to study the spin densities. Extractions of the energies and thermal correction values were realized by Shermo program.5f All the mentioned wavefunction analysis tasks were performed using the Multiwfn program.5g Root mean square displacement (RMSD) calculations and visualization of the structures and isosurface were completed using the VMD program.5h Also, mercury5i was applied for the bond distances measurements of the crystal and optimized structures.Results and discussion
Geometric/electronic structure study
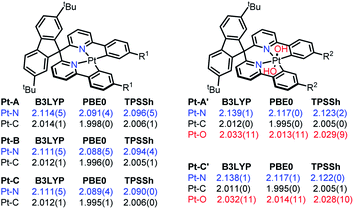
First, some well-resolved crystal structures8a–c of Pt complexes were optimized to screen the DFT methods with varied HF ratios, including TPSS (0%), TPSSh (10%), B3LYP (20%), and PBE0 (25%). The Pt–X (X = C, N, O, S) bond length deviations to those of crystal structures were chosen as standard, and PBE0 was found to be the optimal DFT method, which optimized the structures through the minimal RDSM and matched the bond lengths to the crystal structures to the greatest extent (more details in the ESI†).As shown in Scheme 1, the mean Pt–X (X = C, N, O) bond lengths of the structures optimized by B3LYP, PBE0, and TPSSh are listed. Compared to the results optimized by PBE0, both B3LYP and TPSSh overestimated the Pt–X (X = C, N, O) bond distances by 1%. The average values of the Pt–N/Pt–C bonds were 2.089/1.996 Å in PBE0-optimized Pt(II) complexes, which were 0.5/0.3 Å longer than those in the reported paper. These elongated bond lengths indicated the lower stabilities of the related Pt(II) species, which provided the possibilities for further reactions. The Pt–N bond distance was extended to 2.117 Å after being oxidized, but the Pt–C bond length was almost unchanged, thereby implying the oxidization mainly affected the Pt–N bonds by weakening the coordination. It should be noted that the upside Pt–O bond (Pt–O87) was not identical to the downside one (Pt–O86) in the Pt(IV) species. Pt–O87 was about 0.1 Å shorter than the Pt–O86. One reason for this result may be attributed to the NCI formed by the tert-butyl benzene (tBuPh) of the LK and hydroxyl groups (OH).
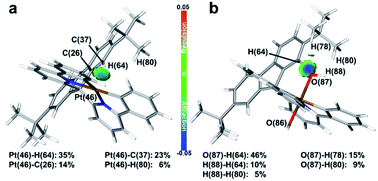
To confirm the inference, independent gradient modelling based on Hirshfeld partition (IGMH) analysis7d was performed and the isosurface was visualized using the BGR colouring method (more details in the ESI†). As shown in Fig. 2, the isosurface obviously pointed out the NCI between tBuPh and Pt/OH in Pt-A/Pt-A′. According to the colour filled on the isosurface, not only did van der Waals force (coloured in green) exist, but also H-bonds (coloured in blue) did too. Intensive repulsive interactions were not found because an orange/red isosurface did not appear. Namely, the attractive NCI was predominant in the space between tBuPh and Pt/OH. NCI was decomposed to atom pairs, and the contributions greater than 5% are listed on the bottom. We could clearly identify the great contribution of the aromatic hydrogen (H64) close to the central metal, which participated in the interaction with Pt/OH in Pt-A/Pt-A′ and supplied over a one-third contribution. As we found in our former work,9 the hindered structure may have affected the electronic structures and brought changes to the bond orders, as well as the atom charge populations.
NBO analysis was then performed to learn the details. The natural population analysis (NPA)7c charge of H64 in Pt-A was 0.2486, which was 0.0138 greater than the average values of other aromatic H atoms (ArH). Also, the natural electron configuration (NEC)7b of H64 was 1s0.75, which was 0.013 less. In brief, the NPA charges and NEC situations both indicated the charges transferring from H64, which should be a major contributor to NCI. As for Pt-A′, the NEC of the O87/O86 were similar, which were 2s1.802p5.163p0.01 and 2s1.802p5.133p0.01, respectively. However, the NPA charges of H64/average ArH were 0.2861/0.2374, and those of O87/O86 were −0.9670/−0.9451. Thus, the charge population deviations of the oxygen atoms could be assigned to the H-bond that transferred electrons from H64 to O87.
To summarize, the LK connected in the middle of the phenylpyridines were adjacent to Pt/OH in Pt-A/Pt-A′. The closeness of these atoms brought van der Waals attractions and H-bonds in to play, which further affected the electronic structures, enriching the charge population of the O87 and shortening the Pt–O87 bond.
Excited states analysis
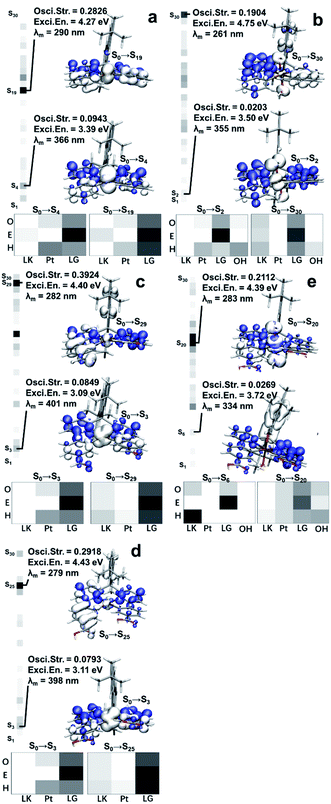
With the optimized structures in hand, we then carried out further studies on the excitation mechanisms. As we confirmed in our previous work, the ground states (GS) of the related Pt(II)/Pt(IV) complexes were singlets (S0). Hole–electron analysis was performed as a start to grasp the detailed information of what occurs during the excitation process.As shown on the left of each thumbnail, the oscillatory strengths (OS) of the Pt(II)/Pt(IV) excited singlet states (Sn) were visualized by heatmaps using grayscale, with values ranging from 0 (white) to 0.4 (black). The maximal OS of the Pt(II) species were greater than those of Pt(IV) (0.2826, 0.3924, 0.2918 vs. 0.1904, 0.2112).
The OS values were related to the transaction efficiencies, that is, it was easier to form ES for Pt(II) species. The maximal OS of Sn (n < 10) in Pt(II) were 4–5 times the Pt(IV) ones, indicating the low-level ES were much harder to form after oxidation. In other words, the oxidized Pt(IV) species tended to be excited to higher energy levels with inferior efficiencies, which led to lower abundances of ES and more losses when high-energy-level ES went back to Sn (n ≤ 5).
The hole and electron isosurfaces were then visualized, and the blue/white isosurfaces represent electrons/holes where the electrons flowed in/out and the density of electrons increased/decreased during the excitation process. Besides, the complex structures were divided into fragments to study how the structures played a role in the optical performance. Pt(II) species were divided into three parts, the LK, Pt, and bisphenylpyridines (LG), while the Pt(IV) species had one more part, the OH. As shown on the bottom of each thumbnail, the heatmaps expressed the contributions of the fragments to holes (H), electrons (E) and overlaps (O) using white to black gradient ranging from 0 to 100%. Combined with the results shown in Fig. 3, the following details were obtained:
(a) The low-level ES (S0 → Sn, n ≤ 6) in Pt(II) species formed by metal-to-ligand charge-transfer excitation (MLCT). In this procedure, LG comprised the vast majority of electrons. Electrons transfer from the central metal and part of the LG to the remaining part of LG, while LK hardly participates in the charge transfer; (b) high-level ES (S0 → Sn, n > 15) with the maximal OS in Pt(II) species were generated by a local excitation (LE) mechanism, which mainly occurred on the LP, and LK contributed a small part. Since the holes and electrons are both mainly distributed on LP, making the transition dipole moments effectively overlap, the OS had the maximum values in these situations; (c) the low-level ES in Pt(IV) were promoted by the charge-transfer (CT) mechanism, among which the holes and electrons were distinctly separated. However, the detailed procedure in Pt-C′ (S0 → S6) differed from that of Pt-A′ (S0 → S2). Specifically, LK contributed holes in a very high proportion at Pt-C′ while Pt or OH were nearly invalid. The situation was reversed in Pt-A′. The far separation of holes and electrons decreased the transition dipole moments, which resulted in the OS weakening of Pt-A′ and Pt-C′ in the low-level ES; (d) the high-level ES in Pt(IV) were yielded by an LE process, in which the involved parts in Pt-A′ were Pt, LG, and OH, while those in Pt-C′ were LK, LG, and OH. In this case, LG also played a role as the acceptor for electrons flowing in, and the remaining part mainly played the role of a donor for electrons flowing out.
To conclude, LG was the main part for accepting electrons in these Pt complexes during the excitation process, and therefore its structure should be a core factor affecting the OS. The electron-withdrawing groups (EWG) embedded on LG took advantages in enhancing the attraction to electrons and stabilizing the ES after electrons migrated in. That is the reason why Pt-B and Pt-C had a greater maximal OS than Pt-A. The LK mostly played the role of electron donors in the excitation process, while the non-coplanarity and far distances to LG made the LE mechanism have poor efficiency. Accordingly, we believe the modification of the LK with EWG may impair the LE process by cutting down electrons flowing out from the LK. Alternatively, the efficient LE occurring on the LG part may increase, through which the excitation efficiencies could be improved for these Pt species. As for OH, they were the holes in the excitation process, but the overlapping of the hole isosurface in OH and the electron isosurface in LG was inefficient. Hence, the higher electron density OH possessed, the lower the excitation efficiency would be. Combining the results from NBO analysis, H64 in LK donated electrons to O87 by forming H-bonds, which enriched the electron abundances of OH and deteriorated the excitation efficiency. Further, OH belonged to a kind of EWG, which attract the electrons in Pt and hinder its transferring, resulting in the MLCT mechanism became useless in Pt(IV). Putting these results together shows the whole reason for the OS weakening and absorption efficiencies declining in Pt(IV) complexes.
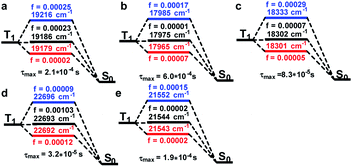
According to the experimental spectra, the emission process obeyed Kasha's rule,10 whereby the ES went back to the GS through the first excited triplet states (T1). Consequently, an intersystem crossing (ISC) process was involved for Sn transforming into triplet ES (Tn). SOC reflects the interactions between the electron spin and electron orbital motion, which the alleviated ISC ban and was a key point to reveal the on–off phosphorescence phenomenon. The details of T1 going back to the GS considering the SOC are shown in Fig. 4. We can see T1 could be split into three sublevels with closed energies after considering the SOC, and their OS values are noted in the corresponded colours. The energy levels of the Pt(II) species were about 3000 cm−1 lower than the Pt(IV) ones, and the corresponding OS varied from 0.00002 to 0.00103. The lifetime of the T1 sublevels were then calculated by Einstein's equation.11 The maximal lifetime values of the sublevels are listed on the bottom of each compound, and we can see which had minor differences (Pt-A: 2.1; Pt-B: 6.0; Pt-C: 0.83; Pt-A′: 0.32; Pt-C′: 1.9, unit 10−4 s). In other words, the related Pt complexes possessed similar T1 lifetimes, and therefore the process of T1 returning to S0 was not the reason for the phosphorescence quenching of Pt(IV) species.
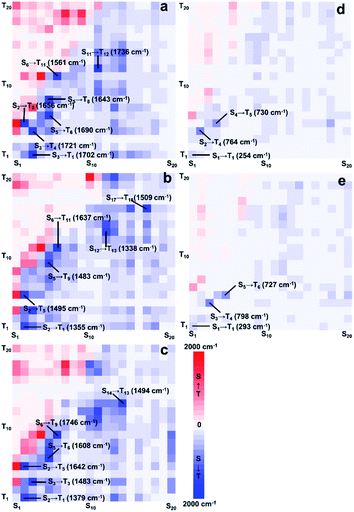
To further investigate the phosphorescence quenching mechanism, Sn (n ≤ 20) and Tn (n ≤ 20) were taken into consideration. Also, SOCME results whose values characterized the degree of ISC were selected for careful discussion. As shown in Fig. 5, the processed SOCMEs12 were visualized by heatmaps (more details in ESI).
The BWR colouring method was applied to visually exhibit the values of SOCME, in which the blue grid points represent the SOC of ISC, while the red ones represent those for the reverse ISC (RISC). The shade of the colours is proportional to the SOCME and some extremums are listed. It can be distinctly seen that ISC and RISC were both remarkably weakened in Pt(IV) complexes, because the colour filled in Fig. 5d and e turned pale. The extremums to form T1 were 1702, 1355, and 1379 cm−1 for Pt-A, Pt-B, and Pt-C, respectively, which were about 5–7 times greater than those in Pt(IV) species (254 and 293 cm−1). Combining the conclusion drawn out by the ES analysis that Pt(II) species possessed greater OS to form low-level ES, T1 could be generated through the Sm → Tn → T1 or Sm → Sn → T1 (m < 5, n < m) pathways in higher yields. The high-level ES of Pt(II) species were also easier to be generated, and the highly efficient ISC/RISC extended the lifetime of the ES for the Pt(II) species, which provided long-lived ES and increased the phosphorescent emission intensities. On the contrary, the ES of the Pt(IV) species preferred to be yielded in high levels, and the weak ISC strengthened the non-radiative transitions, which made the Sm → Tn → T1 or Sm → Sn → T1 (m > 7, n < m) pathways inefficient. In short, the greatly reduced abundances of T1 in Pt(IV) species was a main reason for the phosphorescence quenching.
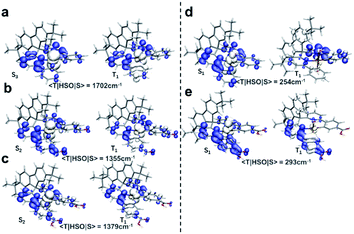
The excitation types of T1 and those of the related Sn were then visualized to dig out the more fundamental principles. As shown in Fig. 6, hole–electron isosurfaces of the ES with the maximal SOCME corresponded to Sn → T1 are visualized. The excitation types of all the related Sn were MLCT, including Pt(II) and Pt(IV) species, and those of T1 in the Pt(II) species were MLCT too. However, the excitation types of T1 in the Pt(IV) species were mainly contributed to by LE, in which the central metal contributed little. In short, the T1 and Sn had the same nature for Pt(II) complexes, while those in Pt(IV) ones were different. So, the ISC process of these complexes did not obey El-Sayed's rule that triplet and singlet conversions in cases where the states have the same nature are prohibited.13a,b It was speculated that the relativistic effects caused by Pt was more significant, and SOC interacted more efficiently when the electrons were constrained on the heavy metal, which overcame the disapproval of El-Sayed's rule.
Next, the T1 structures were optimized to investigate the spin situation and NBO analysis was utilized to elucidate the electronic structure details. Taking Pt-A and Pt-A′ as examples, their natural spin densities (NSD) are listed in Fig. 7 alongside the spin density isosurface. By referring to the NSD values, we found a single electron partially distributed on the central metal (0.24), the C atom (0.35) and N atom (0.24) connected to Pt for Pt-A. Differently, it did not distribute on Pt for triplet Pt-A′, and was mostly located on the relatively remote para-site of Pt (0.47, 0.45).
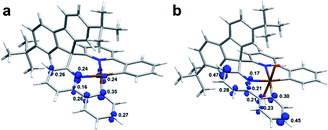 | ||
| Fig. 7 Spin density of triplet Pt-A and Pt-A′. (a) Pt-A; (b) Pt-A′; wavefunctions generated at PBE0-D3/def2-SVP (triplet) were applied for spin density analysis, isovalue 0.025. | ||
The contributions of each orbital to generate single electrons was further decomposed, and the 5d orbitals that participated were 5dxy, 5dxz, and 5dx2−y2 in Pt-A, which supplied 0.06, 0.09, and 0.06 single electrons, respectively. However, the corresponding orbitals contributed much less in Pt-A′, whose values were 0.01(5dxy), 0.01(5dxz), and 0.02(5dx2−y2). Also, the hybrid type of Pt in Pt(II)/Pt(IV) species was dsp2/d2sp3, in which 4/3 pairs of lone pair electrons (LP) were settled in d orbitals. Basically, spin–flip could be realized by LP excitation. The LP in Pt-A were less restrained without the strong bonding of OH, which made it easier to accomplish spin–flip through electron excitation, while the similar mechanism did not work for Pt-A′. Without the contribution of a central atom, spin–flip was much harder to achieve only by SOC, which responded to the low efficiency of Sn → T1, and resulted in the phosphorescence-off phenomenon for Pt(IV) complexes.
Conclusion
In summary, we confirmed the reasonability of the DFT method PBE0 in optimization tasks for the reported Pt complexes. Through NBO analysis and NCI discussion, we found the LK promoted the upside Pt–O bond strengths by forming H-bonds and providing van der Waals attractions, which revealed the reasons for the inequalities between Pt–O bonds in Pt(IV) complexes. Electron–hole analysis indicated that LG with an EWG embedded, such as carboxyl, aldehyde, nitro, possessed superior excitation efficiencies, while LK with the same had the opposite effect, leading to a poor yield of excitation states. Hence, a rational ligand design to improve the excitation efficiencies was to decorate the LK with an EDG, such as alkyl, alkoxy, alkylamino, and to modify the LG with an EWG. The mechanism of phosphorescence quenching in Pt(IV) species was carefully explored through hole–electron analysis and the newly-developed visualization method for SOCME. The oxidation-caused phosphorescence-off was most likely due to the deteriorated excitation efficiencies and weakened ISC to form T1 species rather than El-Sayed's rule or lifetimes differences. The strong impact of a central metal significantly improved the ease of spin–flip in Pt(II) complexes, which was impaired by the electron-withdrawing effect of the OH connected in the Pt(IV) species. In other words, replacing OH with another EWG in Pt(IV) species should also exhibit identical on–off phosphorescence performance, which could be applied in the wider field of detection research. This in-depth result should be broadly applicable to the cases of similar compounds. Furthermore, we disclosed how the substituents on the LK and LG affected the excitation efficiencies, which will bring insight to the structural design in further research.Conflicts of interest
There are no conflicts to declare.Acknowledgements
This work was supported by the funding of Education Commission of Guangdong Province (2020ZDZX2077), Special Fund Projects of Guangdong Academy of Sciences for the Construction of Domestic First-class Research Institutions (2021GDASYL-20210103035), and Science and Technology Planning Project of Guangzhou (202102021119).Notes and references
- Reviews or papers on the applications of Pt complexes, see: (a) H. Chen, Y. Li, S. Liu, Q. Xiong, R. Bai, D. Wei and Y. Lan, Coord. Chem. Rev., 2021, 437, 213863 CrossRef CAS; (b) C. Jia, G. B. Deacon, Y. Zhang and C. Gao, Coord. Chem. Rev., 2021, 429, 213640 CrossRef CAS; (c) M. Mbaba, T. M. Golding and G. S. Smith, Molecules, 2020, 25, 5276–5307 CrossRef CAS PubMed; (d) C. F. Chow, F. W. Gong and C. B. Gong, Analyst, 2014, 139, 4532–4537 RSC; (e) C.-S. Chu, T.-W. Sung and Y.-L. Lo, Sens. Actuators, B, 2013, 185, 287–292 CrossRef CAS; (f) J. B. Reyes, M. K. Kuimova and R. Vilar, Curr. Opin. Chem. Biol., 2021, 61, 179–190 CrossRef PubMed; (g) C. Cebrian and M. Mauro, Beilstein J. Org. Chem., 2018, 14, 1459–1481 CrossRef CAS PubMed.
- For selected papers on the newly synthesized Pt complexes, see: (a) H. Shi, C. Imberti, H. Huang, I. Hands-Portman and P. J. Sadler, Chem. Commun., 2020, 56, 2320–2323 RSC; (b) L. He, Z. Meng, Q. Guo, X. Wu, M. P. Teulade-Fichou, E. K. L. Yeow and F. Shao, Chem. Commun., 2020, 56, 14459–14462 RSC; (c) H. Yao, S. Chen, Z. Deng, M. K. Tse, Y. Matsuda and G. Zhu, Inorg. Chem., 2020, 59, 11823–11833 CrossRef CAS PubMed.
- For selected papers on the DFT study about Pt complexes, see: (a) S. P. Wang, Y. Li, Z. X. Zhang, Y. Zhang, Y. Wang, S. M. Kong, H. C. Li, W. Jian, F. Q. Bai and H. X. Zhang, Inorg. Chem., 2021, 60, 1480–1490 CrossRef CAS PubMed; (b) T. Eskelinen, S. Buss, S. K. Petrovskii, E. V. Grachova, M. Krause, L. Kletsch, A. Klein, C. A. Strassert, I. O. Koshevoy and P. Hirva, Inorg. Chem., 2021, 60, 8777–8789 CrossRef CAS PubMed.
- J. Tang, G. Zhu, P. Li, P. Zhang, F. Peng and F. Meng, Analyst, 2021, 146, 5691–5703 RSC.
- Software and program involved in this paper, see: (a) F. Neese, Wiley Interdiscip. Rev.: Comput. Mol. Sci., 2012, 2, 73–78 CAS; (b) F. Neese, Wiley Interdiscip. Rev.: Comput. Mol. Sci., 2018, 8, e1372 Search PubMed; (c) F. Neese, F. Wennmohs, U. Becker and C. Riplinger, J. Chem. Phys., 2020, 152, 224108 CrossRef CAS; (d) F. Neese, Wiley Interdiscip. Rev.: Comput. Mol. Sci., 2022, 1–15 Search PubMed; (e) E. D. Glendening, C. R. Landis and F. Weinhold, J. Comput. Chem., 2019, 40, 2234–2241 CrossRef CAS PubMed; (f) T. Lu and Q. Chen, Comput. Theor. Chem., 2021, 1200, 113249 CrossRef CAS; (g) T. Lu and F. Chen, J. Comput. Chem., 2012, 33, 580–592 CrossRef CAS PubMed; (h) H. William, D. Andrew and S. Klaus, J. Mol. Graphics, 1996, 14, 33–38 CrossRef; (i) C. F. Macrae, I. Sovago, S. J. Cottrell, P. T. A. Galek, P. McCabe, E. Pidcock, M. Platings, G. P. Shields, J. S. Stevens, M. Towler and P. A. Wood, J. Appl. Crystallogr., 2020, 53, 226–235 CrossRef CAS PubMed.
- Methods involved in DFT calculations, see: (a) A. D. Becke, J. Chem. Phys., 1993, 98, 5648–5652 CrossRef CAS; (b) C. Lee, W. Yang and R. G. Parr, Phys. Rev. B: Condens. Matter Mater. Phys., 1988, 37, 785–789 CrossRef CAS; (c) B. Miehlich, A. Savin, H. Stoll and H. Preuss, Chem. Phys. Lett., 1989, 157, 200–206 CrossRef CAS; (d) J. P. Perdew, K. Burke and M. Ernzerhof, Phys. Rev. Lett., 1996, 77, 3865–3868 CrossRef CAS PubMed; (e) J. P. Perdew, K. Burke and M. Ernzerhof, Phys. Rev. Lett., 1996, 78, 1396 CrossRef; (f) J. Tao, J. P. Perdew, V. N. Staroverov and G. E. Scuseria, Phys. Rev. Lett., 2003, 91, 146401 CrossRef PubMed; (g) V. N. Staroverov, G. E. Scuseria, J. Tao and J. P. Perdew, J. Chem. Phys., 2003, 119, 12129–12137 CrossRef CAS; (h) F. Weigend and R. Ahlrichs, Phys. Chem. Chem. Phys., 2005, 7, 3297–3305 RSC; (i) F. Weigend, Phys. Chem. Chem. Phys., 2006, 8, 1057–1065 RSC; (j) S. Grimme, J. Antony, S. Ehrlich and H. Krieg, J. Chem. Phys., 2010, 132, 154104 CrossRef PubMed; (k) S. Grimme, S. Ehrlich and L. Goerigk, J. Comput. Chem., 2011, 32, 1456–1465 CrossRef CAS PubMed; (l) A. K. Dutta and F. Neese, J. Chem. Phys., 2016, 144, 034102 CrossRef PubMed; (m) G. J. Christan, F. Neese and S. F. Ye, Inorg. Chem., 2016, 55, 3853–3864 CrossRef PubMed; (n) E. van Lenthe, J. G. Snijders and E. J. Baerends, J. Chem. Phys., 1996, 105, 6505 CrossRef CAS; (o) C. V. Caillie and R. D. Amos, Chem. Phys. Lett., 1999, 308, 249–255 CrossRef; (p) C. V. Caillie and R. D. Amos, Chem. Phys. Lett., 2000, 317, 159–164 CrossRef; (q) S. Hirata and M. Head-Gordon, Chem. Phys. Lett., 1999, 314, 291–299 CrossRef CAS; (r) J. Liu and W. Liang, J. Chem. Phys., 2011, 135, 014113 CrossRef PubMed; (s) M. E. Casida, C. Jamorski, K. C. Casida and D. R. Salahub, J. Chem. Phys., 1998, 108, 4439–4449 CrossRef CAS; (t) D. A. Pantazis, X. Y. Chen, C. R. Landis and F. Neese, J. Chem. Theory Comput., 2008, 4, 908 CrossRef CAS PubMed; (u) F. Neese, J. Chem. Phys., 2005, 122, 034107 CrossRef.
- Methods involved in wavefunction analysis, see: (a) E. R. Johnson, S. Keinan, P. Mori-Sánchez, J. Contreras-Garcí, A. J. Cohen and W. Yang, J. Am. Chem. Soc., 2010, 132, 6498–6506 CrossRef CAS PubMed; (b) E. R. Alan and W. Frank, J. Chem. Phys., 1983, 78, 4066–4073 CrossRef; (c) A. E. Reed, R. B. Weinstock and F. Weinhold, J. Chem. Phys., 1985, 83, 735–746 CrossRef CAS; (d) J. E. Carpenter and F. Weinhold, J. Mol. Struct.: THEOCHEM, 1988, 169, 41–62 CrossRef; (e) Z. Liu, T. Lu and Q. Chen, Carbon, 2020, 165, 461–467 CrossRef CAS; (f) T. Lu and Q. Chen, J. Comput. Chem., 2022, 43, 539–555 CrossRef CAS PubMed.
- Single crystals applied for DFT method screening were obtained from CCDC database, see: (a) L. Niu, G. Ren, T. Hou, X. Shen and D. Zhu, Inorg. Chem. Commun., 2021, 130, 108737 CrossRef CAS; (b) V. Cîrcu, M. Ilie, M. Iliş, F. Dumitraşcu, I. Neagoe and S. Păsculescu, Polyhedron, 2009, 28, 3739–3746 CrossRef; (c) M. Tan, Z. Wang, Q. Qin, X. Huang, B. Zou and H. Liang, Inorg. Chem. Commun., 2019, 108, 107510 CrossRef CAS.
- G. Zhu, A. You, H. Song and Z. Li, RSC Adv., 2022, 12, 10014–10019 RSC.
- N. Lewis and M. Kasha, J. Am. Chem. Soc., 1944, 66(12), 2100–2116 CrossRef.
- R. C. Hilborn, Am. J. Physiol., 1982, 50, 982–986 CrossRef CAS.
- E. Y. Li, T. Jiang, Y. Chi and P. Chou, Phys. Chem. Chem. Phys., 2014, 16, 26184–26192 RSC.
- (a) S. K. Lower and M. A. El-Sayed, Chem. Rev., 1966, 66, 199–241 CrossRef CAS; (b) M. A. El-Sayed, Acc. Chem. Res., 1968, 1, 8–16 CrossRef CAS.
Footnote |
| † Electronic supplementary information (ESI) available: Detailed results and coordinates of the optimized species. See https://doi.org/10.1039/d2ra03060h |
| This journal is © The Royal Society of Chemistry 2022 |

