DOI:
10.1039/D2RA02847F
(Paper)
RSC Adv., 2022,
12, 18794-18805
Photocatalytic dye-degradation activity of nano-crystalline Ti1−xMxO2−δ (M =Ag, Pd, Fe, Ni and x = 0, 0.01) for water pollution abatement
Received
5th May 2022
, Accepted 30th May 2022
First published on 28th June 2022
Abstract
Nanocrystalline metal-ion (M = Fe, Ni, Ag, and Pd) doped and undoped anatase-TiO2 powders were prepared using a solution combustion method. The photocatalytic degradation of different dyes such as methylene blue (MB), rhodamine B (RB), rhodamine B base (RBB), and thionine acetate (TA) was investigated under UV exposure. The degradation rate of the dyes were found to be better in the case of Ag+ and Pd2+ doped TiO2, whereas Fe3+ and Ni2+ doped TiO2 showed lower photocatalytic activity compared to undoped TiO2 nanoparticles. Combustion synthesized catalysts exhibited much better activity compared to the commercial Degussa P25 (75% anatase + 25% rutile) TiO2 photocatalyst. The intermediate states created in the band gap of the TiO2 photocatalyst due to doping of first row transition metal ions (such as Fe3+ and Ni2+) into the TiO2 lattice act as recombination centres and the electrons present in the d-orbital quench the photogenerated holes by indirect recombination, hence increasing e−–h+ recombination rates. As a result, a decrease in the photocatalytic activity of TiO2 doped with first row transition metal ions is observed. However, in the case of noble metal ions (such as Ag+ and Pd2+) in TiO2, photoreduction of Ag+ and Pd2+ ions occurs upon UV irradiation, hence the noble metal-ions act as electron scavengers. Consequently, the lifetime of the holes (h+) increases and hence higher photocatalytic oxidation activity of the dyes is observed. A novel strategy of electron scavenging is envisaged here to develop Ag+ and Pd2+ doped TiO2 to increase the photocatalytic oxidation of organic dyes for the development of better water pollution abatement catalysts. Redox-pair stabilization in the TiO2 lattice similar to photo-chromic glasses play a defining role in enhancing the photocatalytic activity of the catalyst and is a key finding for the development of superior photocatalysts. With the help of UV-vis and fluorescence spectroscopy, the mechanisms of the superior oxidation activity of Pd2+ and Ag+ doped TiO2 nanoparticles are explained.
1. Introduction
Semiconductor heterogeneous photocatalysis is a promising strategy with enormous potential to treat contaminants in water to remove persistent organic pollutants as well as microorganisms in water. The discharge of highly toxic and potentially carcinogenic dyes from textile industries are the root cause of water pollution and therefore poses a serious environmental concern; about 10–15% of the total dyes are wasted during dyeing and released as effluents into wastewater streams.1 Several studies have been carried out regarding complete degradation of organic dyes using semiconductors as photocatalysts before releasing them into water streams.2,3 Complete degradation and mineralization of organic pollutants in water have been extensively explored in the literature.4–9 In recent years, photocatalytic reactions over semiconductor oxides have been investigated in depth.10–12 Although other semiconductors, such as ZnO,13 ZnS,14 Fe2O3,15 WO3,16 Nb2O5,17 Ta2O5,18 CdS,19 In2O3,20 etc., have been studied extensively, TiO2 remains the leading and most studied photocatalytic material due to its photostability, low cost, redox efficiency, and non-toxicity towards the environment and humans.7,10,11 Several studies in the literature have reported that the anatase phase of TiO2 is more photo-active for degrading pollutants in contaminated water compared to the other stable polymorphic rutile and brookite phases.10,11,21,22
The band gap of TiO2 is such that photo-absorption occurs in the UV region of the electromagnetic spectrum and, therefore, successful attempts have been made to shift the band gap of TiO2 towards the visible or near UV region by doping of foreign elements, especially transition metal ions, into the TiO2 lattice or loading them onto the TiO2 surface.23–26 However, several controversies regarding metal substitution in catalysts prevail in the current literature. Some of the literature has reported that the photo-activity of titania is altered by doping with transition metals like Pt, Pd, Au, Ag, and Cu,27–31 which act as charge separators for the photo-induced electron–hole pair. It is hypothesized that after excitation, the electron migrates to the metal centre, where it becomes trapped and electron–hole recombination is suppressed, which results in enhanced photo-activity. Nagaveni et al.32,33 conducted a systematic study of several metal ions such as Cu2+, Fe3+, Zr4+, Ce4+, and V5+ and reported that substitution of these metal ions in TiO2 decrease the photocatalytic activity. The formation of reactive oxygen species (viz. OH˙, O2−˙, and H2O2) during catalytic processes on metal oxide semiconductors are of paramount importance for the practical application of photocatalysis. However, trapping of either e− or h+ by the new energy band in the metal doped TiO2 matrix decreases the number of these reactive oxygen species, resulting in a decreased photocatalytic activity.32
Electron scavenging through photo-reduction of metal-ions similar to the phenomena occurring in photo-chromic glasses can act as an alternative way to enhance the photocatalytic activity of doped TiO2. In photochromic glasses, reversible photo-reduction of Ag+ to Ag0 occurs to attain photochromism where the photoelectron is being trapped via Ag+ ion reduction giving a dark colour to the glasses and once photon irradiation is stopped, Ag transforms back to the Ag+ state. Thus, we have introduced Ag+ and Pd2+ ions into the TiO2 lattice to attain reversible photo-reduction or scavenging of photoelectrons to enhance the photocatalytic oxidation activity of Ag+ and Pd2+ doped TiO2 with enhancing of the lifespan of the holes (h+). There are a variety of approaches that are used to synthesize anatase-TiO2 NPs, such as the sol–gel process,34,35 hydrothermal method,36 microemulsion technique,37,38 inert gas condensation,39 chemical vapour deposition,40 etc., but solution combustion provides a rapid, self-propagating, single-step synthesis approach yielding nanoscale materials. Most of the metal doped TiO2 reported in the literature is prepared by the two most common methods: incipient wet impregnation41 and co-precipitation techniques.23 However, in the impregnation method, doping is likely to occur only on the surfaces, while in the co-precipitation method, the long-time heat treatment of these mixed metal hydroxides leads to agglomeration of metal particles at the surface of TiO2. Therefore, a new method for the preparation of metal ion doped titania is essential to study the effect of the metal ion in the TiO2 lattice. The solution combustion method offers a versatile and simple approach for in situ doping of metal ions in oxide materials. In the solution combustion method, highly crystalline fine particles are obtained and have the advantage of controlling the stoichiometric amount of doping of desired metal ions in TiO2.32,33,42,43
In this work, we present the one step synthesis of nanocrystalline Ti1−xMxO2−δ (M = Fe, Ni, Ag and Pd; x = 0, 0.01) by a solution combustion method and the photocatalytic degradation of different dyes such as methylene blue (MB), rhodamine B (RB), rhodamine B base (RBB), and thionin acetate (TA) were investigated using the developed photocatalyst, Ti1−xMxO2−δ under UV light exposure.
2. Experimental section
2.1 Synthesis
TiO2 nanoparticles (NPs) were obtained by a solution combustion method using the precursor titanyl nitrate [TiO(NO3)2] and glycine (NH2CH2COOH, 99%) as a fuel. 5 ml of titanium-isopropoxide ([Ti(OC3H7)4], 97%) in 15 ml of isopropanol (99%) was subjected to hydrolysis to obtain the white precipitate of titanyl hydroxide [TiO(OH)2], which was further reacted with 1 ml of 69 wt% nitric acid in ice cold conditions to obtain in situ titanyl nitrate [TiO(NO3)2] solution. 1.4 g of glycine was added to titanyl nitrate solution and the reaction mixture was kept in a pre-heated furnace at 400 °C. All the chemicals were obtained in their highest purity form from Sigma-Aldrich. For the synthesis of 1 atom% Pd doped TiO2, for instance, titanyl nitrate, PdCl2 and glycine were taken in a molar ratio of 0.99![[thin space (1/6-em)]](https://www.rsc.org/images/entities/char_2009.gif) :
:![[thin space (1/6-em)]](https://www.rsc.org/images/entities/char_2009.gif) 0.01
0.01![[thin space (1/6-em)]](https://www.rsc.org/images/entities/char_2009.gif) :
:![[thin space (1/6-em)]](https://www.rsc.org/images/entities/char_2009.gif) 1.14. The combustion reaction can be represented as:
1.14. The combustion reaction can be represented as:| | |
9(1 − x)TiO(NO3)2 + 9xPdCl2 + 10(1 − x)C2H5NO2 → 9TiO1−xPdxO2−δ + 14(1 − x)N2 + 20(1 − x)CO2 + 18xHCl + (25–34x)H2O…
| (1) |
The product was light brown in colour. Similarly, AgNO3, Fe(NO3)3 and Ni(NO3)2 were used as the precursor compounds for the synthesis of the 1 atom% Ag, Fe, and Ni doped titania, and their colour was light yellow, light brown, and yellow, respectively.
2.2 Characterization of Ti1−xMxO2−δ (M = Ag, Pd, Fe, and Ni and x = 0, 0.01)
To confirm the phase formation of the synthesized photocatalysts, powder X-ray diffraction (pXRD) spectra were obtained from a Philips X'pert Pro Diffractometer with Cu Kα radiation in the 2θ range from 20 to 70° with step size 0.02° at a scan rate of 1° min−1 for the purpose of Rietveld refinement. The SEM images of the powder sample were carried out using a high resolution-scanning electron microscope (FEI Nova Nano SEM450) and TEM micrographs of sample were obtained with a high resolution-transmission electron microscope (FEI TECNAI G2 20 TWIN instrument operated at 200 kV). The X-ray photoelectron spectroscopy (XPS) measurements were performed on a VG Scientific ESCA Lab Mark II spectrometer (UK) with an aluminium anode source producing Al Kα radiation (1486.6 eV). UV-vis DRS spectra of the doped and undoped TiO2 powders were obtained using a PerkinElmer Lambda 35 spectrophotometer in the wavelength range of 200 to 800 nm. Each sample was dry-pressed into a 10 mm diameter round disk containing 250 mg of the powder samples; pure BaSO4 was used as a standard for referencing. The photoluminescence measurements were performed on a luminescence spectrophotometer (PerkinElmer LS 55) at room temperature.
2.3 Photocatalytic studies
The photocatalytic activity of the synthesized nano-sized catalysts were measured by degrading MB, RB, RBB, and TA under UV-vis light illumination. The experiments were carried out using an annular-type cylindrical batch photo-reactor (of 250 ml volume) consisting of a jacketed quartz tube of 1.4-inch inner diameter, 1.6 inch outer diameter, and 8.3 inch length. The outer shell of a high-pressure mercury vapour lamp of 125 W (Philips Powertone, Mumbai, India) was removed carefully and placed inside the quartz reactor. The ballast and capacitor were connected in series to avoid fluctuations in the input power supply of the lamp, and a constant water supply was maintained to avoid overheating during the reaction. The whole unit was placed inside a glass container filled with polluted/dyed-water solution. The distance between the source and bottom of the vessel was maintained at 0.8 inch to stir the solution. The lamp was irradiated predominantly at 365 nm (3.4 eV). The dye concentration employed was 100 ppm with a catalyst loading of 1 kg m−3 and 1 ml of dye solution was collected at a regular interval of 5 minutes for further analysis by the spectrophotometer.
2.4 Sample analysis
The degraded samples were filtered through Millipore membrane filters and centrifuged to remove the catalyst particles prior to analysis. The centrifuged sample is used to record the UV-vis spectra in the range 200–800 nm at a scan rate of 120 nm min−1. The absorption maxima values for MB, RB, RBB, and TA are 664.8 nm, 553.6 nm, 553.60 nm, and 599.14 nm, respectively. The C/C0 values are plotted against time (min) to obtain the degradation plot of each of the respective dyes.
3. Structural analysis of the catalyst
3.1 XRD studies
The powder diffraction patterns for Ti1−xMxO2−δ (M = Fe, Ni, Ag, and Pd; x = 0, 0.01) shown in Fig. 1 are indexed to the anatase phase only; diffraction peaks corresponding to the rutile and brookite polymorphic phases could not be identified. Further, we have refined X-ray data to obtain the structural parameters. The Rietveld refinement of the X-ray spectra of TiO2, Ag+ doped TiO2 and Pd2+ doped TiO2 has been done taking pseudo-Voigt as the peak profile function, as depicted in Fig. 2(a)–(c), respectively. The experimental, calculated and their difference patterns were denoted as a solid, dotted and continuous bottom line, respectively. The position of the Bragg reflections represented by the tick marks corresponds to the tetragonal structure of anatase TiO2. From the Rietveld refinement, the values of the lattice parameters (a, b, and c), unit cell volume (V), and reliability factors (RBragg, Rf and χ2) for combustion synthesized doped and pure TiO2 are listed in Table 1. Incorporation of Ag/Pd ions in the TiO2 lattice have very little impact on the lattice parameter and a slight distortion in the lattice parameter is observed upon Ag/Pd ions substitution, as shown in Table 1. The crystallite size was determined using the Scherrer formula and from the FWHM of the highest intensity peak (101), it was found to be in the range of 8–18 nm for metal doped titania.
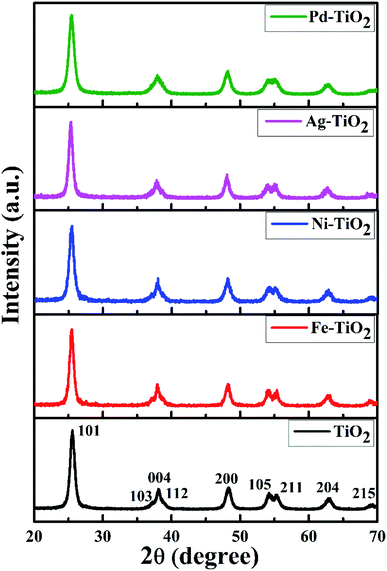 |
| | Fig. 1 XRD patterns of TiO2 and Ti1−xMxO2−δ (M = Fe, Ni, Ag, and Pd; x = 0, 0.01). | |
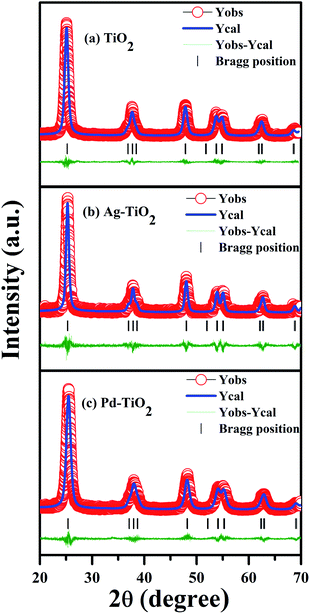 |
| | Fig. 2 Rietveld refined XRD patterns of (a) TiO2, (b) Ag–TiO2, and (c) Pd–TiO2. | |
Table 1 Structural parameters of combustion synthesized pure TiO2, Ag–TiO2, and Pd–TiO2
| Compound |
TiO2 |
Ag0.01Ti0.99O2 |
Pd0.01Ti0.99O2 |
| a (Å) |
3.8012(2) |
3.7882(10) |
3.77627(12) |
| b (Å) |
3.8012(2) |
3.7882(10) |
3.77627(12) |
| c (Å) |
9.5386(5) |
9.514(2) |
3.8012(2) |
| V (Å)3 |
137.8244 |
136.53 |
135.3024 |
![[thin space (1/6-em)]](https://www.rsc.org/images/entities/char_2009.gif) |
| Ti/Ag/Pd (4c) |
| X |
0 |
0 |
0 |
| Y |
0.25 |
0.25 |
0.25 |
| Z |
0.375 |
0.375 |
0.375 |
![[thin space (1/6-em)]](https://www.rsc.org/images/entities/char_2009.gif) |
| O (4b) |
| X |
0.00 |
0.00 |
0.00 |
| Y |
0.25 |
0.25 |
0.25 |
| Z |
0.1657 |
0.1668 |
0.1663 |
![[thin space (1/6-em)]](https://www.rsc.org/images/entities/char_2009.gif) |
| Reliability factor of goodness of fit |
| χ2 |
1.17 |
1.38 |
1.25 |
| RF |
1.33 |
4.22 |
1.63 |
| RBragg |
1.53 |
6.70 |
2.27 |
| RP |
8.99 |
20.7 |
10.3 |
| Rwp |
12.9 |
27.8 |
13.8 |
3.2 SEM and TEM studies
The surface morphology and structural characteristics were investigated by SEM micrographs. The SEM image of Ag+ doped TiO2 NPs, as shown in Fig. 3(a), shows the presence of a porous, sponge-like structure with high roughness and complexity. The bright-field TEM image, Fig. 3(b), of Ag+ doped titania shows agglomerated nanoparticles of sizes ranging from 10 to 20 nm, in close agreement with the sizes obtained from the Scherrer formula. The high resolution-TEM image, Fig. 3(c), displays lattice fringes with an interplanar d-spacing of 0.35 nm corresponding to the (101) plane of anatase-TiO2, which is in accordance with the pXRD results. The presence of distinct rings in the selected area electron diffraction (SAED) pattern, as shown in Fig. 3(d), indicate that the combustion synthesized doped TiO2 powders are crystalline in nature and could be indexed to the anatase phase only.
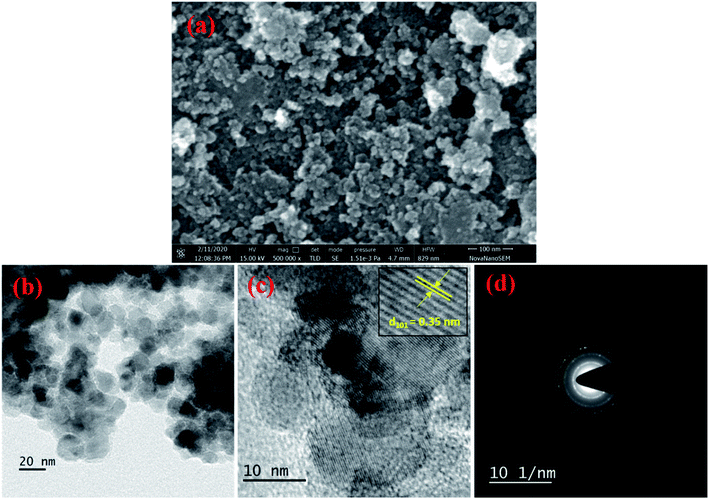 |
| | Fig. 3 (a) SEM micrographs, (b) bright field TEM image, (c) HR-TEM with interplanar d-spacing, and (d) SAED pattern of Ag–TiO2. | |
3.3 XPS
The deconvoluted X-ray photoelectron spectra (XPS) of the combustion synthesized Pd2+ doped TiO2 are shown in Fig. 4. The binding energies reported here are with reference to the adventitious C 1s peak (284.8 eV). Fig. 4(a) represents the Ti 2p core level spectra which indicates two peaks centered at 458.8 and 465.0 eV corresponding to Ti 2p3/2 and Ti 2p1/2 levels (Ti4+), respectively.44 Fig. 4(b) represents the Pd 3d core level spectra of Pd2+ doped TiO2 which consists of two peaks centered at 338.0 and 343.7 eV corresponding to Pd 3d5/2 and Pd 3d3/2 which confirms that Pd is present in the +2 oxidation state.44,45 When the powder sample (Pd2+ doped TiO2) was exposed to UV light, the peaks corresponding to Pd 3d5/2 and Pd 3d3/2 asymmetrically broaden, as shown in Fig. 4(c), which indicates that Pd is present in its two chemical states i.e., Pd0 and Pd2+. The additional peaks that start growing at 336.0 and 341.7 eV indicate the formation of metallic Pd0. These two peaks are deconvoluted to obtain the fractional analysis of Pd0 and Pd2+ in irradiated Pd2+ doped TiO2 and the ratio observed between Pd2+ to Pd0 was approximately 0.7 to 0.3. Further, darkening of the powder sample upon irradiation, as shown in the inset of Fig. 4(b) and (c), also confirms the formation of the Pd0 state at the expense of the Pd2+ state indicating a similar phenomenon of photochromism observed in Pd2+ doped TiO2 sample.
 |
| | Fig. 4 (a) Ti (2p) core level spectra, and (b) and (c) Pd (3d) core level spectra of Pd2+ doped TiO2 before and after UV irradiation, respectively. | |
3.4 The Kubelka–Munk plot of metal doped TiO2
In order to study the optical bandgap of the sample, diffuse reflectance measurements were carried out through UV-vis spectroscopy. The Kubelka–Munk (K–M) function was used to convert the reflectance spectra, thus obtained, into an equivalent absorption spectrum. The optical band gaps of the prepared materials were calculated from the linear part of the energy dependence of the absorption spectra using the following equation:
where hν is the energy of the photon and F(R) denotes the Kubelka–Munk function and the graph plotted between (F(R)hν)1/2 vs. hν gives the optical energy-band gap of the powder sample.
The band-gap of the synthesized pale yellow TiO2 NPs was found to be 2.94 eV (426 nm), as shown in Fig. 5(a), which is quite lower than that of Degussa-P25 TiO2 (3.10 eV).46 This decrease is attributed to the presence of interstitial carbide ions in the TiO2 lattice.33,43 While in the case of Fe3+, Ni2+, Ag+, and Pd2+ doped TiO2, the energy band-gap values were found to be 2.83 (440 nm), 2.69 eV (463 nm), 2.78 (447 nm), and 2.85 eV (435 nm), respectively, as shown in Fig. 5(b)–(e). It was observed that doping of the metal ion in the TiO2 lattice causes a significant red shift of absorption threshold in the visible region; even 1 atom% doping concentration brought about noteworthy changes in the colour of the otherwise pale yellow TiO2 NPs. The origin of the visible spectra in the case of the metal doped sample is due to the formation of additional dopant energy level, which results in the electronic transitions from the valence band to the dopant level or from the dopant level to the conduction band of TiO2. Fe3+ and Ni2+ doped TiO2 shows similar absorption behaviour as that of TiO2 and the observed red shift is due to the transition from the metal (3d) level to the conduction band edge of TiO2 NPs. In the case of Ag+ and Pd2+ doped TiO2, a broad hump around 2.25 eV (550 nm) and 2.48 eV (500 nm) was also observed due to surface plasmon absorption of Ag+ and Pd2+ ions, respectively. We believe that the plasmonic absorption occurs due the reduction of Ag+ and Pd2+ ions into their metallic state (such as Ag0 and Pd0) during the measurement of the UV spectrum. Further, we have applied the baseline approach to see the effect of the surface plasmon absorption on the optical band gap of TiO2 and the result is given in Table 2, which indicate that Eg values obtained from the baseline method are ∼0.2 eV higher than the values obtained from the K–M plot, as shown as the inset of Fig. 5(d) and (e).47 During irradiation, the colour of the catalysts turn black, indicating photo-reduction of Ag+ to Ag0 and Pd2+ to Pd0 and hence these ions act as electron scavengers that increase the lifespan of the photogenerated holes (h+), resulting in higher photo-oxidation activity. Thus, different d-electron configurations and the distributions of the dopant ions in the TiO2 lattice can modulate the optical absorption and alter the energy band structures of the synthesized materials through different dopant–lattice interactions.33
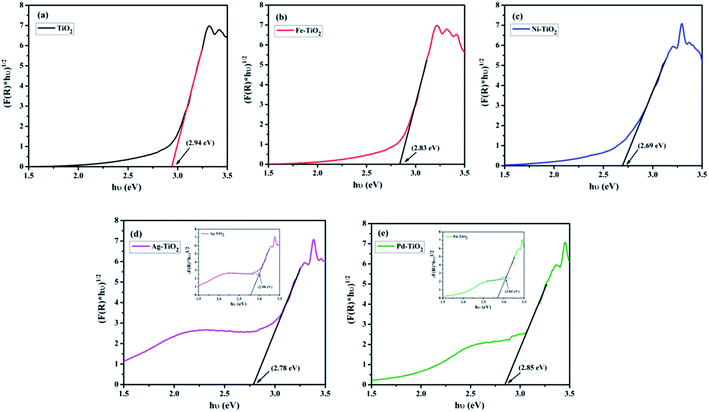 |
| | Fig. 5 (a)–(e) Kubelka–Munk plot of Ti1−xMxO2−δ (M = Fe, Ni, Ag, and Pd; x = 0, 0.01). Insets of (d) and (e) represent the baseline approach for band gap estimation of Ag+ and Pd2+ doped TiO2. | |
Table 2 Experimental Eg values of Ag–TiO2 and Pd–TiO2 obtained by application of the K–M plot and baseline approach
| Samples |
Energy band gap (eV) |
| K–M method |
Baseline method |
| Ag+ doped TiO2 |
2.78 |
2.98 |
| Pd2+ doped TiO2 |
2.85 |
3.02 |
3.5 Photoluminescence of metal doped TiO2
Fig. 6 represents the photoluminescence (PL) spectra for all the combustion synthesized pure and metal ion doped TiO2 NPs. The PL spectra were recorded at an excitation wavelength of 290 nm which shows a broad band with multiple superimposed peaks nearly at ∼380, 415, 480, and 523 nm.48–53 The first emission peak around ∼380 nm was observed for all the combustion synthesized TiO2 photocatalysts which is attributed to direct recombination of the electron–hole which is larger than the forbidden gap (as TiO2 is an indirect gap semiconductor).48 The emission peak at ∼415 nm is attributed to the indirect band gap partially allowed electronic transition,50–52 while the peaks at ∼480 and 523 nm arise due to shallow trapped surface states such as Ti4+–OH or oxygen vacancies.50,53 It was noticed that upon metal ion doping the emission intensity decreases which indicates the lower recombination rate of the charge carriers. In the case of Fe3+ and Ni2+ doped TiO2, the decrease in the PL intensity can be attributed to the electron transfer from the conduction band of Ti4+ to the new levels introduced by partially filled 3d metal ions. The free hole can recombine with a trapped electron or a free electron can recombine with a trapped hole. This electron–hole recombination may be non-radiative and transfer its energy to nearby ions and hence quench the fluorescence process. As a result, Fe3+ and Ni2+ doped TiO2 exhibited lower photocatalytic activity than pure TiO2 NPs. On the contrary, the Ag+ and Pd2+ doped TiO2 samples show the lowest intensity compared to other transition metal (Fe3+ and Ni2+) doped TiO2, as shown in Fig. 6. These doped noble metal ions (Ag+ and Pd2+) trap the electron from the conduction band and prevent it from falling back down to the valence band. Thus, this decreased charge carrier recombination favours the enhanced photocatalytic activity of the catalysts.
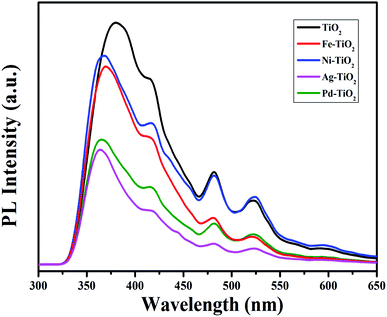 |
| | Fig. 6 Photoluminescence spectra of Ti1−xMxO2−δ (M = Fe, Ni, Ag, and Pd; x = 0, 0.01). | |
4. Photocatalytic activity
Initially, the adsorption experiment was performed by taking 100 ppm aqueous solution of MB dye over 1 kg m−3 of combustion synthesized metal-ion (M = Ag and Pd) doped and undoped TiO2 catalysts in the dark for 16 h to attain the adsorption equilibrium. Fig. 7(a) clearly indicates that the adsorption saturates within 6 h and the equilibrium concentration of the MB dye in the solution of Ag+, Pd2+ doped, and undoped TiO2 was estimated using the Beer–Lambert law and found to be 0.97, 0.95, and 0.94, respectively. Hence, this concentration was assigned as C0 in the present study. An optimised catalyst loading of 1 kg m−3 and 100 ppm of initial dye concentration were maintained throughout the experiment. Depending upon the various functional groups present, four different dyes such as methylene blue (MB), rhodamine B (RB), rhodamine B base (RBB), and thionin acetate (TA) were chosen for the photocatalytic study of various catalysts in the present work. The degradation profiles of methylene blue (MB) dye using combustion synthesized pure and metal-ion (M = Fe, Ni, Ag, and Pd) doped TiO2 with Degussa P25 are shown as a function of irradiation time in Fig. 7(b). An enhanced photocatalytic activity was observed in the case of Ag+ and Pd2+ doped TiO2, whereas Fe3+ and Ni2+ doped TiO2 shows a lower photocatalytic activity compared to undoped TiO2. However, all the combustion synthesized photocatalysts are still much better than Degussa P25. Since Ag+ and Pd2+ doped TiO2 shows a higher activity compared to other metal doped TiO2, further experiments have been carried out taking these two catalysts and their results were compared with pure-TiO2 and Degussa P25. Fig. 7(c)–(e) show the degradation profiles of rhodamine B (RB), rhodamine B base (RBB), and thionin acetate (TA), respectively, and from the plots, it can be observed that Ag+ and Pd2+ doped TiO2 degrades the dye faster compared to TiO2. The initial rates and % degradation profiles of different dyes as a function of time are listed in Table 3.
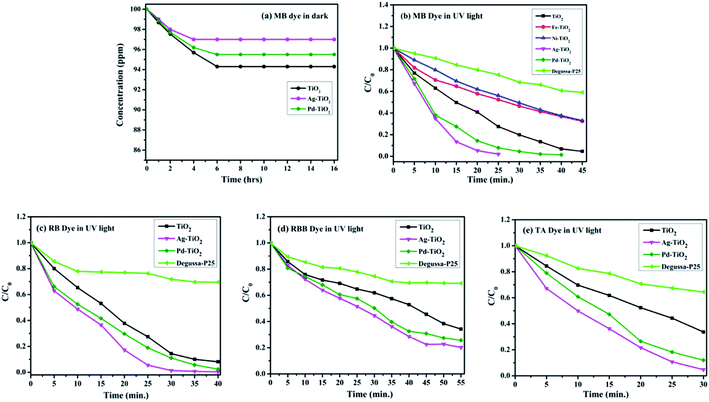 |
| | Fig. 7 (a) Degradation of MB dye using Ag+ and Pd2+ doped TiO2 and undoped TiO2 in dark. (b) Degradation profile of MB dyes with Ti1−xMxO2−δ (M = Fe, Ni, Ag, and Pd; x = 0, 0.01) and Degussa P25. (c)–(e) Degradation profile of RB, RBB, and TA dyes with Ti1−xMxO2−δ (M = Ag, and Pd; x = 0, 0.01) and Degussa P25, respectively. | |
Table 3 Initial rates and % degradation of different dyes with respect to time
| Dyes |
Catalysts |
Initial rate of degradation (μmol L−1 min−1) |
% degradation of dye |
Time (min) |
| Methylene blue (MB) |
Ag+ doped TiO2 |
30.6 |
99.9% |
25 |
| Pd2+ doped TiO2 |
26.4 |
99.5% |
40 |
| Pure TiO2 |
21.6 |
96% |
45 |
| Fe3+ doped TiO2 |
16.81 |
70% |
45 |
| Ni2+ doped TiO2 |
10.8 |
68% |
45 |
| Degussa P25 |
4.5 |
42% |
45 |
| Rhodamine B (RB) |
Ag+ doped TiO2 |
25.5 |
99% |
40 |
| Pd2+ doped TiO2 |
23.3 |
97% |
40 |
| Pure TiO2 |
13.8 |
92% |
40 |
| Degussa P25 |
9.7 |
30% |
40 |
| Rhodamine B base (RBB) |
Ag+ doped TiO2 |
14.2 |
80% |
55 |
| Pd2+ doped TiO2 |
12.77 |
75% |
55 |
| Pure TiO2 |
10.9 |
66% |
55 |
| Degussa P25 |
7.9 |
30% |
55 |
| Thionin acetate (TA) |
Ag+ doped TiO2 |
37.8 |
96% |
30 |
| Pd2+ doped TiO2 |
23.9 |
88% |
30 |
| Pure TiO2 |
17.7 |
67% |
30 |
| Degussa P25 |
8.7 |
36% |
30 |
5. Kinetic analysis
The effect of the initial concentration of the MB dye on the degradation rate was determined in the concentration range of 50–200 ppm with the combustion synthesized Ag+ doped TiO2 catalyst, and the experimental data are shown in Fig. 8(a). It can be seen from the figure that the initial concentration has a significant effect on the degradation rate and the rate of dye degradation is faster when the initial concentration is less. The kinetics of the MB dye degradation with the Ag+ doped TiO2 catalyst under UV irradiation was observed to follow pseudo first order reaction kinetics based on the Langmuir–Hinshelwood (L–H) model.54 The inset of Fig. 8(a) shows that the initial rate increases with an increase in initial concentration and saturates at a higher concentration.
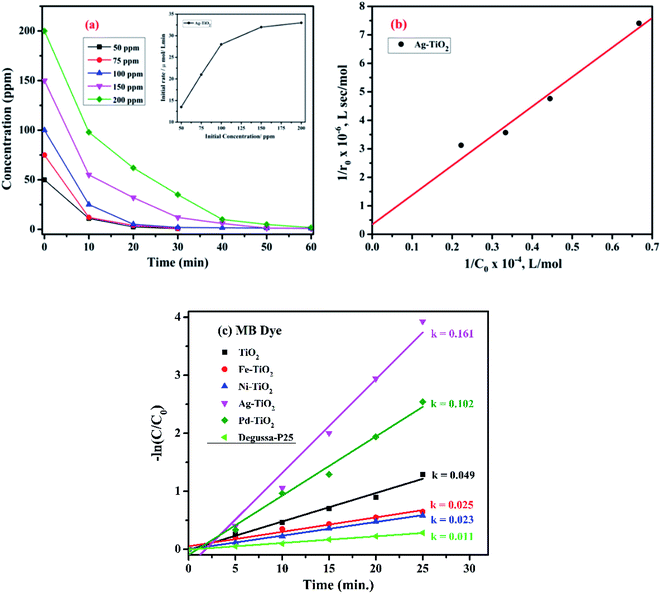 |
| | Fig. 8 (a) The effect of initial dye concentration on the degradation rate of MB with Ag–TiO2 and (b) the Langmuir–Hinshelwood plot for MB dye with Ag–TiO2. (c) A comparison of the degradation kinetics of all the combustion synthesized photocatalysts using MB dye. | |
The generalized form of the Langmuir–Hinshelwood kinetic model for the photocatalytic degradation rate is governed by the following equation:
| |
 | (2) |
where
kr is the reaction rate constant and
Ke is the equilibrium of adsorption constant (L–H parameter). This can be linearized for initial concentrations as:
| |
 | (3) |
where
C0 is the initial dye concentration and
r0 is the initial degradation rate. The intercept of the plot of 1/
r0 and 1/
C0 determines the kinetic coefficient that varies directly with the rate of degradation and the L–H parameter,
Ke represents the equivalent of the adsorption coefficient. The higher value of
Ke implies the blocking of the active sites of the catalyst due to strong adsorption. The higher value of
kr indicates the higher degradation rates of the dye. The rate constant and L–H parameter were calculated from
Fig. 8(b) using (
eqn (3)). The rate constant (
kr) is 3.211 mol L
−1 s
−1 and the adsorption equivalent L–H parameter (
Ke) is 0.624 L mol
−1 for Ag
+-doped TiO
2.
Further, the degradation profile of the MB dye shown in Fig. 7(b) has been chosen to compare the degradation kinetics of different metal-ion (M = Fe, Ni, Ag, and Pd) doped and undoped TiO2 along with Degussa P25. A linear plot between −ln(C/C0) vs. time (t) was fitted and the slope obtained is the rate constant (k) of different photocatalysts which follow pseudo-first order reaction kinetics, as shown in Fig. 8(c). The observed rate constants for Ag+, Pd2+, Fe3+, Ni2+ doped TiO2, and undoped TiO2 with Degussa P25 are 0.161, 0.102, 0.025, 0.023, 0.049, and 0.011 min−1, respectively. It was observed that the rate constant for Ag+ and Pd2+ doped TiO2 is 3.28 and 2.08 times higher, whereas in the case of Fe3+ and Ni2+ doped TiO2, it is 1.96 and 2.13 times lower than that of undoped TiO2, respectively.
6. Discussion
The photocatalytic activity can be correlated to the observed intensities in the PL spectra; a higher lifetime of the excited electron will give rise to a higher photo-activity of the catalyst and if the excited electron–hole recombination rates are high then they will suppress the photocatalytic performance. For the combustion synthesized samples, doping of the metal ions create additional mid gap states within the band gap of TiO2 that alter the recombination rate of charge carriers.47 The energy levels of the metal ions in the TiO2 lattice have the same band position as in their respective pristine oxides.55 Fig. 9 shows the energy band levels of the doped metal ions in the TiO2 lattice and they are similar to those reported by Mizushima et al.56,57 In the case of Fe3+ and Ni2+ doped TiO2, the metal (3d) energy levels are located just above the O2− (2p) level32,56–58 and correspond to the band gap of 2.83 and 2.69 eV, respectively, whereas in Ag+ and Pd2+ doped TiO2, the dopant metal (4d) level lies at 1–2 eV below the Fermi level (EF) and their respective band gaps are 2.78 and 2.85 eV, as shown in Fig. 9. These mid-gap states which originated from metal ion doping act as centres for electron–hole trappings. When these mid-gap states are located below the CB edge, they trap the excited electrons but if these states lie above the VB edge, the photo-generated holes are trapped. Thus, the dopant ions provide more sites for trapping electrons and holes in addition to the surface defect sites. Several studies have revealed that trapping either a hole or electron is not always effective because the immobilized charge species rapidly recombines with its mobile counterpart.47,59,60 First row transition metal ions such as Fe3+ and Ni2+ doped TiO2 show a lower photocatalytic activity than pure TiO2 and do not show any change in the colour under UV light exposure, i.e., these ions are not reduced to their atomic state. The intermediate state that has been created due to metal ion doping acts as a recombination centre instead of suppressing the e−–h+ recombination and the electrons present in d-orbital quench the photogenerated holes by indirect recombination, hence increasing e−–h+ recombination rates.32 Similarly, Ag+ and Pd2+ doped titania is expected to show lower photocatalytic activity in correlation with its lower photo-luminescence intensity, which is in contrast with the actual experimental results, that is, Ag+ and Pd2+ dopants show higher photocatalytic activity. The higher photocatalytic activity of Ag+ and Pd2+ doped TiO2 could be related to redox pair formation or photo-reduction of Ag+/Pd2+ ions through the photoelectrons generated during UV-irradiation (a phenomenon similar to photochromism in glasses). The photochromic effect in Ag+ and Pd2+ doped TiO2 compared with Degussa-P25 has been clearly demonstrated here through the XPS results as well as the colour changing phenomenon observed in the UV irradiated samples, as shown in Fig. 10. The sample change to the dark grey colour upon irradiation is similar to the dark colour appearance in photochromic glasses under UV-visible light, which suggests the trapping of electrons in the empty conduction band of noble metal ions. The e−–h+ pair is generated in TiO2 via transfer of electrons from the filled O (2p) band to the empty Ti4+ bands and the excited electron is trapped in the empty conduction band of Ag+ and Pd2+ ion which can be represented as:
 |
| | Fig. 9 A schematic representation of the different energy levels of Ti1−xMxO2−δ (M = Fe, Ni, Ag, and Pd; x = 0, 0.01). | |
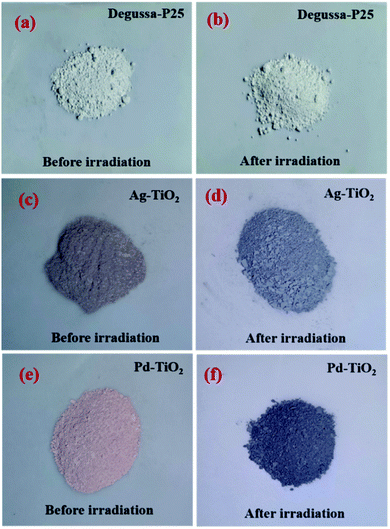 |
| | Fig. 10 (a)–(f) represent the photochromic effect in Degussa-P25, Ag+ doped TiO2, and Pd2+ doped TiO2, respectively. | |
The photoreduction provides electron scavenging and the empty M (4d–5s) orbitals provide sites storing the excited electron as represented in Fig. 9, thus increasing the lifespan of the photogenerated holes (h+), which leads to the enhanced photo-oxidation/degradation of dyes.
To establish a better understanding of the photochromism that play a defining role in the development of superior photocatalysts, we have further performed the degradation experiment under sunlight. Fig. 11 represents the degradation profile of MB dye using Pd2+ doped TiO2 before and after UV irradiation. It was observed that the MB dye degradation efficiency (%) of the samples before and after UV irradiation is 62% and 43% in 180 min, respectively. The presence of Pd2+ ion is responsible for photochromism in Pd2+ doped TiO2. The concentration of Pd2+ ion is higher in case of before UV irradiated sample (as supported by the XPS data) which implies better degradation efficiency in comparison to the irradiated sample.
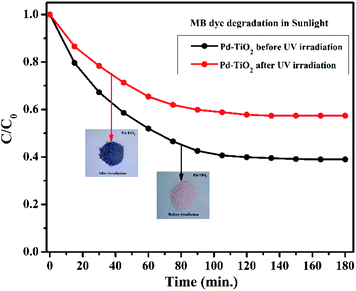 |
| | Fig. 11 Degradation of MB dye in sunlight using Pd2+ doped TiO2 samples before and after UV irradiation. | |
After photodegradation experiments with Ag+ and Pd2+ doped TiO2, pXRD of the spent catalyst was recorded and no change in the XRD patterns is observed, specifically Ag and Pd metal peaks are not observed. This implies that Ag+ and Pd2+ ions upon irradiation remain in the site and segregation of Ag or Pd does not occur. In fact, the catalyst can be oxidized in air and the colour returns to the initial colour of doped TiO2 indicating the regeneration of metal ions.
7. Conclusions
Successful synthesis of nanocrystalline Ti1−xMxO2−δ (M = Pd, Ag, Fe, and Ni; x = 0, 0.01) was achieved by the solution combustion method and higher photocatalytic dye degradation activity was observed in case of Ag+ and Pd2+ doped TiO2 photocatalysts. Upon UV irradiation, Pd2+ and Ag+ ions were reduced to their atomic state (i.e., Pd2+ → Pd0 and Ag+ → Ag0) through photoelectrons, a phenomenon similar to photochromism in glasses, which was confirmed by the XPS as well as the change in colour of the compound from light brown and yellow to black, respectively. The photoreduction of the noble metal ions act as the electron scavenging step which suppress the electron–hole recombination and increase the lifespan of the holes (h+) required for oxidation of organic dyes. Thus, Pd2+ and Ag+ ions in TiO2 behave differently than the first-row transition metal ions (Fe and Ni) in TiO2 and, in turn, the Ag+ and Pd2+ doped catalysts show remarkably superior photocatalytic activity towards the oxidation of organic dyes, making them potential candidates as heterogeneous catalysts for water pollution abatement.
Conflicts of interest
The authors declare no conflict of interest.
Acknowledgements
We thank IIT-BHU for the Seed Grants and the Department of Science and Technology (DST), Government of India for financial support.
References
- H. Zollinger, Color chemistry: synthesis, properties and applications of organic dyes and pigments, 2nd rev. edn, Weinheim, VCH, 1991 Search PubMed.
- A. R. Khataee, M. N. Pons and O. Zahraa, J. Hazard. Mater., 2009, 168, 451–457 CrossRef CAS PubMed.
- M. Amini and M. Ashrati, Nanochem. Res., 2016, 1, 79–86 CAS.
- M. R. Hoffmann, S. T. Martin, W. Choi and D. W. Bahnemann, Chem. Rev., 1995, 95, 69–96 CrossRef CAS.
- A. G. S. Prado, L. B. Bolzon, C. P. Pedroso, A. O. Moura and L. L. Costa, Appl. Catal., B, 2008, 82, 219–224 CrossRef CAS.
- H. Zhang, G. Chen and D. W. Bahnemann, J. Mater. Chem., 2009, 19, 5089–5121 RSC.
- S. K. Kansal, S. Kaur and S. Singh, Nanoscale Res. Lett., 2009, 4, 709–716 CrossRef CAS PubMed.
- W. Li, H. Ding, H. Ji, W. Dai, J. Guo and G. Du, Nanomaterials, 2018, 8, 415 CrossRef PubMed.
- P. Nandi and D. Das, Appl. Surf. Sci., 2019, 65, 546–556 CrossRef.
- A. Fujishima, T. N. Rao and D. A. Tryk, J. Photochem. Photobiol., C, 2000, 1, 1–21 CrossRef CAS.
- A. Fujishima, X. Zhang and D. A. Tryk, Surf. Sci. Rep., 2008, 63, 515–582 CrossRef CAS.
- J. Schneider, M. Matsuoka, M. Takeuchi, J. Zhang, Y. Horiuchi, M. Anpo and D. W. Bahneman, Chem. Rev., 2014, 11, 9919–9986 CrossRef PubMed.
- X. Chen, Z. Wu, D. Liu and Z. Gao, Nanoscale Res. Lett., 2017, 12, 143 CrossRef PubMed.
- G. Wang, B. Huang, Z. Li, Z. Lou, Z. Wang, Y. Dai and M.-H. Whangbo, Sci. Rep., 2015, 5, 8544 CrossRef CAS PubMed.
- M. R. Joya, J. B. Ortega, J. O. D. Malafatti and E. C. Paris, ACS Omega, 2019, 4, 17477–17486 CrossRef PubMed.
- T. T. Nguyen, S.-N. Nam, J. Son and J. Oh, Sci. Rep., 2019, 9, 9349 CrossRef PubMed.
- Y. Zhao, C. Eley, J. Hu, J. S. Foord, L. Ye, H. He and S. C. E. Tsang, Angew. Chem., 2012, 124, 3912–3915 CrossRef.
- G. Nagaraju, K. Karthik and M. Shashank, Microchem. J., 2019, 147, 749–754 CrossRef CAS.
- L. Korala, J. R. Germain, E. Chen, I. R. Pala, D. Li and S. L. Brock, Inorg. Chem. Front, 2017, 4, 1451–1457 RSC.
- Q. Zhang, X. Li, Q. Zhao, Y. Shi, F. Zhang, B. Liu, J. Ke and L. Wang, Appl. Surf. Sci., 2015, 337, 27–32 CrossRef CAS.
- V. Etacheri, M. K. Seery, S. J. Hinder and S. C. Pillai, Adv. Funct. Mater., 2011, 21, 3744–3752 CrossRef CAS.
- C. Byrne, R. Fagan, S. Hinder, D. E. McCormack and S. C. Pillai, RSC Adv., 2016, 6, 95232–95238 RSC.
- K. E. Karakitsou and X. E. Verykios, J. Phys. Chem., 1993, 97, 1184–1189 CrossRef CAS.
- S. Ghasemi, S. Rahimnejad, S. R. Setayesh, S. Rohani and M. R. Gholami, J. Hazard. Mater., 2009, 172, 1573–1578 CrossRef CAS PubMed.
- A. Garg, A. Singh, V. K. Sangal, P. K. Bajpai and N. Garg, New J. Chem., 2017, 41, 9931–9937 RSC.
- Y. Sui, Y. Hao, G. Wen, Y. Hu, L. Wu and S. Zhong, Appl. Surf. Sci., 2019, 475, 880–886 CrossRef CAS.
- S. Kim, S.-J. Hwang and W. Choi, J. Phys. Chem. B, 2005, 109, 24260–24267 CrossRef CAS PubMed.
- L. Kőrösi, S. Papp, J. Ménesi, E. Illés, V. Zöllmer, A. Richardt and I. Dékány, Colloids Surf., A, 2008, 319, 136–142 CrossRef.
- N. T. Nolan, M. K. Seery, S. J. Hinder, L. F. Healy and S. C. Pillai, J. Phys. Chem. C, 2010, 114, 13026–13034 CrossRef CAS.
- R. Liu, P. Wang, X. Wang, H. Yu and J. Yu, J. Phys. Chem. C, 2012, 116, 17721–17728 CrossRef CAS.
- X. Pan and Y.-J. Xu, ACS Appl. Mater. Interfaces, 2014, 6, 1879–1886 CrossRef CAS PubMed.
- K. Nagaveni, M. S. Hegde and G. Madras, J. Phys. Chem. B, 2004, 108, 20204–20212 CrossRef CAS.
- K. Nagaveni, M. S. Hegde, N. Ravishankar, G. N. Subanna and G. Madras, Langmuir, 2004, 20, 2900–2907 CrossRef CAS PubMed.
- H. Liu, W. Yang, Y. Ma, Y. Cao, J. Yao, J. Zhang and T. Hu, Langmuir, 2003, 19, 3001–3005 CrossRef CAS.
- H. Choi, Y. J. Kim, R. S. Varma and D. D. Dionysiou, Chem. Mater., 2006, 18, 5377–5384 CrossRef CAS.
- J.-N. Nian and H. Teng, J. Phys. Chem. B, 2006, 110, 4193–4198 CrossRef CAS PubMed.
- V. Chhabra, V. Pillai, B. K. Mishra, A. Morrone and D. O. Shah, Langmuir, 1995, 11, 3307–3311 CrossRef CAS.
- M. S. Lee, S. S. Park, G.-D. Lee, C.-S. Ju and S. S. Hong, Catal. Today, 2005, 101, 283–290 CrossRef CAS.
- J. Rubio, J. L. Oteo, M. Villegas and P. Duran, J. Mater. Sci., 1997, 32, 643–652 CrossRef CAS.
- Z. Ding, X. Hu, P. L. Yue, G. Q. Lu and P. F. Greenfield, Catal. Today, 2001, 68, 173–182 CrossRef.
- A. D. Paola, G. MarcÌ, L. Palmisano, M. Schiavello, K. Uosaki, S. Ikeda and B. Ohtan, J. Phys. Chem. B, 2002, 106, 637–645 CrossRef.
- S. T. Aruna and K. C. Patil, J. Mater. Synth. Process., 1996, 4, 175–180 CAS.
- G. Sivalingam and G. Madras, Appl. Catal., A, 2004, 269, 81–90 CrossRef CAS.
- B. D. Mukri and M. S. Hegde, J. Chem. Sci., 2017, 129, 1363–1372 CrossRef CAS.
- A. Gupta, U. V. Waghmare and M. S. Hegde, Chem. Mater., 2010, 22, 5184–5198 CrossRef CAS.
- J. L. Coutts, P. E. Hintze, A. Meier, M. G. Shah and R. W. Devor, et al., in 46th International conference on environmental systems, Vienna, Austria, July, 2016, vol. 169 Search PubMed.
- P. Makuła, M. Pacia and W. Macyk, J. Phys. Chem. Lett., 2018, 9, 6814–6817 CrossRef PubMed.
- B. Liu, X. Zhao and L. Wen, Mater. Sci. Eng., B, 2006, 134, 27–31 CrossRef CAS.
- S. Mathew, A. K. Prasad, T. Benoy, P. P. Rakesh, M. Hari, T. M. Libish, P. Radhakrishnan, V. P. N. Nampoori and C. P. G. Vallabhan, J. Fluoresc., 2012, 22, 1563–1569 CrossRef CAS PubMed.
- X. Xiang, X.-Y. Shi, X.-L. Gao, F. Ji, Y.-J. Wang, C.-M. Liu and X.-T. Zu, Chin. Phys. Lett., 2012, 29, 027801 CrossRef.
- B. Santara, P. K. Giri, K. Imakita and M. Fujii, J. Phys. Chem. C, 2013, 117, 23402–23411 CrossRef CAS.
- T. Dhandayuthapani, R. Sivakumar and R. Ilangovan, J. Mater. Sci.: Mater. Electron., 2017, 28, 15074–15080 CrossRef CAS.
- V. O. Ndabankulu, S. Maddila and S. B. Jonnalagadda, IOP Conf. Ser.: Mater. Sci. Eng., 2019, 668, 012011 CAS.
- R. W. Matthews, J. Catal., 1988, 111, 264–272 CrossRef CAS.
- S. Hüfner, Photoelectron Spectroscopy: Principles and Applications, Springer-Verlag Berlin Heidelberg, New York, 3rd edn, 2003 Search PubMed.
- K. Mizushima, M. Tanaka and S. Iida, J. Phys. Socs. Jpn., 1972, 32, 1519–1524 CrossRef CAS.
- K. Mizushima, M. Tanaka, A. Asai, S. Iida and J. B. Goodenough, J. Phys. Chem. Solids, 1979, 40, 1129–1140 CrossRef CAS.
- S. Vasudevan, M. S. Hegde and C. N. R. Rao, J. Solid State Chem., 1979, 29, 253–257 CrossRef CAS.
- J. Zhou, Y. Zhang, X. S. Zhao and A. K. Ray, Ind. Eng. Chem. Res., 2006, 45, 3503–3511 CrossRef CAS.
- F. Huang, A. Yan and H. Zhao, Wenbin. Cao., IntechOpen, 2016, pp. 31–80 Search PubMed.
|
| This journal is © The Royal Society of Chemistry 2022 |
Click here to see how this site uses Cookies. View our privacy policy here.  Open Access Article
 a,
Abhay Narayan Singhb,
Preetam Singh
 c and
Asha Gupta
 *a
*a
![[thin space (1/6-em)]](https://www.rsc.org/images/entities/char_2009.gif) :
:![[thin space (1/6-em)]](https://www.rsc.org/images/entities/char_2009.gif) 0.01
0.01![[thin space (1/6-em)]](https://www.rsc.org/images/entities/char_2009.gif) :
:![[thin space (1/6-em)]](https://www.rsc.org/images/entities/char_2009.gif) 1.14. The combustion reaction can be represented as:
1.14. The combustion reaction can be represented as:![[thin space (1/6-em)]](https://www.rsc.org/images/entities/char_2009.gif)
![[thin space (1/6-em)]](https://www.rsc.org/images/entities/char_2009.gif)
![[thin space (1/6-em)]](https://www.rsc.org/images/entities/char_2009.gif)


