 Open Access Article
Efficient conversion of lactic acid to alanine over noble metal supported on Ni@C catalysts†
Haosheng Xinabcd,
Zhongxun Xiuabc,
Shijun Liua,
Haiyong Wang abc,
Chenguang Wang
 abc,
Longlong Ma
 bc and
Qiying Liu
 *abc
*abc
aGuangzhou Institute of Energy Conversion, Chinese Academy of Sciences, Guangzhou 510640, P. R. China. E-mail: liuqy@ms.giec.ac.cn; Fax: +86-20-87057637; Tel: +86-20-37029835
bCAS Key Laboratory of Renewable Energy, Guangzhou 510640, P. R. China
cGuangdong Key Laboratory of New and Renewable Energy Research and Development, Guangzhou 510640, P. R. China
dUniversity of Chinese Academy of Sciences, Beijing 100049, P. R. China
First published on 7th June 2022
Abstract
Alanine (Ala), regarded as the building block for protein synthesis, has been widely used in the field of food processing, pharmaceutical, and bio-based plastic industries. Containing plenty of oxygenic functional groups, biomass-derived chemicals are proper for Ala synthesis in an economic and green way via amination. In this work, lactic acid (LA) derived from renewable biomass and waste glycerol (the major by-product of biodiesel industry) was used to produce Ala. Here, a series of magnetic catalysts M/Ni@C (M = Ru, Pt, Pd, Ir, and Rh) were synthesized by ethylene glycol reduction of metal M supported on encapsulated Ni@C. Compared with catalysts based on other M metals, Ru/Ni@C catalysts exhibited extraordinary efficiency with 91.4% selectivity for Ala synthesis from LA (63.7% yield of Ala and 69.7% conversion of LA). The results of experiments and catalyst characterization indicated that the doping of M metals could improve the dehydrogenation ability of catalysts, as well as the ability of NH3 adsorption, facilitating the reaction towards Ala. Overall, this study provides an efficient chemo-catalytic way for the production of Ala from biomass-derived substrates.
1. Introduction
As basic building blocks in protein synthesis, amino acids are widely used in the field of biological, pharmaceutical, and food industries for the synthesis of sweeteners and chiral medical intermediates.1 Currently, the production of amino acids is mainly achieved via microbial cultivation, but the severe operating conditions and complicated separation procedures are time-consuming and costly, which impose restrictions on their industrial application.2 Besides fermentation, amino acids can be synthesized by chemical methods, including the Strecker synthesis,3,4 Gabriel synthesis5 and Miller synthesis.6 As described in Strecker synthesis procedure, aldehydes, NH4Cl and cyanides were used to form α-amino nitrile as an intermediate, which was further hydrolyzed to Ala. However, the application of the Strecker synthesis is limited owing to the use of highly toxic cyanides as nitrogen sources. Similarly, the other two methods of chemical conversion are also restricted to industry application because of the low yield of products and complicated procedure. Therefore, developing a new process for efficient amino acid production via a green and clean way is of significance but still an open challenge.Biomass-derived chemicals, including plenty of oxygen-containing groups,7,8 which can be used as a renewable feedstock meet with the demand of economical and greener processes in amino acid production via amination.9 As reported, N-acetylglucosamine (NAG) can be used as a resource to yield glycine in two steps.10 NAG was first converted into N-acetylmonoethanolamine (AMEA) by Ru/C in a NaHCO3 aqueous solution that could avoid the side isomerization of the acetamido group in NAG under H2 pressure. For the second step, the combination of Ru/C and NaHCO3 was also applicable for the transformation of AMEA to glycine under O2 pressure. Recently, Deng et al. have realized the conversion from glucose to Ala in a two-step protocol: α-hydroxyl acids were produced first and further aminated to α-amino acids, and Ala yield of 43% was achieved in the presence of Ba(OH)2 and Ru/CNT.11 After that, Yan et al. realized the direct conversion of waste glycerol into Ala over a RuNi/MgO catalyst with high Ala yield of 43%.12 The conversion was conducted with dehydrogenation, dehydration, the Cannizzaro reaction and amination, and the cleavage of α-C–H of LA was identified as the rate-determining step calculated by density functional theory (DFT) calculations. Moreover, Ru supported on N-doped carbon nanotubes shows high efficiency on amination of bio-derived hydroxyl acids.13 After N was doped, the dispersion of Ru nanoparticles could be improved, facilitating the adsorption of acidic reactants through the basic sites. In conclusion, catalytic synthesis of amino acids from biomass-derived substrates is still in its infancy. Hence, it is of great interest to develop effective catalytic systems for amino acid production from biomass and its derivatives.
Lactic acid (LA), expediently accessible from biomass-derived substrates and waste glycerol (a major by-product of the biodiesel industry) conversion,14,15 possesses a hydroxyl group and a similar carbon block to Ala, which is qualified for Ala production.16–19 Conversion step of LA into Ala involves dehydrogenation, amination and hydrogenation, and the reaction pathway was rarely discussed, but we can reference the amination reaction of alcohols, aldehydes and ketones to design an appropriate catalyst.20,21 In the research by Zhang group, a Ru/ZrO2 catalyst was designed to convert glycolaldehyde, glyceraldehyde and various ketones in aqueous ammonia.22 The ratio of RuO2/Ru could be mediated by changing the temperature of pre-reduction, in which RuO2 activates the carbonyl group as a Lewis acidic site and Ru promotes hydrogenation as a metallic site. Wang et al. used methanol as a model compound to investigate the regularity of alcohol amination.23 Combined with the first-principles calculation, the relationship between various metal-alloy catalysts, reaction activity and primary amine selectivity was revealed, and the best catalytic performance could be achieved over the catalysts CoAg and CoRu. Shimizu et al. designed a Ni/Al2O3 catalyst for the amine alkylation without using any additives for the first time.24 The results indicated that the low-coordinated Ni species and the metal–support interface were the active sites, and the acid–base pair site of Al2O3 assisted the deprotonation and hydrogen-transfer steps.
Combined with the above-mentioned research on catalytic amination, it is recognized that dehydrogenation is the rate-limiting step when it is involved. Noble metals are favored as active metal sites with high performance of C–H cleavage for dehydrogenation. In addition, the introduction of metallic oxides as Lewis acid sites could also activate the hydroxyl group by adsorption.25 Hence, we designed and synthesized a magnetic bimetal Ru/Ni@C catalyst, and the catalyst exhibited extraordinary efficiency with 91.4% selectivity for synthesizing Ala from LA. Experimental and analysis results indicated that after metal Ru was introduced on Ni@C, the formed RuO2 was proved as the key active site in the dehydrogenation process for its excellent activation of the hydroxyl group in LA. Besides, a series of other noble magnetic catalysts M/Ni@C (M = Pt, Pd, Ir and Rh) were synthesized and compared.
2. Experimental
2.1. Materials
The chemicals used in this work, Ni(NO3)2·6H2O (AR, 98%), citric acid (AR, 99.5%), DL-lactic acid (AR, 99%), pyruvic acid (AR, 98%), DL-alanine (AR, 99%), DL-lactamide (98%), NH3·H2O (AR, 28%), RuCl3·nH2O (Ru ≥ 37.5 wt%), IrCl3 (Ir ≥ 60.0 wt%), RhCl3·3H2O (Rh ≥ 39 wt%), H2PtCl2·6H2O (Pt ≥ 37.5 wt%), PdCl2 (Pd ≥ 60.0 wt%), ethylene glycol (AR, 98%), and ethanol (AR, 99.5%) were purchased from Shanghai Macklin Biochemical Co., Ltd. H2SO4 (AR, 98%), formic acid (AR, 88%), acetic acid (AR, 99.8%), and propanoic acid (AR, 99.5%) were purchased from Sinopharm Chemical Reagent CO., Ltd. All the chemicals were used as received without further purification.2.2. Preparation of Ni@C, M/Ni@C (M = Ru, Pt, Pd, Ir, and Rh), CS (carbon shells), and Ru/CS
Finally, the black powder was collected with magnet, thoroughly washed with deionized water and dried in a freeze-dryer. The theoretical loadings of Ru metals are 5 wt%. Similarly, Pt/Ni@C, Pd/Ni@C, Ir/Ni@C and Rh/Ni@C were synthesized by the same way, and the raw materials were H2PtCl6·6H2O, PdCl2, IrCl3 and RhCl3·3H2O, respectively.
2.3. Catalyst characterization
X-ray diffraction (XRD) patterns were recorded in the range of 2θ = 10° to 80° using an X-ray diffractometer equipped with a Cu Kα radiation source (λ = 0.154 nm). High-resolution transmission electron microscopy (HRTEM) and relevant energy-dispersive X-ray (EDS) mappings were performed at an accelerating voltage of 200 kV using a JEM-2100 microscope. X-ray photoelectron spectroscopy (XPS) of the catalyst was performed using a multichannel Thermo Fisher Scientific Escalab 250 Xi photoelectron spectrometer equipped with a monochromatic Al-Kα radiation source (hν = 1486.6 eV). The actual binding energies with an error of ±0.1 eV were calibrated with an adventitious C 1s peak (284.8 eV). NH3-TPD profile was measured using an Autochem 2910 apparatus. A He flow rate of 80 mL min−1 was used to treat the catalyst at 600 °C for 2 h. Then, 8 vol% NH3/He was allowed to flow through the inlet, while the temperature was decreased to 100 °C. After that, physically absorbed NH3 was removed by He flow (80 mL min−1) for 1 h. Meanwhile, the program was carried out to target 650 °C at a heating rate of 10 °C min−1. In addition, the signal was recorded by TCD. The characterization was done by inductively coupled plasma atomic emission spectroscopy (ICP-AES) using a PerkinElmer OPTIMA 8000 instrument to measure the metal leaching. In addition, the metal loading (wt%) of mentioned catalysts was also quantified by ICP-AES.2.4. Catalytic performance
All the test reactions were carried out in a sealed 25 mL autoclave reactor (NSC25-P5-T3-HC1-SV, Anhui Kemi Machinery Technology Co., Ltd., Hefei, China). The details are as follows: 0.1 g substrate, 0.05 g catalysts and 10 mL NH3·H2O (28 wt%) solution were added to the autoclave. Then, the autoclave was sealed and purged with pure H2 five times and set in 1.5 MPa. After that, the autoclave was heated to a desired temperature for a certain time period under vigorous stirring (800 rpm). After each reaction, the autoclave was cooled down to room temperature naturally and the liquid was separated by filtration.For the recycling test, the Ru/Ni@C catalyst after reaction was collected by a magnet (Fig. S11†), fully washed several times with deionized water and then used for the next run directly after drying in a freeze-dryer.
The target product Ala was qualitatively analyzed by thin-layer chromatography (TLC). The principle of TLC is to separate species based on different adsorption capacities. The stationary phase used for TLC is a silica gel G plate (5 × 10 cm), the chromatographic solution is a mixed solution (n-butanol![[thin space (1/6-em)]](https://www.rsc.org/images/entities/char_2009.gif) :
:![[thin space (1/6-em)]](https://www.rsc.org/images/entities/char_2009.gif) AA
AA![[thin space (1/6-em)]](https://www.rsc.org/images/entities/char_2009.gif) :
:![[thin space (1/6-em)]](https://www.rsc.org/images/entities/char_2009.gif) water = 3 vol
water = 3 vol![[thin space (1/6-em)]](https://www.rsc.org/images/entities/char_2009.gif) :
:![[thin space (1/6-em)]](https://www.rsc.org/images/entities/char_2009.gif) 1 vol
1 vol![[thin space (1/6-em)]](https://www.rsc.org/images/entities/char_2009.gif) :
:![[thin space (1/6-em)]](https://www.rsc.org/images/entities/char_2009.gif) 1 vol), and the chromogenic reagent is a ninhydrin ethanol solution (0.2 g ninhydrin/100 mL ethanol). The Rf value of standard Ala is 0.47. The reaction solution catalyzed by Ru/Ni@C is shown in Fig. S1.†
1 vol), and the chromogenic reagent is a ninhydrin ethanol solution (0.2 g ninhydrin/100 mL ethanol). The Rf value of standard Ala is 0.47. The reaction solution catalyzed by Ru/Ni@C is shown in Fig. S1.†
The liquid products were quantitatively analyzed using a HPLC equipped with both RI and UV detectors. Ala was detected on a C18 column (4.6 × 250 mm) by a precolumn derivatization method, where phenyl isothiocyanate (PITC) was used as the derivatization reagent. LA and other products were analyzed using a Shodex Sugar SH1011 column (8.0 × 300 mm) with H2SO4 (0.005 mol L−1) as the mobile phase at a flow rate of 0.5 mL min−1. All products detected were calculated based on the external calibration method.
The conversion of LA, the yield and selectivity of products were calculated as follows:
 | (1) |
 | (2) |
 | (3) |
3. Results and discussion
3.1. Catalyst characterization
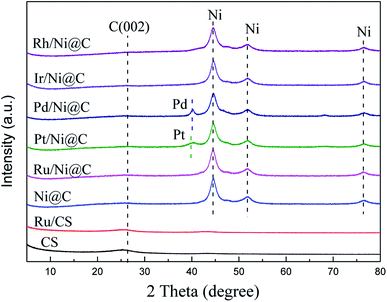
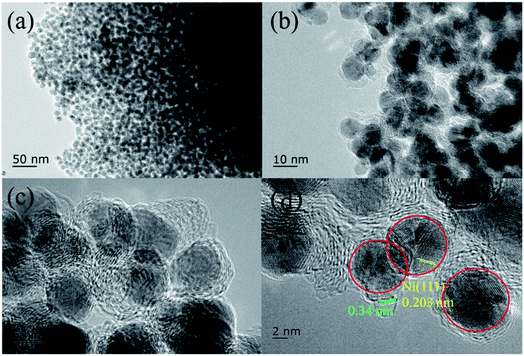
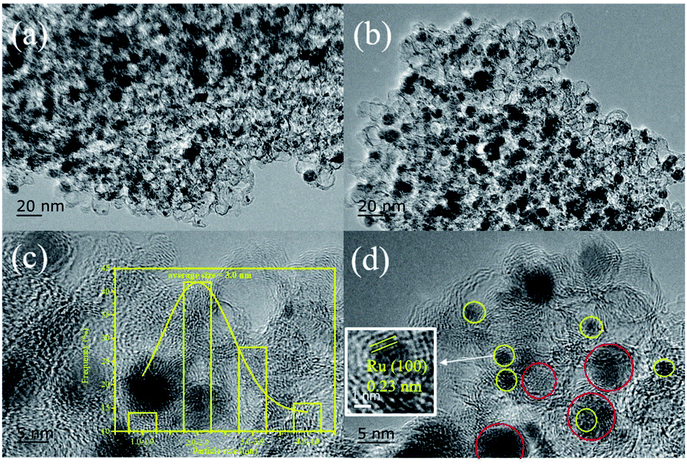
The XRD patterns of Ni@C, M/Ni@ C (M = Ru, Pt, Pd, Ir, and Rh), CS and Ru/CS are shown in Fig. 1. For Ni@C, the peaks centered at 44°, 51°, and 76° were attributed to the Ni phase (JCPDS File Card no. 04-0850). For the bimetal catalyst M/Ni@C, the noble metals showed no specific peaks except Pt/Ni@C and Pd/Ni@C, which displayed the high dispersion and small particle size of Ru, Ir and Rh. The diffraction peaks at 39.8°, 46.2°, and 67.4° correspond to the (111), (200), and (220) planes of Pt (JCPDS File Card no. 04-0802), and the (111) plane of Pt is mainly displayed for the Pt/Ni@C catalyst. The peaks at 40.1°, 46.6°, and 68.1° correspond to the (111), (200), and (220) planes of Pd (JCPDS File Card no. 46-1043), and the (111) plane of Pd is mainly displayed for Pd/Ni@C. This indicates that Pt and Pd metals were not well-dispersed, resulting in obvious diffraction peaks. The samples of CS and Ru/CS only showed a weak peak of C(002) (JCPDS File Card no. 41-1487) at 26.4°, which means that Ni metal particles were removed during the CS preparation process, and the Ru/CS dispersed homogenously after loading Ru.Fig. 2–4 and S2–S9† show the microscopic images of Ni@C, M/Ni@C and Ru/CS. As shown in Fig. 2, the nickel particles encapsulated with multilayer graphene carbons were observed for the Ni@C catalyst. In the HRTEM images, lattice fringes with interplanar distances of 0.34 nm and 0.203 nm were detected in Fig. 2d, corresponding to the interplanar spacing of the graphene and Ni(111) planes, respectively. The images of Ru/Ni@C are similar to Ni@C with encapsulated nickel particles, as shown in Fig. 3. The obscure existence of ruthenium particles is probably caused by the thick substrate of metal Ni and Ru. The diffraction fringes of Ru(100) were observed in the HRTEM image (Fig. 3d) measured as 0.23 nm. Besides, the Ru particles were uniformly dispersed on the surface of Ni@C in the element mapping image (Fig. 3e). The TEM and HRTEM images of Rh/Ni@C are similar to Ru/Ni@C, which showed no obvious rhodium particles in Fig. S2,† because of the close contrast between Rh and Ni, and the element mapping shown in Fig. S3† confirmed the well dispersion of Rh. For the catalysts of Pt/Ni@C and Pd/Ni@C in Fig. S4–S7,† there are some aggregated metal spots in TEM and mapping images, which is consistent with the XRD spectra. For the sample of Ir/Ni@C, many small spherical Ir particles and the diffraction fringes of Ir(200) with 0.192 nm can be observed in the HRTEM image (Fig. S8†). The uniform dispersion and small particle size of Ir are consistent with the XRD pattern. For the single metal catalyst Ru/CS, most nickel particles disappeared and ruthenium particles emerged around the hollow carbon shells, as shown in Fig. 4. In the elemental mapping images (Fig. 4e), there are few metal spots detected as Ni and Ru dispersed around CS. The small amount of Ni is probably derived from the incomplete acid treatment of CS.
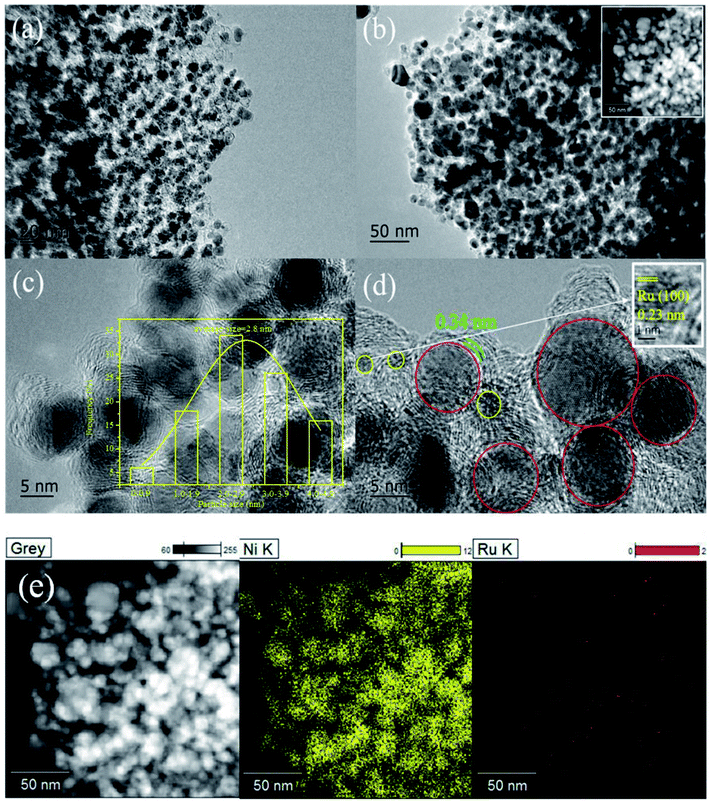 | ||
| Fig. 3 Ru/Ni@C catalyst: (a)–(d) TEM and HRTEM images and (e) chemical elemental mapping for the spatial distribution of Ni and Ru. | ||
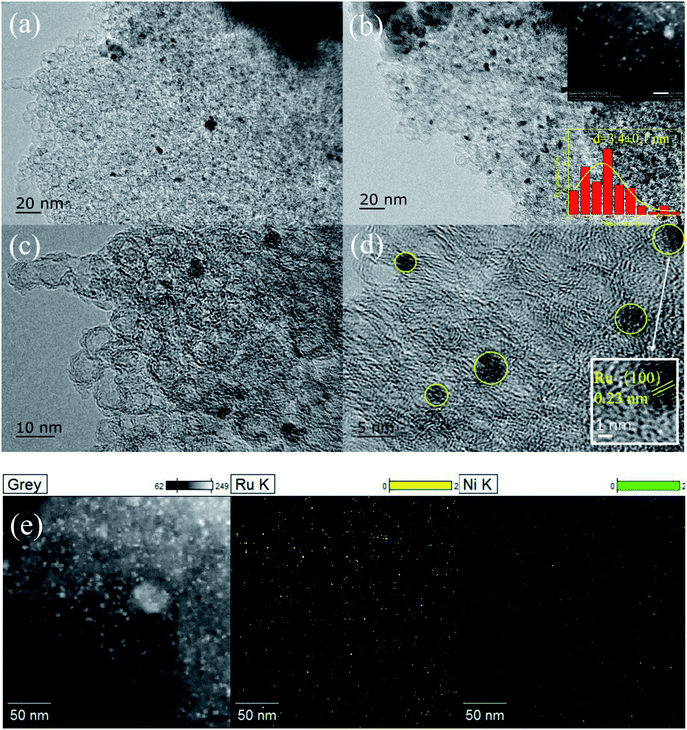 | ||
| Fig. 4 Ru/CS catalyst: (a)–(d) TEM and HRTEM images and (e) chemical elemental mapping for the spatial distribution of Ni and Ru. | ||
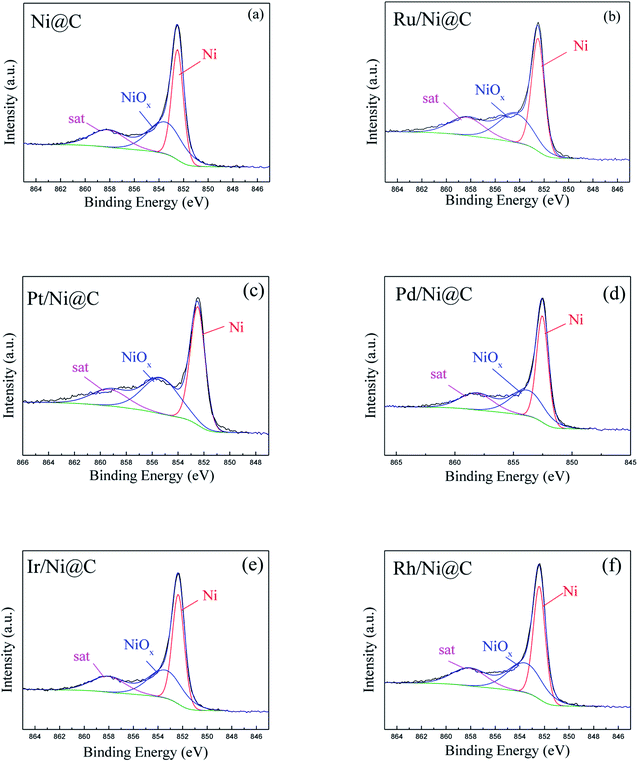
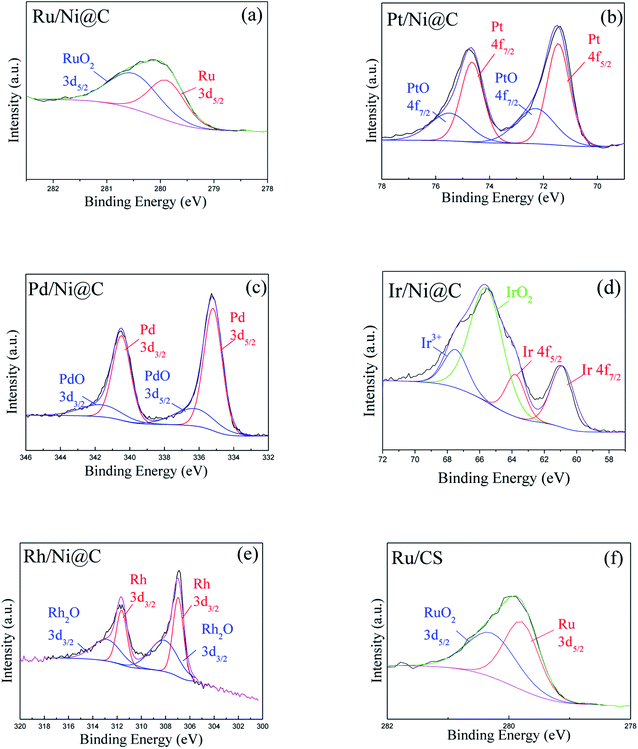
The surface chemical states of M/Ni@C catalysts were analyzed by XPS. The results indicated that the metals of Ni and M were both partially reduced in the preparation of catalysts. For the Ni 2p3/2 XPS spectra shown in Fig. 5, there is no obvious difference in the valence states and proportion for Ni0 and NiOx, which accounts for about 6![[thin space (1/6-em)]](https://www.rsc.org/images/entities/char_2009.gif) :
:![[thin space (1/6-em)]](https://www.rsc.org/images/entities/char_2009.gif) 4 for each M/Ni@C catalyst calculated by peak fitting, as given in Table 1. This also reflects the stability of the Ni@C supporter. Catalysts of Ru/Ni@C and Ru/CS show two similar peaks in Fig. 6a and f, representing Ru and RuO2 respectively. The oxidation of Ru accounts for 55.3% in the Ru/Ni@C catalyst, which is higher than 48.2% in the Ru/CS catalyst. The spectra of metal Pt (Fig. 6b) and Pd (Fig. 6c) indicate that Pt0 and Pd0 are the dominating metal chemical states of catalysts Pt/Ni@C and Pd/Ni@C, which is also consistent with the results presented in Table 1. Similar to other metal spectra, Fig. 6d and e show the peaks of metallic oxides of Ir and Rh, accompanied by the peak of Ir0 and Rh0. Conclusively, since no further reduction treatment was carried out on the M/Ni@C catalyst, the noble metals displayed both metal sites and ionic sites in the meantime.
4 for each M/Ni@C catalyst calculated by peak fitting, as given in Table 1. This also reflects the stability of the Ni@C supporter. Catalysts of Ru/Ni@C and Ru/CS show two similar peaks in Fig. 6a and f, representing Ru and RuO2 respectively. The oxidation of Ru accounts for 55.3% in the Ru/Ni@C catalyst, which is higher than 48.2% in the Ru/CS catalyst. The spectra of metal Pt (Fig. 6b) and Pd (Fig. 6c) indicate that Pt0 and Pd0 are the dominating metal chemical states of catalysts Pt/Ni@C and Pd/Ni@C, which is also consistent with the results presented in Table 1. Similar to other metal spectra, Fig. 6d and e show the peaks of metallic oxides of Ir and Rh, accompanied by the peak of Ir0 and Rh0. Conclusively, since no further reduction treatment was carried out on the M/Ni@C catalyst, the noble metals displayed both metal sites and ionic sites in the meantime.
| Catalyst | Ni (atom%) | M (atom%) | ||
|---|---|---|---|---|
| Ni0 | NiOx | M0 | MOx | |
| a Surface chemical states of Ni was calculated via peak fitting from XPS analysis referring from Yan.27b Surface chemical states of Ru was calculated via peak fitting from XPS analysis referring from Liang and Li.22,28c Surface chemical states of Pt was calculated via peak fitting from XPS analysis referring from Kim.29d Surface chemical states of Pd was calculated via peak fitting from XPS analysis referring from Lei.30e Surface chemical states of Ir was calculated via peak fitting from XPS analysis referring from Xu and Vos.31,32f Surface chemical states of Rh was calculated via peak fitting from XPS analysis referring from Jiang.33 | ||||
| Ni@Ca | 56.3 | 43.7 | — | — |
| Ru/Ni@Cb | 58.9 | 41.1 | 44.7 | 55.3 |
| Pt/Ni@Cc | 56.9 | 43.1 | 62.9 | 37.1 |
| Pd/Ni@Cd | 58.9 | 41.1 | 75.7 | 24.3 |
| Ir/Ni@Ce | 57.3 | 42.7 | 37.9 | 62.1 |
| Rh/Ni@Cf | 56.5 | 43.5 | 48.3 | 51.7 |
| Ru/CSb | — | — | 51.8 | 48.2 |
Besides, the chemical states of C and O in the Ru/Ni@C catalyst were analyzed and the results are shown in Fig. S10;† the existence of C–O–, C![[double bond, length as m-dash]](https://www.rsc.org/images/entities/char_e001.gif) O, and –COOH groups in the C1S spectra was due to the oxidation of the catalyst. The presence of signals of π–π∗ also proved that the Ni particles are encapsulated by graphene layers,26 which matches the TEM images shown in Fig. 3. In addition, we can further confirm that the metals Ni and Ru are present partially in the form of metal oxides according to the presence of lattice O species in Ru(Ni)–O bonds.34,35
O, and –COOH groups in the C1S spectra was due to the oxidation of the catalyst. The presence of signals of π–π∗ also proved that the Ni particles are encapsulated by graphene layers,26 which matches the TEM images shown in Fig. 3. In addition, we can further confirm that the metals Ni and Ru are present partially in the form of metal oxides according to the presence of lattice O species in Ru(Ni)–O bonds.34,35
In order to obtain the true metal loadings of catalysts, the ICP-AES analysis was executed and the results are listed in Table 2. Compared with the initial 78.8 wt% of Ni@C, the most Ni loss rate of 11.2 wt% was observed for Pt/Ni@C. In addition, the Pt agglomeration spots of Pt/Ni@C can be observed in TEM images (Fig. S4 and S5†), which is also consistent with the XRD spectrogram. Besides, the tiny loss of Ni occurred in other M/Ni@C catalysts. The content of metal M as detected in Table 2 was close to the theoretical value. It should be noted that, after five runs, there is almost no loss in the content of Ru on the Ru/Ni@C catalyst (the Ru leaching was below 1 ppm in the reaction liquid). Meanwhile, 4.6 wt% loss of Ni was observed.
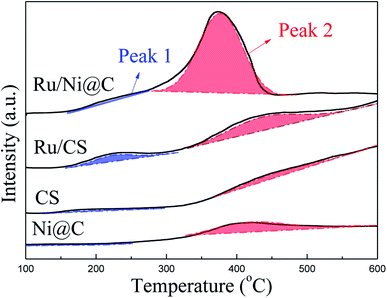
The ammonia adsorption properties of catalysts were measured by NH3-TPD, as shown in Fig. 7, and the acid amounts are listed in Table S1.† Compared with CS, the Ni@C catalyst only showed an obvious desorption peak at 417 °C, and the Ru/CS catalyst showed two enhanced peaks at 224 °C and 436 °C, respectively. This result revealed that the introduction of metal Ru is conducive to improving the NH3 adsorption capacity of the catalyst. When Ru was introduced, the catalyst of Ru/Ni@C shows significantly increased ammonia adsorption. The obvious increase in the desorption amount of NH3 in peak 2 indicates that Ru is the key for the increase in ammonia adsorption capacity, which is beneficial to promote the amination.11 Besides, the presented peak of the Ru/Ni@C catalyst at 376 °C indicates that the introduction of Ru would enhance the surface acidic sites apparently by forming RuO2, which is proved to be the main acid promoter.22
3.2. Catalytic performance
The conversion of LA to Ala was performed in a batch reactor and the main liquid products were detected as Ala (Ala), lactamide (LMD), and propanoic acid (PA). The qualitative analysis of Ala was performed by TLC, as shown in Fig. S1.†The catalytic performances of various M/Ni@C catalysts are summarized in Table 3. In the conversion of LA into Ala, Ni@C exhibited no obvious catalytic activity with the conversion of 2.7% and trace amounts of Ala. After doping with noble metals, the catalytic activity of the bimetal catalysts was significantly improved. Among them, Ru/Ni@C performed the highest catalytic activity (LA conv. = 70.5%, yield of Ala = 53.0%). In order to investigate the effect of Ru alone, we compared the commercial catalyst Ru/C with the laboratory-produced graphitic carbon shell-supported Ru/CS. The Ru/C exhibited inferior catalytic activity with the LA conversion and Ala yield of 35.0% and 22.0%, respectively, while the enhanced performance was observed over Ru/CS with the 63.4% conversion and 49.1% Ala yield. The adjacent value of catalytic effect between Ru/Ni@C and Ru/CS implies that Ru is the main active metal of Ru/Ni@C, and the metal Ni and graphitic carbon shell CS promote the reaction in cooperation.
| Catalyst | Conversion (%) | Yieldb (%) | TOCc (%) | ||
|---|---|---|---|---|---|
| Ala | PA | LMD | |||
| a Reaction conditions: LA 0.1 g, catalyst 50 mg, NH3·H2O (28 wt%) 10 mL, 493 K, H2 1.5 MPa H2, 2 h.b Products: LA (lactic acid), Ala (alanine), PA (propanoic acid), LMD (lactamide).c TOC: carbon balances were calculated according to both detected products and the converted LA. | |||||
| Ni@C | 2.7 | 1.0 | 0 | 1.0 | 74.1 |
| Ru/Ni@C | 70.5 | 53.0 | 3.4 | 0.2 | 80.3 |
| Pt/Ni@C | 62.4 | 40.4 | 4.9 | 0.4 | 71.0 |
| Pd/Ni@C | 17.3 | 16.1 | 0 | 0.3 | 95.4 |
| Ir/Ni@C | 58.5 | 44.4 | 0.5 | 0.7 | 77.9 |
| Rh/Ni@C | 29.1 | 23.2 | 0 | 0.2 | 84.2 |
| Ru/C | 30.5 | 22.0 | 0 | 1.0 | 75.4 |
| Ru/CS | 63.4 | 49.1 | 2.1 | 0.1 | 80.9 |
Considering that the presence of H2 may inhibit the forward reaction proceeding of dehydrogenation, we compared the effect of different atmospheres (H2 and N2) on the reaction over the Ru/Ni@C catalyst, and the result is displayed in Table 4. In the atmosphere of H2, Ala and PA were generated as the main product and by-product, respectively. However, the product distribution was reversed in N2, where a large number of acetic acid (AA, yield = 21.7%) and ethanol (yield = 12.6%) appeared as the yield of Ala decreased to 18.1%. A plausible explanation is that H2 would not inhibit the dehydrogenation reaction under such low pressure, while the final hydrogenation step toward Ala will be impeded in the absence of H2 accompanied by other side reactions such as the formation of AA and ethanol.12
| Atmosphere | Conversion (%) | Yield (%) | TOC (%) | |||
|---|---|---|---|---|---|---|
| Ala | AA | PA | Ethanol | |||
| a Reaction conditions: LA 0.1 g, Ru/Ni@C catalyst 50 mg, NH3·H2O (28 wt%) 10 mL, 493 K, H2/N2 1.5 MPa, 2 h. Ala (alanine), PA (propanoic acid), AA (acetic acid). | ||||||
| H2 | 70.5 | 53.0 | 0 | 3.4 | 0 | 80.3 |
| N2 | 83.3 | 18.1 | 21.7 | 6.0 | 12.6 | 70.1 |
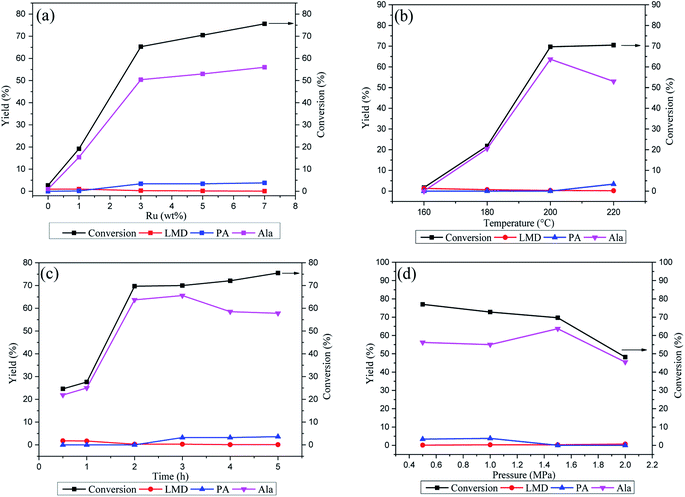
In order to optimize the catalytic activity in the reaction, the Ru loading of the Ru/Ni@C catalyst and reaction parameters (Ru loading, temperature, reaction time and H2 pressure) were tested. In Fig. 8a, as the Ru loading increased from 0 wt% to 7 wt%, the catalytic activity of Ru/Ni@C was promoted (conv: 2.7% to 75.6%, Ala yield: 1.0 to 56.0%), while the by-product PA increased as well. The results indicated that metal Ru was the main active site for Ru/Ni@C and the 5 wt% Ru loading was chosen in the view of economy and selectivity.
The effect of reaction temperature is shown in Fig. 8b. The increase in the reaction temperature promoted the conversion of LA, and Ala yield increased before the temperature increased to 200 °C and began to decrease with the further increase in the reaction temperature. In addition, the by-products showed the opposite trend, which indicated that the conversion of LA into Ala is sensitive to the reaction temperature, and higher temperature could induce the side reaction and suppress the production of Ala. Hence, it is reasonable to fix the temperature at 200 °C in which no PA was produced and Ala reached the highest yield of 63.7%. Fig. 8c depicts the influence of reaction time in the LA conversion. The conversion and Ala yield increased with the time prolonging in the first 2 hours and change slightly after that. In addition, the yield of the main byproduct (PA) increased after 2 hours. Therefore, the reaction time was fixed for 2 hours in the next research. Fig. 8d shows the effect of H2 pressure in the reaction. As the pressure increased, the LA conversion decreased continuously in the range of 0.5–2 MPa, which implied that the reaction proceeds in a dehydrogenation way. Moreover, the highest yield of Ala was achieved at 1.5 MPa H2, and it is also the hydrogen pressure with the lowest by-product yields. In conclusion, compared with previous related reports,11,12 the best catalytic performance can be obtained with a higher conversion efficiency (91.4% selectivity, LA conversion of 69.7% and Ala yield of 63.7%) and milder reaction conditions of 200 °C for 2 h.
3.3. Catalyst stability
The Ru/Ni@C catalyst was recovered by magnetic separation (Fig. S11†), thoroughly washed several times with deionized water, and then directly used for the next run. Fig. 9 shows the investigation of the recycle test of the Ru/Ni@C catalyst and the corresponding metal loss rate was detected in the reaction liquid. During Ru/Ni@C recycling, the LA conversion and Ala yield gradually decreased. After the 4th run, the LA conversion and Ala yield decreased by 26.1% and 24.4%, respectively, and the rate dropped significantly after the fifth cycle. The declined activity of Ru/Ni@C may be induced as: (1) the catalyst might suffer inevitable loss during the magnetic recovery process and (2) the active sites might be leached under the alkaline and high-temperature conditions. In addition, we detected the concentration of Ni and Ru leaked in the reaction solution by ICP-AES. The results indicated that there was Ni leaching in the solution with the loss rate of 1.4–2.1 wt%, and no loss of Ru was detected. Besides, we dissolved the recycled catalyst after the 5th run and tested the metal loading, as listed in Table 2, which confirmed the Ni loss of 4.6% compared to the Ni loading of fresh one. In addition, TEM and XPS analysis were used to characterize the morphology and chemical composition of recycled Ru/Ni@C.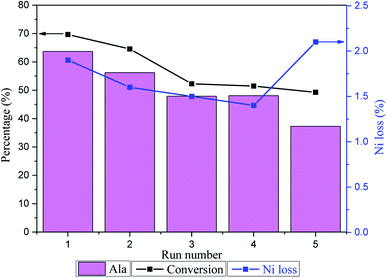 | ||
| Fig. 9 Recycle test of the Ru/Ni@C catalyst and the Ni loss in the reaction solution. Reaction conditions: LA 0.1 g, NH3·H2O (28 wt%) 10 mL, 473 K, H2 1.5 MPa, 2 h. | ||
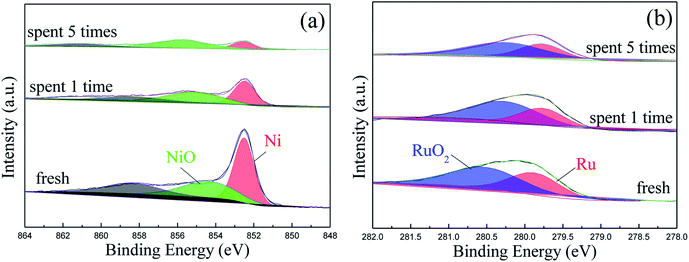
Fig. 10 depicts the TEM and HRTEM images of Ru/Ni@C after the 5th run. It can be seen that a certain number of Ni particles removed from the graphene layers and many hollow carbon shells appeared instead. The average size of Ru particles after use was increased from 2.8 nm to 3.0 nm slightly. The XPS analysis of the spent catalyst is shown in Fig. 11, and the surface atomic percentages of Ni and Ru are calculated in Table 5. The weakened intensity of Ni for the recycle catalyst verified the nickel leaching during the reaction. Besides, the percentage of the oxidation state of Ni increased obviously with the cycle number increment, while the content of Ru4+ increased slightly. The change in the electronic state of Ru after being reused is probably due to the partial oxidation of Ru0 that acted in the hydrogenation step. In conclusion, the ordinary cycle performance of Ru/Ni@C was caused by the mass loss during recovery and a slight increase in the Ru particle size, as well as the leaching and oxidation of Ni during the reaction.
| Ru/Ni@C | Ni (atom%) | Ru (atom%) | ||
|---|---|---|---|---|
| Ni0 | Ni2+ | Ru0 | Ru4+ | |
| Fresh | 58.9 | 41.1 | 44.7 | 55.3 |
| Spent after one time | 45.9 | 54.1 | 33.9 | 66.1 |
| Spent after five times | 27.3 | 72.7 | 39.2 | 60.8 |
3.4. Mechanism study
The previous report supposed that Ala may be produced from LA in two ways: (1) LA was dehydrogenated to pyruvate acid first, and then converted into imine under ammonia, following hydrogenation to form Ala and (2) α-OH of LA undergoes the SN2 substitution to generate Ala directly.11 The pathway of dehydrogenation-amination-hydrogenation was confirmed when using α-hydroxyisopropanoic acid without α-C–H sites as the reactant in the research. Therefore, we use the possible intermediate pyruvate acid as a substrate to investigate the performance of the catalyst. In Table 6, there is no obvious difference in the yield of Ala with and without the addition of catalysts. The results verified that the LA undergoes a dehydrogenation–amination–hydrogenation pathway, and the catalyst is crucial in the initial step of dehydrogenation.| Catalyst | Conv. (%) | Yield (%) | TOC | |
|---|---|---|---|---|
| Ala | LA | |||
| a Reaction conditions: 0.1 g pyruvic acid, 50 mg catalyst, 10 mL NH3·H2O (28 wt%), 373 K, 2 h, 1.5 MPa H2. LA (lactic acid), Ala (alanine). | ||||
| None | 97.1 | 68.3 | 0.7 | 71.1 |
| Ru/Ni@C | 97.3 | 69.0 | 2.43 | 73.4 |
During this process, LMD and PA were detected as the main by-products in this reaction. There are few studies on the conversion of LA into PA, and the mechanism is not completely clear. Korstanje et al. used a homogeneous catalyst molybdenum complex in the conversion of LA into PA at 200–270 °C with a PA yield of 41%.36 The article speculated two possible pathways in the reaction: (1) LA is first dehydrated to acrylic acid and then hydrogenated to PA. (2) LA forms PA directly via hydrodeoxygenation. Besides, the by-product of AA could be originated from the oxidation of the aldehyde which was decarbonylated/decarboxylated from LA, pyruvate or acrylic acid.37 What is more, the intermediate pyruvate acid could produce formic acid (FA) through C–C bond cleavage at high temperatures.38 The possible reaction pathway is shown in Scheme 1.
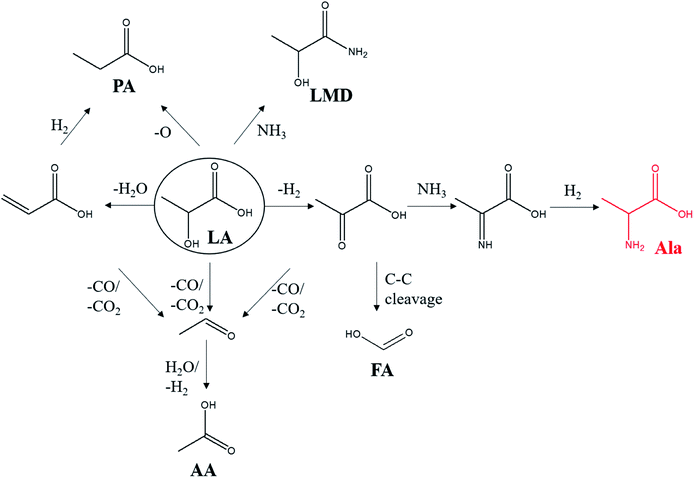 | ||
| Scheme 1 Possible reaction pathway of LA conversion. LA (lactic acid), Ala (alanine), PA (propanoic acid), LMD (lactamide), AA (acetic acid), FA (formic acid). | ||
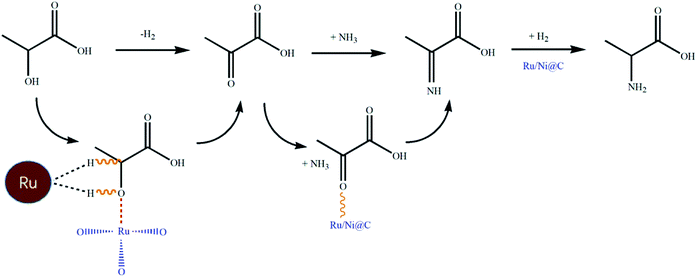
Combining the performance of various M/Ni@C and the results of NH3-TPD analysis, the high activity of Ru/Ni@C could be explained as follows: the metals Ru and Ni promote the dehydrogenation step collectively with Ru acting as the main active site. The formed Lewis acids of RuO2 are mainly responsible for activating the hydroxyl group of LA, which could promote the dehydrogenation step and form pyruvic acid as the intermediate. The addition of Ru not only provides an active metal site for dehydrogenation, but also greatly promotes the NH3 adsorption for amination reaction.39 The role of metallic oxide in amination has also been discussed in many research studies. Zhang et al. designed a Ru/ZrO2 catalyst in the aldehyde/ketone amination, where RuO2 acted as a Lewis acid and activated the carbonyl group.22 Shimizu et al. tested the catalytic effect of different supports (Lewis acidic, Brønsted acidic and basic) in the ketone amination.40 The catalyst with Lewis acid supports can reduce the adsorption wavelength of the C![[double bond, length as m-dash]](https://www.rsc.org/images/entities/char_e001.gif) O bond and increase the primary amine yield. Wang et al. modified Pt/CeO2 with CoOx for the amination of alcohols, in which CoOx improved the activity and selectivity of products by promoting the dehydrogenation of alcohols and inhibiting the excessive hydrogenation of Schiff bases.41 Therefore, the effect of the metal site of Ru and the Lewis site of RuO2 could be depicted, as shown in Scheme 2.
O bond and increase the primary amine yield. Wang et al. modified Pt/CeO2 with CoOx for the amination of alcohols, in which CoOx improved the activity and selectivity of products by promoting the dehydrogenation of alcohols and inhibiting the excessive hydrogenation of Schiff bases.41 Therefore, the effect of the metal site of Ru and the Lewis site of RuO2 could be depicted, as shown in Scheme 2.
4. Conclusions
A suite of magnetically separable catalysts M/Ni@C (M = Ru, Pt, Pd, Ir, and Rh) have been synthesized to evaluate the conversion of LA into Ala in an ammonia solution. The related characterization analysis results indicated that most noble metals could disperse uniformly on Ni@C, and the production of Ala could be significantly promoted after noble metals were introduced. The Ru/Ni@C catalyst showed the best catalytic performance with the highest 91.4% selectivity for Ala synthesis from LA (Ala yield was 63.7%). The mechanism study revealed that metal Ru is the main active metal site responsible for the dehydrogenation of LA, which is the rate-determining step in the conversion of LA into Ala. After metal Ru was introduced, the formed RuO2 works as a Lewis acid that could activate the hydroxyl group of LA, so that the formation of intermediate pyruvic acid would be promoted, and the following amination could be also be facilitated due to the excellent ability of NH3 adsorption of the Ru/Ni@C catalyst. This work offered an opportunity for efficient conversion of biomass-derived acids with the α-hydroxyl group to high-value amino acids via a catalytic route.Author contributions
Haosheng Xin: Investigation, Experiment, Analysis, Writing. Zhongxun Xiu: Experiment, Investigation. Shijun Liu: Analysis. Haiyong Wang: Analysis, Founding provider. Chenguang Wang & Longlong Ma: Supervision, Founding provider. Qiying Liu: Analysis, Editing, Founding provider.Conflicts of interest
The authors declare that they have no competing financial interests or personal relationships in this work.Acknowledgements
This work was financially supported by the National Key Research and Development Program of China (2019YFC1905303), the National Natural Science Foundation of China (51976220 and 52006225) and R&D Plan of Key Filed in Guangdong Province (2020B1111570001).References
- N. Tonouchi and H. Ito, Adv. Biochem. Eng. Biotechnol., 2017, 159, 3–14 CrossRef PubMed.
- K. U. Seiji Ogo, T. Abura and S. Fukuzumi, J. Am. Chem. Soc., 2004, 126, 3020–3021 CrossRef.
- v. A. Strecker, Eur. J. Org. Chem., 1850, 75, 27–45 Search PubMed.
- H. Groger, Chem. Rev., 2003, 103, 2795–2827 CrossRef.
- N. Yan and Y. Wang, Chem, 2019, 5, 739–741 CAS.
- E. T. Parker, H. J. Cleaves, J. P. Dworkin, D. P. Glavin, M. Callahan, A. Aubrey, A. Lazcano and J. L. Bada, Proc. Natl. Acad. Sci. U.S.A., 2011, 108, 5526–5531 CrossRef CAS.
- Y. Zhang, X. Tong, L. Yu, L. Meng, P. Guo and S. Xue, Green Energy. Environ., 2019, 4, 424–431 CrossRef.
- L. Liu, X. Yang, Q. Hou, S. Zhang and M. Ju, J. Clean. Prod., 2018, 187, 380–389 CrossRef CAS.
- A. Afanasenko, T. Yan and K. Barta, Commun. Chem., 2019, 2, 127 CrossRef.
- K. Techikawara, H. Kobayashi and A. Fukuoka, ACS Sustainable Chem. Eng., 2018, 6, 12411–12418 CrossRef CAS.
- W. Deng, Y. Wang, S. Zhang, K. M. Gupta, M. J. Hulsey, H. Asakura, L. Liu, Y. Han, E. M. Karp, G. T. Beckham, P. J. Dyson, J. Jiang, T. Tanaka, Y. Wang and N. Yan, Proc. Natl. Acad. Sci. U.S.A., 2018, 115, 5093–5098 CrossRef CAS.
- Y. Wang, S. Furukawa, S. Song, Q. He, H. Asakura and N. Yan, Angew. Chem., Int. Ed., 2020, 59, 2289–2293 CrossRef CAS PubMed.
- Z. Xie, B. Chen, F. Peng, M. Liu, H. Liu, G. Yang and B. Han, ChemSusChem, 2020, 13, 5683–5689 CrossRef CAS PubMed.
- H. Su, Z. Bi, Y. Ni and L. Yan, Green Energy Environ., 2019, 4, 391–399 CrossRef.
- J. Chopra, B. R. Tiwari, B. K. Dubey and R. Sen, J. Clean. Prod., 2020, 271, 122349 CrossRef CAS.
- Z. Lu, I. Demianets, R. Hamze, N. J. Terrile and T. J. Williams, ACS Catal., 2016, 6, 2014–2017 CrossRef CAS.
- J. Xu, H. Zhang, Y. Zhao, B. Yu, S. Chen, Y. Li, L. Hao and Z. Liu, Green Chem., 2013, 15, 1520–1525 RSC.
- L. S. Sharninghausen, J. Campos, M. G. Manas and R. H. Crabtree, Nat. Commun., 2014, 5, 5084 CrossRef CAS.
- D. Roy, B. Subramaniam and R. V. Chaudhari, ACS Catal., 2011, 1, 548–551 CrossRef CAS.
- J. Gallardo-Donaire, M. Ernst, O. Trapp and T. Schaub, Adv. Synth. Catal., 2016, 358, 358–363 CrossRef CAS.
- K.-i. Shimizu, K. Kon, W. Onodera, H. Yamazaki and J. N. Kondo, ACS Catal., 2012, 3, 112–117 CrossRef.
- G. Liang, A. Wang, L. Li, G. Xu, N. Yan and T. Zhang, Angew. Chem., Int. Ed., 2017, 56, 3050–3054 CrossRef CAS PubMed.
- T. Wang, J. Ibañez, K. Wang, L. Fang, M. Sabbe, C. Michel, S. Paul, M. Pera-Titus and P. Sautet, Nat. Catal., 2019, 2, 773–779 CrossRef CAS.
- K.-i. Shimizu, N. Imaiida, K. Kon, S. M. A. Hakim Siddiki and A. Satsuma, ACS Catal., 2013, 3, 998–1005 CrossRef CAS.
- Y. Román-Leshkov and M. E. Davis, ACS Catal., 2011, 1, 1566–1580 CrossRef.
- Q. Liu, H. Wang, H. Xin, C. Wang, L. Yan, Y. Wang, Q. Zhang, X. Zhang, Y. Xu, G. W. Huber and L. Ma, ChemSusChem, 2019, 12, 3977–3987 CrossRef CAS PubMed.
- X. Yan, J. Zheng, L. Zheng, G. Lin, H. Lin, G. Chen, B. Du and F. Zhang, Mater. Res. Bull., 2018, 103, 150–157 CrossRef CAS.
- W. Li, P. Liu, R. Niu, J. Li and S. Wang, Solid State Sci., 2020, 99, 105983 CrossRef CAS.
- J. Kim, S.-I. Kim, S. G. Jo, N. E. Hong, B. Ye, S. Lee, H. S. Dow, D. H. Lee and J. W. Lee, Catal. Today, 2020, 352, 10–17 CrossRef.
- J. Lei, R. Niu, S. Wang and J. Li, Solid State Sci., 2020, 101, 106097 CrossRef CAS.
- L. Xu, Y. Li, P. Zhang, S. Chen and L. Wang, Int. J. Hydrogen Energy, 2019, 44, 24360–24368 CrossRef CAS.
- J. G. Vos, T. A. Wezendonk, A. W. Jeremiasse and M. T. M. Koper, J. Am. Chem. Soc., 2018, 140, 10270–10281 CrossRef CAS PubMed.
- Y. Jiang, J. Lang, X. Wu and Y. H. Hu, Catal. Today, 2020, 356, 570–578 CrossRef CAS.
- F. He, N. Xia, Y. Zheng, Y. Zhang, H. Fan, D. Ma, Q. Liu and X. Hu, ACS Appl. Mater. Interfaces, 2021, 13, 8488–8496 CrossRef CAS.
- K. Zhang, Q. Meng, H. Wu, T. Yuan, S. Han, J. Zhai, B. Zheng, C. Xu, W. Wu, M. He and B. Han, Green Chem., 2021, 23, 1621–1627 RSC.
- T. J. Korstanje, H. Kleijn, J. T. B. H. Jastrzebski and R. J. M. Klein Gebbink, Green Chem., 2013, 15, 982–988 RSC.
- J. C. Serrano-Ruiz and J. A. Dumesic, ChemSusChem, 2009, 2, 581–586 CrossRef CAS PubMed.
- P. Gao, G. Li, F. Yang, X.-N. Lv, H. Fan, L. Meng and X.-Q. Yu, Ind. Crop. Prod., 2013, 48, 61–67 CrossRef CAS.
- S. Tian, Y. Jiao, Z. Gao, Y. Xu, L. Fu, H. Fu, W. Zhou, C. Hu, G. Liu, M. Wang and D. Ma, J. Am. Chem. Soc., 2021, 143, 16358–16363 CrossRef CAS PubMed.
- Y. Nakamura, K. Kon, A. S. Touchy, K.-i. Shimizu and W. Ueda, ChemCatChem, 2015, 7, 921–924 CrossRef CAS.
- T. Tong, W. Guo, X. Liu, Y. Guo, C.-W. Pao, J.-L. Chen, Y. Hu and Y. Wang, J. Catal., 2019, 378, 392–401 CrossRef CAS.
Footnote |
| † Electronic supplementary information (ESI) available. See https://doi.org/10.1039/d2ra02514k |
| This journal is © The Royal Society of Chemistry 2022 |

