 Open Access Article
Selective strontium adsorption using synthesized sodium titanate in aqueous solution
Gyuhyeon Kim a,
Dae Sung Lee
 b,
Harry Ecclesc,
Su Min Kimd,
Hyun Uk Cho*d and
Jong Moon Park
 *aefg
*aefg
aDivision of Advanced Nuclear Engineering, Pohang University of Science and Technology, Pohang 37673, Republic of Korea
bDepartment of Environmental Engineering, Kyungpook National University, 80 Daehak-ro, Buk-gu, Daegu 41566, Republic of Korea
cSchool of Computing, Engineering and Physical Sciences, University of Central Lancashire, Preston PR1 2HE, UK
dDepartment of Marine Environmental Engineering, Gyeongsang National University, Tongyeong 53064, Republic of Korea. E-mail: hucho@gnu.ac.kr
eSchool of Environmental Science and Engineering, Pohang University of Science and Technology, Pohang 37673, Republic of Korea
fDepartment of Chemical Engineering, Pohang University of Science and Technology, Pohang 37673, Republic of Korea
gSchool of Integrated Technology, Yonsei University (POSTECH-Yonsei Open Campus), Pohang 37673, Republic of Korea. E-mail: jmpark@postech.ac.kr
First published on 29th June 2022
Abstract
Amorphous sodium titanates were synthesized using a mid-temperature sol–gel method for evaluation as selective adsorbents of strontium in the presence of cesium or metal cations (Al3+, Mg2+, Ca2+, and Mn2+) from aqueous solution. Synthesized sodium titanate showed high adsorption capacity and selectivity for strontium. The maximum adsorption capacity of strontium by sodium titanate was 193.93 mg g−1 in aqueous solution containing an initial concentration of 5 mM (438.60 mg L−1) strontium and 5 mM (666.67 mg L−1) cesium, and this sodium titanate removed 99.9% of the strontium and 40.67% of cesium from an aqueous solution that had an initial concentration of 1.14 mM (100 mg L−1) strontium and 0.75 mM (100 mg L−1) cesium. Strontium adsorption by synthesized sodium titanate followed pseudo-second-order kinetics and a generalized Langmuir isotherm model, and reached an adsorption equilibrium within 1 h with high adsorption capacity at equilibrium. Adsorbed strontium onto synthesized sodium titanate showed the behavior of forming a strontium titanate structure with a titanate frame via surface precipitation.
1 Introduction
Radionuclide pollutants have been released in large amounts by atmospheric nuclear tests, mining and milling of uranium, reprocessing of spent nuclear fuel, and operation, decontamination and decommissioning of nuclear power facilities.1–5 Particularly, after the Fukushima Dai-ichi nuclear power plant accident many of the radionuclides have fallen to rivers, groundwater, and oceans.6 In water, radionuclides can take various forms such as elements, precipitates, oxides, ionic forms, and organic or inorganic complexes, so suitable methods must be developed to treat each discharged radionuclide.7Among these radionuclides, strontium-90 and cesium-137 have long-term environmental influence because of their high fission yield and long half-life (90Sr = 28.8 years; 137Cs = 30.1 years).8,9 Particularly, strontium species have high mobility, high water solubility, and high specific radioactivity.10 Moreover, radioactive strontium is more weakly adsorbed to particles in seawater than is radioactive cesium, which is also an abundant material in released radionuclides, because the elemental concentration of inactive strontium is significantly higher than cesium in seawater. Strontium therefore acts more strongly as a carrier and is much better stabilized than cesium.11 Hence, effective and specific methods to treat strontium in aquatic environment are required for nuclear safety and prevention of environmental pollution.
To remove radionuclides in a water environment, many techniques are used in the nuclear industry.12 Adsorption is a primary technique for removing radionuclides with high economic feasibility and availability.13 Several types of organic and inorganic adsorbents such as natural zeolites, porous carbon composites, graphene oxides, ammonium molybdophosphate composites, hydroxyapatites, and sodium titanates have been used for removing strontium from aquatic circumstances.10,14–18 In particular, sodium titanates have distinctive physico-chemical characteristics such as a low temperature compound, chemical stability at high pH, and great ability to adsorb strontium, uranium, neptunium, and plutonium in a wide range of pH and high salt concentrations.19–22 Several sodium titanate composites such as monosodium titanates, sodium peroxotitanates, sodium nonatitanates, and sodium iron titanates have been developed for effective adsorption of strontium in aquatic environment that includes diverse radionuclides.22–25 However, selective adsorption of strontium onto sodium titanates in aqueous solution containing cesium or metal cations has not been evaluated; this competitive adsorption behavior of strontium under multicomponent conditions should be quantified.
The objectives of this study were to evaluate the selective adsorption of strontium onto sodium titanates in aqueous solution containing cesium or metal cations, and to investigate the adsorption mechanism of strontium onto sodium titanates in the presence of cesium. For these purposes, we synthesized two amorphous sodium titanates that had higher selectivity for adsorption of strontium than of cesium by using a mid-temperature (≤100 °C) sol–gel method, then evaluated their physical and chemical characteristics. We also compared their adsorption capacity, kinetics, and isotherms for adsorption of strontium.
2 Experimental
2.1 Chemical reagents
All chemical compounds and reagents were high purity laboratory grade or ACS reagents, and were used without additional purification. All were purchased from Merck KGaA: titanium isopropoxide (Ti[OCH(CH3)2]4, ≥97%), sodium methoxide (CH3ONa, 25 wt% in methanol), cesium nitrate (CsNO3, 99%), strontium nitrate (Sr(NO3)2, ≥99%), isopropanol (C3H8O, ≥99.5%), sodium nitrate (NaNO3, ≥99%), calcium nitrate tetrahydrate (Ca(NO3)2·4H2O, 99%), magnesium nitrate hexahydrate (Mg(NO3)3·6H2O, 99%), aluminium nitrate nonahydrate (Al(NO3)3·9H2O, ≥98%), manganese nitrate tetrahydrate (Mn(NO3)2·4H2O, ≥97%), and Triton X-100. For safety, non-radioactive cesium and strontium nitrates were used as substitutes for radioactive isotopes. Ultrapure Milli-Q water (distilled water, DW) with a resistivity of 18.2 MΩ was used in all experiments.2.2 Preparation of sodium titanates
Sodium titanates were synthesized using a modification of a previous method.26 First, 12 mmol of titanium isopropoxide, 6 mmol of sodium methoxide, 0.88 mL of Triton X-100, and 0.48 mL of DW were mixed, then isopropanol was added to bring the volume to 300 mL; this step was performed in a 500 mL three-neck round-bottom flask. After the chemicals had been mixed, the flask was sealed and stirred at room temperature (RT) for 24 h, then heated at 82 °C for 90 min, then purged with nitrogen until the total volume of solution reached 50 mL. While the isopropanol was evaporated, DW was simultaneously added dropwise to the flask. After heat reduction, the solution in the flask became a slurry of sodium titanate. This aqueous slurry was centrifuged, then the supernatant was removed. The remaining product was treated in two ways. First, adsorbent ST1 was obtained by washing the remaining sodium titanates three times with DW to remove any surfactant and any remaining isopropanol. Second, adsorbent ST2 was obtained by drying the remaining sodium titanates at 100 °C overnight in an oven to remove remaining aquatic residues without DW washing. Both ST1 and ST2 were stored in an oven at 60 °C until they were used in experiments.2.3 Characterization of sodium titanates
The chemical composition of sodium titanates was analyzed using an X-ray diffractometer (XRD: X'pert PRO MPD, Malvern PANalytical B.V., Almelo, Netherlands). Surface structure of sodium titanates was observed using a scanning electron microscope (SEM: JSM-6510, JEOL Co., Ltd, Tokyo, Japan) and an energy-dispersive X-ray spectroscopy (EDS: Emax, Horiba, UK). Physical adsorption capacities and surface area of gas molecules on the surface of sodium titanates were quantified using a Brunauer–Emmett–Teller (BET) surface analysis device (Nanoporosity-XQ analyzer, Mirae SI Co., Ltd, Gwangju, Korea). BET surface area and pore size distribution were quantified using the Barrett–Joyner–Halenda (BJH) equation to draw an isothermal adsorption line.27,28 The strontium adsorption mechanism of sodium titanates was analyzed using an X-ray photoelectron spectroscope (XPS: ESCALAB 250, Thermo Fisher Scientific, Waltham, U.S.).2.4 Cesium and strontium adsorption experiments
To determine their capacities to adsorb strontium and cesium by ST1 and ST2, 0.1 g of ST1 or 0.1 g of ST2 were added to Pyrex bottles containing 100 mL solutions of 1.14 mM (100 mg L−1) strontium and 0.75 mM (100 mg L−1) cesium with initial pH value 7. Each bottle was sealed then stirred in a shaking incubator (VS-8480SF, Vision Science Co., Ltd, Daegu, Korea) with mixing at 200 rpm and temperature of 25 °C. Samples were collected at 10 min, 30 min, 1 h, 3 h, 6 h, 9 h, and 24 h from each bottle, then strontium and cesium concentrations were determined according to standard methods using an inductively coupled plasma-mass spectrometer (ICP-MS: ELAN DRC-e, PerkinElmer SCIEX, Wellesley, U.S.).In addition, the competitive adsorption ability of ST2 for cesium, strontium, and metal cations (Al3+, Mg2+, Ca2+, and Mn2+) were investigated in a batch test. 0.1 g of ST2 was added to four Pyrex bottles with experimental solution (100 mg L−1 concentration of Al3+ or Mg2+ or Ca2+ or Mn2+ with 100 mg L−1 Sr and Cs, respectively) with pH value 7 were prepared. Each bottle was sealed then stirred in a shaking incubator with mixing at 200 rpm and temperature of 25 °C. Samples were collected after 24 h from each bottles and the concentration of Sr, Cs was determined by ICP-MS as described above.
Finally, to examine whether ST2 can be used as a specific strontium adsorbent in the presence of cesium, the strontium adsorption capacity (mg g−1) by ST2 was measured for 48 h using aqueous solution that had initial concentrations of 1 ≤ Sr and Cs ≤ 5 mM (87.72 mg L−1 ≤ Sr ≤ 438.60 mg L−1, 133.33 mg L−1 ≤ Cs ≤ 666.67 mg L−1, respectively). Experimental method was same with the batch test as discussed above with differences of concentration and time. The above experimental conditions remained unchanged during the experiment.
2.5 Kinetics and isotherms
The adsorption equilibrium capacity qe [mg g−1] was calculated as
 | (1) |
The kinetics of experimental data were fitted using a pseudo-first-order equation,
ln(qe − qt) = ln![[thin space (1/6-em)]](https://www.rsc.org/images/entities/char_2009.gif) qe − k1t qe − k1t
| (2) |
 | (3) |
 | (4) |
To calculate strontium adsorption isotherms by ST2, the data were fitted with the Langmuir equation,
 | (5) |
| qe = KfC1/ne | (6) |
| qe = qme−βε2 | (7) |
 | (8) |
![[thin space (1/6-em)]](https://www.rsc.org/images/entities/char_2009.gif) ln(1 + 1/Ce) is the Polanyi potential, bT is the Temkin isotherm constant related to adsorbent–adsorbate interactions, AT [L g−1] is the Temkin isotherm equilibrium binding constant, R = 8.314 [J mol−1 K−1] is the universal gas constant, T = 298 K is reaction temperature, and B = RT/bT [J mol−1] is a constant related to the heat of sorption.32–35 Originpro software (version 9.0) was used to draw figures and to fit kinetics and isotherm curves by nonlinear regression methods.
ln(1 + 1/Ce) is the Polanyi potential, bT is the Temkin isotherm constant related to adsorbent–adsorbate interactions, AT [L g−1] is the Temkin isotherm equilibrium binding constant, R = 8.314 [J mol−1 K−1] is the universal gas constant, T = 298 K is reaction temperature, and B = RT/bT [J mol−1] is a constant related to the heat of sorption.32–35 Originpro software (version 9.0) was used to draw figures and to fit kinetics and isotherm curves by nonlinear regression methods.
3 Results & discussion
3.1 Characteristics of sodium titanates
ST1 and ST2 were aggregated solid form of amorphous phases without any crystalline structure (Fig. 1); this result agrees with previous reports.36,37 The EDS spectra indicated that both ST1 and ST2 include only Na, Ti, and O. The amount of Na was smaller in ST1 than in ST2. Sodium titanates can easily hydrolysed as reaction (9), so ST1, which was synthesized using a process that involved DW washing, may have been more hydrolysed than ST2, and therefore had less Na content than ST2.38| NaxTiyOz + xH2O → HxTiyOz + xNa+ + xOH− | (9) |
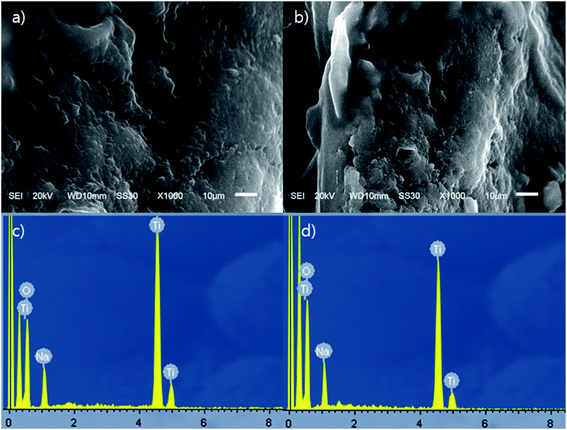 | ||
| Fig. 1 SEM pictures and EDS profile data of ST1 and ST2; (a) SEM picture of ST1, (b) SEM picture of ST2, (c) EDS profile of ST1, and (d) EDS profile of ST2. | ||
The chemical compositions of the ST1 and ST2 (Na0.28H1.72TiO3 and Na0.56H1.44TiO3, respectively.) in this study were estimated to be NaxH(2−x)TiO3, as suggested by the ideal chemical composition of perovskite (CaTiO3).38 TiO3 seemed to combine with one of Na or H.
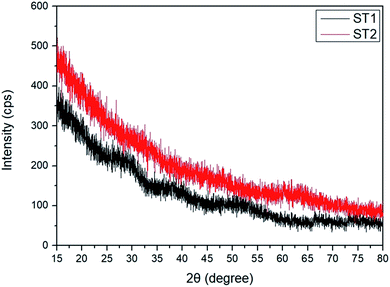
XRD spectra showed no distinguishable peaks in further investigation to determine the crystal structures of ST1 and ST2 (Fig. 2); this result illustrates that both ST1 and ST2 had amorphous phase in RT condition.
To investigate the availability of Sr and Cs adsorption by ST1 and ST2, BET analysis was conducted with BJH method for determining surface area, adsorption/desorption area, and mean pore diameter of ST1 and ST2. BET surface area (m2 g−1) of ST1 was 24.36 and ST2 was 244.17. BJH adsorption/desorption area (m2 g−1) of ST1 was 16.54/21.78 and ST2 was 44.31/47.59. BJH mean pore diameter (nm) of ST1 was 439.1 and ST2 was 1034.4. Compared to ST1, ST2 had 10.0 times higher BET surface area, 2.1–2.6 times higher BJH adsorption/desorption area, and 2.3 times higher BJH mean pore diameter. This result may be a result of a conversion of sodium titanate to hydrogen titanate, which is described in reaction (9). DW evaporation during ST2 synthesis process also contributed to increase in surface area and pore size, and thereby facilitate the growth of sodium titanate particles when the remaining sodium titanate was supersaturated in the slurry.39
3.2 Cesium and strontium adsorption
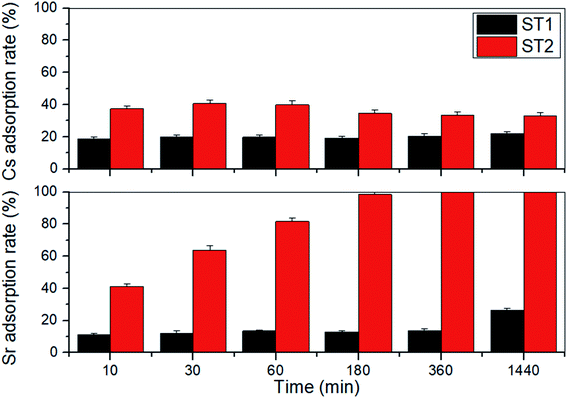
Adsorption rate of Sr and Cs by ST1 and ST2 from aqueous solution containing 1.14 mM (100 mg L−1) Sr and 0.75 mM (100 mg L−1) Cs was examined (Fig. 3). The amounts of Sr and Cs adsorbed onto ST1 and ST2 increased as adsorption time increased to 24 h.On ST1, the adsorption rate of Sr increased from 11.45% to 26.35% with 0.84 mM (73.65 mg L−1) Sr equilibrium concentration, and the adsorption rate of Cs increased from 18.87% to 21.93% with 0.59 mM (78.07 mg L−1) Cs equilibrium concentration. After 24 h, the difference was not large.
On ST2, the adsorption rate of Sr significantly increased from 41.24% to 99.86% with 0.16 mM (0.14 mg L−1) Sr equilibrium concentration, and the adsorption rate of Cs increased from 32.91% to 40.67% with 0.44 mM (59.33 mg L−1) Cs equilibrium concentration. The Sr adsorption rate was 2.5 times higher than the Cs adsorption rate (Fig. 3). A difference in adsorption rates of Sr and Cs has been reported earlier using sodium iron titanate composites.25
The difference of Cs, Sr adsorption rate between ST1 and ST2 can be explained that ST2 occupies larger surface area, larger mean pore diameter, and higher Na content than ST2. The ionic affinity during adsorption by sodium titanate was in the order H+ > Ca2+ > Sr2+ ≫ Mg2+ > NH4+ > K+ > Li+.40 Therefore, ST1, which underwent DW washing that was converted HxTiyOz instead of NaxTiyOz, contained more H content than ST2, resulting less adsorption rate of both Cs, Sr.
Sodium titanates have greater adsorption capacity for divalent and trivalent cations such as Sr, Np, Pu, and U than for monovalent cations such as Cs, which is normally monovalent in water.20,37,41 However, in this trial, the amount of Sr adsorbed by sodium titanates was much higher than the amount of Cs (Fig. 3). This difference from expectation may be a result of the difference in ionic radii. Sr (125 pm) is much smaller than Cs (173 pm); this difference indicates that more Sr can be adsorbed than Cs in certain areas on sodium titanates.42
ST2 showed better capacity than ST1 to adsorb Sr and Cs, so ST2 was used in a test of the influence of metal cations (Al3+, Mg2+, Ca2+, and Mn2+) on Sr and Cs adsorption in a batch test (Fig. 4). Interference with Sr adsorption capacity was relatively high (10–40%) in the presence of each co-existing cation, but interference with Cs adsorption was relatively low (<10%). Ca2+ interfered strongly with Sr adsorption, possibly as a result of the ionic radii of the cations.43 The ionic radii are 110 pm (Ca2+), 57 pm (Al3+), 86 pm (Mg2+), and 81 pm (Mn2+); the difference in ionic radii of Sr2+ (125 pm) may not be high enough to prevent interference by Ca2+. However, Cs+ (173 pm) has larger ionic radii than Sr2+; this seemed to be less affected by co-existing cations.43–47
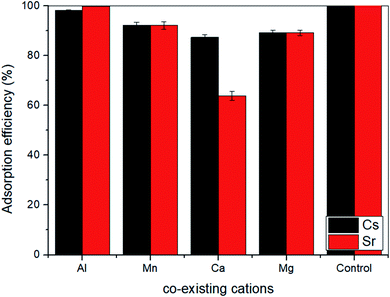 | ||
| Fig. 4 Effect of co-existable cations on the adsorption of Cs and Sr by ST2 (control condition: 40.67% adsorption rate of Cs and 99.86% adsorption rate of Sr in 100 ppm Cs, Sr concentration). | ||
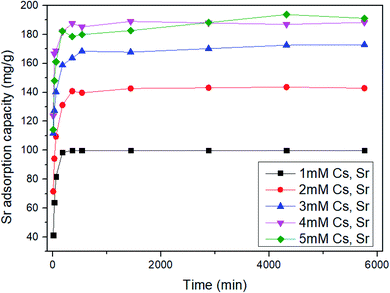
To examine whether ST2 can be used as a specific Sr adsorbent in the presence of Cs, the Sr adsorption capacity by ST2 was quantified using aqueous solution with initial pH value 7 that had initial concentrations of 1 ≤ Cs and Sr ≤ 5 mM (Fig. 5). All Sr adsorption capacities of ST2 increased as time increased, and reached equilibrium at 96 h. The adsorption capacities of Sr at equilibrium by ST2 increased from 99.86 to 193.76 mg g−1 as the initial Cs and Sr concentrations increased from 1 to 5 mM. Although Sr competed with Cs for Na from ST2 during ion-exchange process, the Sr adsorption capacity obtained from adsorption experiments was higher than that in previous other studies that used aqueous solution that contained only Sr.10,25,43,46
3.3 Kinetics and isotherm
To understand the mechanism of Sr adsorption by ST2 equilibrium data, pseudo-first order, pseudo-second order, and Elovich kinetic models were fitted using non-linear regression analysis (Fig. 6) and kinetic parameters were obtained (Table 1). Among the kinetic models, the correlation coefficients from the pseudo-second kinetic model were the highest for 1 ≤ Cs and Sr ≤ 5 mM; this result indicates that the pseudo-second kinetic model showed the best fit to the experimental data. This kinetic model provides information on the Sr adsorption mechanism, which entails a fast initial step that is limited by general diffusion, then a slow second step that is limited by diffusion in small pores or by slow adsorption.25,48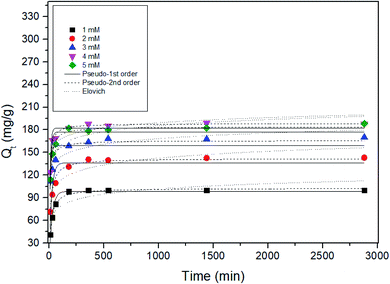 | ||
| Fig. 6 Non-linear adsorption kinetics for the adsorption of Sr by ST2 at different initial Cs, Sr concentrations. | ||
| Initial conc. (mM) | qe,exp (mg g−1) | Pseudo-first order | Pseudo-second order | Elovich | ||||||
|---|---|---|---|---|---|---|---|---|---|---|
| qe,cal (mg g−1) | k1 (min−1) | r2 | qe,cal (mg g−1) | k2 (g mg−1 min−1) | r2 | α (g (mg min2)−1) | β (g (mg min)−1) | r2 | ||
| 1.000 | 99.864 | 98.644 | 0.038 | 0.944 | 102.694 | 0.001 | 0.986 | 244.873 | 0.099 | 0.745 |
| 2.000 | 142.911 | 136.326 | 0.046 | 0.774 | 142.096 | 0.001 | 0.956 | 726.620 | 0.077 | 0.859 |
| 3.000 | 172.943 | 158.856 | 0.102 | 0.542 | 165.744 | 0.001 | 0.884 | 6.708 × 10⁴ | 0.093 | 0.883 |
| 4.000 | 188.991 | 182.445 | 0.108 | 0.872 | 188.288 | 0.001 | 0.979 | 2.835 × 10⁶ | 0.103 | 0.687 |
| 5.000 | 197.757 | 177.274 | 0.089 | 0.788 | 184.012 | 0.001 | 0.975 | 9.893 × 10⁴ | 0.086 | 0.777 |
To determine the mechanism of Sr adsorption onto ST2, Langmuir, Freundlich, Dubinin–Radushkevich, and Tempkin adsorption isotherm models were applied (Fig. 7). The isotherm parameters showed that the equilibrium data were fitted best by the Langmuir isotherm (Table 2). The Langmuir isotherm suggests that Sr adsorption onto a solid surface seemed to entail a kinetic principle which is a continuous bombardment process of molecules onto the surface, with corresponding molecules' desorption or evaporation from the surface, with zero net accumulation rate at the surface.32 ST2 is amorphous, so Sr adsorption by ST2 could follow the generalized Langmuir adsorption model, in which an amorphous material that is treated as a continuum consists of an intractable number of adsorption sites with various adsorbate affinities. Adsorbate–adsorbent interactions are negligible, so the adsorption isotherm follows the binding energy distribution of adsorption sites.49
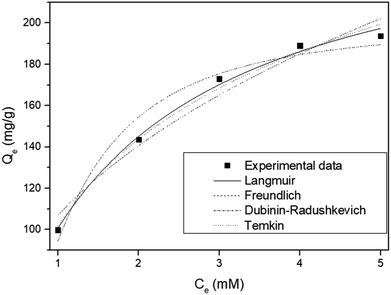 | ||
| Fig. 7 Non-linear adsorption isotherm models for strontium by ST2 at different concentration at equilibrium. | ||
| Langmuir | Freundlich | Dubinin–Radushkevich | Temkin | ||||
|---|---|---|---|---|---|---|---|
| KL | 0.633 | Kf | 106.880 | qm | 199.564 | AT | 5.326 |
| qm | 259.730 | n | 2.526 | B | 1.557 | bT | 37.348 |
| r2 | 0.993 | r2 | 0.955 | r2 | 0.958 | r2 | 0.985 |
The maximum Sr adsorption capacity obtained by Langmuir isotherm model was compared with other synthetic adsorbents that were reported for candidates of Sr adsorption.10,25,43,50 ST2 has the highest Sr adsorption capacity among synthetic adsorbents that include sodium titanate species under the condition that Sr and Cs co-exist in aqueous solution, while other studies were conducted using aqueous solution that contains only Sr (Table 3).
| Materials | Compositions | Maximum Sr adsorption capacity (mg g−1) | Solution condition | Ref. |
|---|---|---|---|---|
| RSBC beads | Rice straw-based biochar | 175.95 | Sr only | 43 |
| Barium-sulfate-impregnated reduced graphene oxide | BaSO4·rGO | 232.89 | Sr only | 10 |
| Sodium iron titanate | NaFeTiO | 233.5 | Sr only | 25 |
| Sodium titanate | Na0.90H1.10Ti2O5 | 238.26 | Sr only | 50 |
| Sodium titanate | Na0.56H1.44TiO3 | 259.73 | Cs, Sr | This work |
3.4 Suggested mechanism of Sr adsorption on ST2
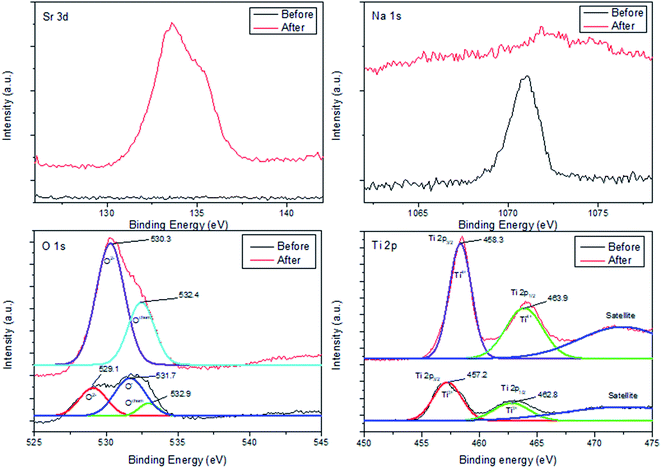
To elucidate chemical balance state and surface chemistry of Sr adsorption on ST2, XPS was conducted to identify surface chemical composition and bonding configuration of ST2 before and after Sr adsorption (Fig. 8).The XPS spectrum of Sr 3d had no distinctive peaks before Sr adsorption, but showed a distinctive peak at binding energy of 133.6 eV after Sr adsorption. This result illustrates that Sr ions had been adsorbed onto ST2.
In contrast, the XPS spectrum of Na 1s showed a distinctive peak at 1071.1 eV before Sr adsorption, but no distinctive peaks after Sr adsorption. This result indicates that Na ions had been released from ST2. This observation is consistent with a previous inference that ion exchange between Sr and Na ions occurs on the surface of ST2.51
In the XPS spectrum of O 1s, a binding energy peak appeared at 531.7 eV with a shoulder peak at 529.1 eV before Sr adsorption; this peak can be deconvoluted to three single peaks, which correspond to the “O2−” ions (529.1 eV) in transition metal oxides and alkaline-earth oxides, “O−” ions (531.7 eV) that compensate for deficiencies in the subsurface of transition metal oxides (oxygen vacancy), and Ochem (532.9 eV) ions that are chemically adsorbed to the surface of metal oxides.52–54 After Sr adsorption, the XPS spectrum of O 1s showed a distinct peak at 530.2 eV, which is attributed to O2− ions and a peak at 532.4 eV attributed to Ochem; this result implies that O− ions had been converted to O2− ions and that O2− ions dominated on the surface of ST2.
The XPS spectrum of Ti 2p before Sr adsorption was fitted as three peaks: 457.2 eV for Ti 2p3/2 of Ti3+, 462.8 eV for Ti 2p1/2 of Ti3+, and some satellites. After Sr adsorption, the spectrum showed different peaks: 458.3 eV for Ti 2p3/2 of Ti4+, 463.9 eV for Ti 2p1/2 of Ti4+, and some satellites.55 These results indicate that Ti ions on the surface of ST2 underwent reduction reactions during Sr adsorption.
The XPS results suggest that Sr adsorption mechanism onto ST2 as follows: Before Sr adsorption, Na ions existed in Na0.56H1.44TiO3 complex which contains Ti3+ ions chemically bonded with “O−” ion and Ochem at the surface. When Sr adsorption began, Sr ions from the aqueous solution were located in surface of ST2 instead of Na ions via ion-exchange process, then Sr forms the crystalline substances by surface precipitation, resulting in the presence of Ti4+-based metal oxides by oxidation of Ti3+ on the surface of ST2 (Scheme 1). This ion-exchange model between Na and Sr was observed in other studies of Sr adsorption using titanate nanorods and mats.50,56 SEM observations of ST2 after Sr adsorption detected cube-shaped crystals which are quite similar in shape to SrTiO3 crystals as an evidence for Sr adsorption on ST2 via surface precipitation.57,58
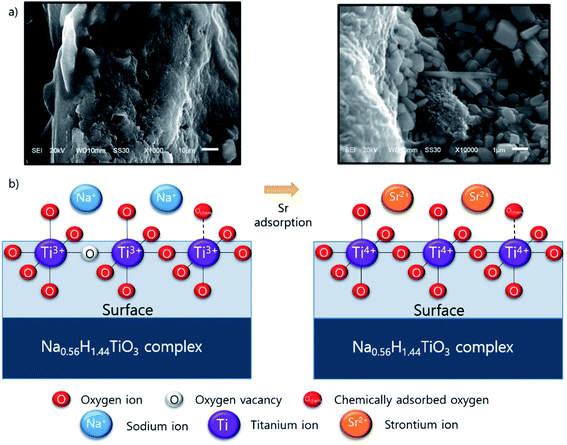 | ||
| Scheme 1 Conceptual illustration of Sr adsorption mechanism onto ST2; (a) SEM picture of ST2 surface and after Sr adsorption, (b) possible mechanism of Sr adsorption onto ST2. | ||
4 Conclusions
Sodium titanate ST2 (Na0.56H1.44TiO3) was synthesized using a modified mid-temperature sol–gel method. ST2 has amorphous structure, high capacity to adsorb Sr, and high selectivity to adsorb Sr even in the presence of Cs and metal cations (Al3+, Mg2+, Ca2+, Mn2+) in aquatic solution with initial pH value 7. Sr adsorption by ST2 in aquatic solution with initial pH value 7 followed pseudo-second-order kinetics and generalized Langmuir isotherm model. Adsorbed Sr ions onto ST2 involved formation of a strontium titanate structure (SrTiO3) with titanate frame of ST2 by surface precipitation. However, a comprehensive study including pH, background electrolyte change and binary systems containing only the competing ions is required for understanding surface complexation model of Sr in ST2. Moreover, further investigations about Sr adsorption on ST2 are still needed to solve the detailed mechanism of Ti3+ oxidation. In summary, ST2 can be a good candidate for use to adsorb Sr from Cs-containing aqueous solutions.Author contributions
H. E. conceived the experiments and G. K. performed the experiments. G. K., S. M. K. and H. U. C. analyzed the data. G. K. and H. U. C. wrote the manuscript. D. S. L. reviewed the manuscript. J. M. P. revised the manuscript. All authors have read and agreed to the published version of the manuscript.Conflicts of interest
There are no conflicts to declare.Acknowledgements
This work was supported by the National Research Foundation of Korea (NRF) grant funded by the Korea government (MSIT) (No. 2021R1G1A1095424). This research was also supported by an NRF grant from the Korean government (MSIP) (NRF-2015M2A7A1000194).References
- D. Yang, S. Sarina, H. Zhu, H. Liu, Z. Zheng, M. Xie, S. V. Smith and S. Komarneni, Angew. Chem., Int. Ed., 2011, 50, 10594–10598 CrossRef CAS PubMed.
- L. Nilsson and E. Forssberg, Miner. Eng., 1988, 1, 295–310 CrossRef CAS.
- O. Roth, D. Cui, C. Askeljung, A. Puranen, L. Z. Evins and K. Spahiu, J. Nucl. Mater., 2019, 527, 151789 CrossRef.
- T. Y. Kong, S. Kim, Y. Lee, J. K. Son and S. J. Maeng, Nucl. Eng. Technol., 2017, 49, 1772–1777 CrossRef CAS.
- A. R. Lang, D. L. Engelberg, C. Walther, M. Weiss, H. Bosco, A. Jenkins, F. R. Livens and G. T. W. Law, ACS Omega, 2019, 4, 14420–14429 CrossRef CAS PubMed.
- N. Casacuberta, P. Masqué, J. Garcia-Orellana, R. Garcia-Tenorio and K. O. Buesseler, Biogeosciences, 2013, 10, 3649–3659 CrossRef.
- N. R. Council, Groundwater and Soil Cleanup: Improving Management of Persistent Contaminants, The National Academies Press, Washington, DC, 1999 Search PubMed.
- P. Misaelides, in Water Treatment Technologies for the Removal of High-Toxicity Pollutants, ed. M. Václavíková, K. Vitale, G. P. Gallios and L. Ivaničová, Springer Netherlands, Dordrecht, 2010, pp. 183–191 Search PubMed.
- M. A. Olatunji, M. U. Khandaker, H. N. M. E. Mahmud and Y. M. Amin, RSC Adv., 2015, 5, 71658–71683 RSC.
- J. Jang and D. S. Lee, J. Nucl. Mater., 2018, 504, 206–214 CrossRef CAS.
- P. P. Povinec, K. Hirose and M. Aoyama, Environ. Sci. Technol., 2012, 46, 10356–10363 CrossRef CAS PubMed.
- Waste Technology Section International Atomic Energy Agency, Combined methods for liquid radioactive waste treatment Final report of a co-ordinated research project 1997–2001, Vienna, 2003, vol. 1336 Search PubMed.
- K. C. Khulbe and T. Matsuura, Appl. Water Sci., 2018, 8, 1–30 CrossRef CAS.
- M. W. Munthali, E. Johan, H. Aono and N. Matsue, J. Asian Ceram. Soc., 2015, 3, 245–250 CrossRef.
- S. Baik, H. Zhang, Y. K. Kim, D. Harbottle and J. W. Lee, RSC Adv., 2017, 7, 54546–54553 RSC.
- Y. Park, C. Kim, W. S. Shin and S.-J. Choi, J. Nucl. Fuel Cycle Waste Technol., 2013, 11, 259–269 CrossRef.
- S. S. Metwally, I. M. Ahmed and H. E. Rizk, J. Alloys Compd., 2017, 709, 438–444 CrossRef CAS.
- A. Clearfield and J. Lehto, J. Solid State Chem., 1988, 73, 98–106 CrossRef CAS.
- R. W. Lynch, R. G. Dosch, B. T. Kenna, J. K. Johnstone and E. J. Nowak, in Symposium on the management of radioactive wastes from the nuclear fuel cycle, International Atomic Energy Agency, Vienna, 1976, pp. 361–372 Search PubMed.
- M. C. Duff, D. B. Hunter, D. T. Hobbs, S. D. Fink, Z. Dai and J. P. Bradley, J. Environ. Sci. Technol., 2004, 38, 5201–5207 CrossRef CAS PubMed.
- J. Lehto and A. Clearfield, J. Radioanal. Nucl. Chem. Lett., 1987, 118, 1–13 CrossRef CAS.
- D. T. Hobbs, J. South Carolina Acad. Sci., 2011, 9, 20 Search PubMed.
- K. M. L. Taylor-Pashow, D. M. Missimer, A. Jurgensen and D. T. Hobbs, Sep. Sci. Technol., 2011, 46, 1087–1097 CrossRef CAS.
- M. Nyman and D. T. Hobbs, Chem. Mater., 2006, 18, 6425–6435 CrossRef CAS.
- P. Amesh, A. S. Suneesh, K. A. Venkatesan, R. Uma Maheswari and S. Vijayalakshmi, Sep. Purif. Technol., 2020, 238, 116393 CrossRef CAS.
- D. T. Hobbs, K. M. L. Taylor-Pashow and M. C. Elvington, US Pat., US20140072804A1, 2014, vol. 1, p. 33 Search PubMed.
- S. Brunauer, P. H. Emmett and E. Teller, J. Am. Chem. Soc., 1938, 60, 309–319 CrossRef CAS.
- E. P. Barrett, L. G. Joyner and P. P. Halenda, J. Am. Chem. Soc., 1951, 73, 373–380 CrossRef CAS.
- M. P. Tavlieva, S. D. Genieva, V. G. Georgieva and L. T. Vlaev, J. Colloid Interface Sci., 2013, 409, 112–122 CrossRef CAS PubMed.
- Y. S. Ho and G. McKay, Process Biochem., 1999, 34, 451–465 CrossRef CAS.
- S. Roginsky and Y. B. Zeldovich, Acta Phys. Chem. USSR, 1934, 1, 2019 Search PubMed.
- I. Langmuir, J. Am. Chem. Soc., 1918, 40, 1361–1403 CrossRef CAS.
- H. M. F. Freundlich, J. Phys. Chem., 1906, 57, 1100–1107 Search PubMed.
- A. Khandelwal, N. Narayanan, E. Varghese and S. Gupta, Bull. Environ. Contam. Toxicol., 2020, 104, 503–510 CrossRef CAS PubMed.
- M. M. Dubinin, E. D. Zaverina and L. V. Radushkevich, Zh. Fiz. Khim., 1947, 21, 151–162 Search PubMed.
- W. Zhang, R. Fu, L. Wang, J. Zhu, J. Feng and W. Yan, Sci. Total Environ., 2019, 668, 815–824 CrossRef CAS PubMed.
- F. F. Fondeur, D. T. Hobbs, S. D. Fink and M. J. Barnes, Sep. Sci. Technol., 2005, 40, 571–592 CrossRef CAS.
- Y. Takahatake, A. Shibata, K. Nomura and T. Sato, Minerals, 2017, 7, 247–260 CrossRef.
- A. Yoshida and R. Komatsu, J. Ceram. Soc. Jpn., 2009, 117, 1166–1171 CrossRef CAS.
- J. Lehto, L. Brodkin, R. Harjula and E. Tusa, in Proceedings of the Sixth International Conference on Radioactive Waste Management and Environmental Remediation, 1997, pp. 245–248 Search PubMed.
- D. T. Hobbs, M. J. Barnes, R. L. Pulmano, K. M. Marshall, T. B. Edwards, M. G. Bronikowski and S. D. Fink, Sep. Sci. Technol., 2005, 40, 3093–3111 CrossRef CAS.
- J. Luo, S. Ye, T. Li, E. Sarnello, H. Li and T. Liu, J. Phys. Chem. C, 2019, 123, 14825–14833 CrossRef CAS.
- J. Jang, W. Mirana, S. D. Divine, M. Nawaz, A. Shahzad, S. H. Woo and D. S. Lee, Sci. Total Environ., 2018, 615, 698–707 CrossRef CAS PubMed.
- L. Ćurković, M. Fudurić and S. Kurajica, in 1st International Conference Corrosion and Material Protection, 2007 Search PubMed.
- A. K. Vashishtha, J. Wang and W. H. Konigsberg, J. Biol. Chem., 2016, 291, 20869–20875 CrossRef CAS PubMed.
- P. Amesh, K. A. Venkatesan, A. S. Suneesh and U. Maheswari, Sep. Purif. Technol., 2021, 267, 118678 CrossRef CAS.
- J. Lehto, L. Brodkin, R. Harjula and E. Tusa, Nucl. Technol., 1999, 127, 81–87 CrossRef CAS.
- J. P. Simonin, Chem. Eng. J., 2016, 300, 254–263 CrossRef CAS.
- M. A. Al-Ghouti and D. A. Da'ana, J. Hazard. Mater., 2020, 393, 122383 CrossRef CAS PubMed.
- Y. Kondo, T. Goto and T. Sekino, RSC Adv., 2021, 11, 18676–18684 RSC.
- R. Yi, G. Ye and J. Chen, RSC Adv., 2019, 9, 27242–27249 RSC.
- J. C. Dupin, D. Gonbeau, P. Vinatier and A. Levasseur, Phys. Chem. Chem. Phys., 2000, 2, 1319–1324 RSC.
- L. Q. Wu, Y. C. Li, S. Q. Li, Z. Z. Li, G. D. Tang, W. H. Qi, L. C. Xue, X. S. Ge and L. L. Ding, AIP Adv., 2015, 5, 097210 CrossRef.
- F. M. Chang, S. Brahma, J. H. Huang, Z. Z. Wu and K. Y. Lo, Sci. Rep., 2019, 9, 1–9 CrossRef CAS PubMed.
- V. V. Atuchin, V. G. Kesler, N. V. Pervukhina and Z. Zhang, J. Electron Spectrosc. Relat. Phenom., 2006, 152, 18–24 CrossRef CAS.
- J. Ryu, S. Kim, H. J. Hong, J. Hong, M. Kim, T. Ryu, I. S. Park, K. S. Chung, J. S. Jang and B. G. Kim, Chem. Eng. J., 2016, 304, 503–510 CrossRef CAS.
- B. Wang, S. Shen and L. Guo, Appl. Catal., B, 2015, 166–167, 320–326 CrossRef CAS.
- X. Huang, H. Liu, S. Zhang, G. Li, H. Hao, M. Cao, Z. Yao and J. Xie, J. Mater. Sci.: Mater. Electron., 2018, 29, 11546–11552 CrossRef CAS.
| This journal is © The Royal Society of Chemistry 2022 |

