 Open Access Article
Green innovative fluorescence approach for the feasible and reliable assay of thiol-containing drugs; captopril as a model†
Sayed M. Derayea a,
Dalia M. Nagya,
Khalid M. Badr El-Dina,
Tamer Z. Attia
 a,
Ebtihal Samirb,
Abobakr A. Mohamed
 c and
Ahmed A. Hamad
 *d
*d
aAnalytical Chemistry Department, Faculty of Pharmacy, Minia University, 61519-Minia, Egypt
bAnalytical Chemistry Department, Faculty of Pharmacy, Deraya University, New-Minia, 61519-Minia, Egypt
cPharmaceutical Analytical Chemistry Department, Faculty of Pharmacy, Fayoum University, Fayoum, Egypt
dPharmaceutical Analytical Chemistry Department, Faculty of Pharmacy, Al-Azhar University, Assiut Branch, Assiut 71524, Egypt. E-mail: ahmedabdelhafez@azhar.edu.eg
First published on 14th June 2022
Abstract
In the present study, a novel spectrofluorimetric approach was designed for the analysis of captopril as a thiol-containing compound. The approach is based on the formation of a ternary fluorescent compound between the target thiol compound, ortho-phthaldehyde, and a suitable primary amine-containing compound. The produced 1-thio-alkyl-isoindole derivative exhibited very high emission activity in a faintly alkaline aqueous solution that could be monitored at 448 nm (excitation at 334 nm). 2-Amino-6-methyl-6-hydroxy-heptane was selected as the primary amine candidate that gave the high fluorescence intensity with the stability of the formed product. At the optimal experimental condition, the intensity of fluorescence of the formed product was linearly related to the concentration of captopril in 20–450 ng mL−1 range. Commercial pharmaceutical tablets were analyzed, and the obtained results agreed with those of the published method regarding precision and accuracy. The mechanism of the reaction was discussed. In addition, the greenness of the approach was rated following eco-scale criteria.
1. Introduction
Captopril (CP, Fig. 1) is an angiotensin-converting enzyme inhibitor that is used mainly in the treatment of hypertension.1 It is an aliphatic compound that contains thiol, amide, and carboxylic groups. This compound does not exhibit any luminescent activity, and hence it could not be easily determined by direct spectrophotometric or spectrofluorimetric measurements. Thus, numerous chemical derivatization reactions were reported for its quantitative analysis.2–6Owing to the high therapeutic importance of this compound, many methods were reported for its analysis. The most commonly used methods were chromatographic methods, including HPLC-UV7–14 and HPLC-MS,15 flow injection,16–20 and electrochemical methods such as amperometry,21 potentiometry,22,23 and voltammetry.24–34 However, a few spectroscopic methods were also reported, including spectrophotometry,2–5 spectrofluorimetry,6 atomic absorption spectroscopy,35 and FT-Raman spectroscopy.36 Other minor techniques for CP analysis were chemiluminescence,37,38 and capillary electrophoresis.39
It is well-documented that HPLC methods consume large quantities of highly purified organic solvents, which raises costs and causes environmental hazards. In addition, both HPLC and electrochemical instruments are complex and require high experience for their use. Moreover, the reported spectrophotometric methods utilized indirect approaches, in addition to their low sensitivity. On the contrary, the spectrofluorimetric methods are considered easy, and the instrument used is simple and do not require much experience in their use. It also has high sensitivity and low cost if the involved reagents are cheap.
Orthophtaldehyde (OPA) is a widely used reagent for detecting primary amine-containing compounds because it rapidly reacts to form a highly fluorescent product. The reaction proceeded at room temperature, and the excess reagent is not liable for degradation into fluorescent by-products.
Initially, in 1971 Roch40 noticed that the reaction of OPA with amino acids gave highly fluorescent products if 2-mercaptoethanol (2-ME) is present in the reaction vessel. He assumed that 2-ME acts simply as a reducing agent. Later on, Simons and Johnson41 proved that the 2-ME does not act as a reducing agent, but it actually is incorporated in the chemical reaction. Indeed, these two authors proved that the final products were L-alkylthio-2-alkyl-substituted isoindole derivatives. This result was further confirmed by work of Simpson et al.42 Since that time, OPA in the presence of thiols, specially 2-ME, has been extensively used for the determination of primary amines. This reaction was previously employed for the determination of some thiol compounds using HPLC methods.43–45 However, such reactions were not utilized for the spectrofluorimetric analysis of thiol compounds itself, although it is a crucial element for developing the ternary fluorescent derivative. Thus, the aim of the present study is to utilize this reaction to construct a fluorimetric protocol with high sensitivity for the determination of CP as a thiol-containing compound and to apply the developed procedure for the analysis of commercial tablets that contain the cited analyte. In addition, the mechanistic hypothesis that lies behind the observed practical data was discussed.
2. Experimental
2.1. Instruments
The instrument used to measure fluorescence is the PerkinElmer LS 45 Luminescence Spectrometer, which is provided with a 1-cm quartz cell. The light source is a 150 W Xenon arc lamp. A 10 nm bandwidth was used for both excitation and fluorescence. The instrument is fully controlled by FL WINLABTM software.2.2. Reagents and chemicals
Ortho-phthalaldehyde was bought from Loba Chemie, Pvt. Ltd. (Mumbai, India) and was constituted in methanol as 0.01% w/v solution. Heptaminol (6-amino-2-methyl-2-hydroxy-heptane, AMH) was supplied as a gift from Pharco Pharmaceuticals (Amriya, Alexandria, Egypt) and was prepared as 0.02% w/v solution in distilled water. Sodium hydroxide, boric acid, sodium dihydrogen phosphate, methanol, ethanol, acetone, acetonitrile, isopropyl alcohol, and dioxin were purchased from El Nasr Chemicals Company (Cairo, Egypt).2.3. Standard solution
The stock standard solution of CP was prepared by dissolving 25 mg of the drug in 50 mL methanol. Working standard drug solutions were prepared by diluting the suitable aliquots of the stock solution with methanol. The methanolic solution of CP is stable at least for two weeks if stored in the fridge.2.4. General procedure
Aliquots of the working standard solutions containing different concentrations of the drug (0.10–4.50 μg mL−1) were taken into 10 mL volumetric flasks and then 1.0 mL of 0.02% AMH, 1.0 mL of 0.01% OPA and 0.4 mL of 0.05 M sodium hydroxide were added. The solution was diluted to 10 mL with water, and the intensity of the fluorescence was measured at 448 nm (excitation at 334 nm). The obtained fluorescence intensity was corrected by subtracting from it the value of the blank which was performed by using the same previous step skipping the addition of the standard drug solution.2.5. Procedure for the analysis of commercial tablets
Twenty tablets containing CP were weighed and finely powdered. The weight of the powder equivalent to 25 mg of the drug was taken and extracted with methanol by an ultrasound mixer for 15 minutes. After completing the volume to 50 mL with methanol, the mixture was filtered, and the first portion of the filtrate was removed. A specific aliquot of the filtrate was taken, and the content of the drug was determined using the general procedure described before.2.6. Determination of the molar ratio of the reactions
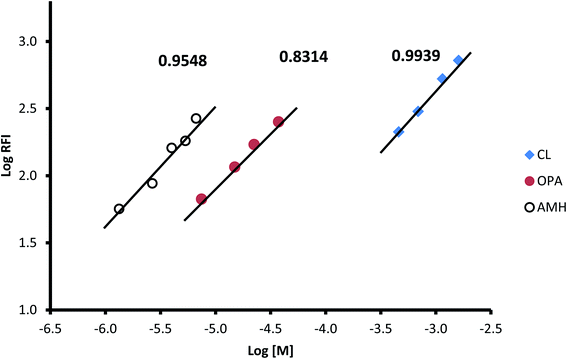
The molar ratio was estimated using the limiting logarithmic method.46 The general recommended procedure was carried out using three different experimental conditions. Initially, the procedure was carried out using varying concentrations of AMH (0.6 × 10⁻² to 1.6 × 10⁻² mol L−1) and constant concentrations of both OPA (7.46 × 10⁻⁵ mol L−1) and CP (1.15 × 10⁻⁶ mol L−1). Then, both AMH (2.75 × 10⁻⁴ mol L−1) and CP (1.15 × 10⁻⁶ mol L−1) were kept constant while the OPA concentration was varied (7.46 × 10⁻⁶ to 2.24 × 10⁻⁵ mol L−1). Finally, the concentration of CP (4.6 × 10⁻⁷ to 1.6 × 10⁻⁶ mol L−1) was changed while AMH and OPA concentrations were fixed. Three plots were constructed between logarithms of the varied concentration and the logarithms of the observed relative fluorescence intensity. The molar ratios were approximated from the values of the slopes of the three linear lines.3. Result and discussion
The interaction of OPA with thiols, specially 2-ME and compounds containing primary amino group, was extensively used to determine primary amine compounds,47–51 including pharmaceutical compounds.52,53 Because of the essential presence of the thiol compound in the reaction vessel, the reaction could be possibly employed for the thiol-containing compound. The reaction medium should be alkaline (0.05 M sodium hydroxide) for the optimal occurrence of the reaction. The developed ternary compound from the interaction could be quantitatively followed through measuring the emission at 448 after excitation at 334 nm. The spectra of the excitation and emission for both the reagent blank and the isoindole produced from the reaction are illustrated in Fig. 2.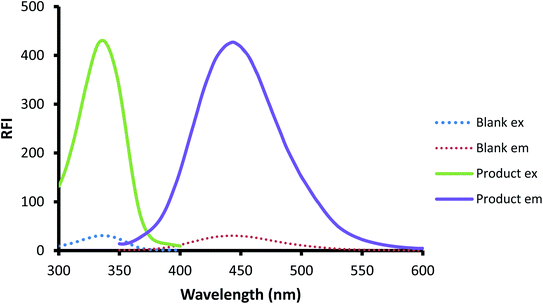 | ||
| Fig. 2 The excitation and emission spectra of the reagent blank and the reaction product of CP (200 ng mL−1) with fluorogenic reagent OPA/AMH. | ||
It is well established that the stability of the isoindole derivative of OPA is dependent on the nature of the moiety attached to the primary amine.54,55 In addition, Jacobs et al.56 concluded that extending the side chain attached to the amine without branching produced a linear increase in the isoindole stability and decreased its decomposition rate. In addition, they observed that the isoindole stability was also increased by introducing branching in the structure of the amine. And the highest degree of stability was reached when the branching location came close to the isoindole ring. The improvement in the stability of the isoindole derivative was suggested to be due to increasing the bulkiness of side chain attached to the amino group; however, this would come with the slowing down in the reaction speed.54 Therefore, the chain should be of reasonable length. In our laboratory, various compounds that contain aliphatic primary amino group such as gabapentin,48 3-isobutyl gamma aminobutyric acid,49 milnacipran,50 and AMH51 were analyzed through the isoindole formation reaction. However, the use of AMH was found to fulfil the aforementioned criteria of being has a side chain of appropriate length (C6) with two points of branching, one of them is close to the amino group. Therefore, AMH was chosen in the present study as the primary amine source for producing the isoindole derivative. It was experimentally observed that without adding the thiol compound to the reaction cocktail, the interaction of AMH and OPA (reagent blank) at room temperature gave very little fluorescence which is close to OPA fluorescence. This could be due to the formation of 1-hydroxy isoindole intermediate that was followed by its slowly conversion to phthalimidine and dimer adduct, having low fluorescence activity57 as shown in Fig. 3. Furthermore, solutions containing only one component of the three reactants exhibited no fluorescence activity in wavelength region from 300 to 500 nm. Definitely, because of their aliphatic structures, both solutions of AMH or CP did not even show any absorption in the region from 250–400 nm. In the case of solutions that contain two components, no absorption or fluorescence bands were noticed in the case of solutions that contain AMH and CP.
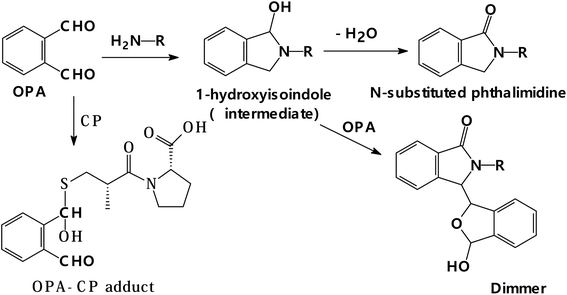 | ||
| Fig. 3 Reaction pathway of OPA with a primary amine in the absence of thiol and its reaction with thiol in the absence of amine. | ||
Meanwhile, an absorption band was observed at 275 nm in the case of a solution containing both OPA and AMH (blank solution, Fig. 2) but no fluorescence activity was noticed. The product that could absorb light without fluorescence activity may be phthalimidine as mentioned earlier.57 Lastly, the solution that contains both OPA and CP showed an absorption band at approximately 275 nm but with very low fluorescence activity. The reported product of such reaction was proposed to be OPA-thiol adduct.58 As shown in Fig. 3, this adduct has a similar structure to OPA itself. Additionally, the FTIR spectroscopy technique was applied to the pure drug sample and the developed product from the confirmation point of view. It was discovered that the product's IR spectrum had lost some predicted characteristic bands and the appearance of new peaks that confirmed the birth of a new product. So, by comparing the spectra of CP and the developed product (ESI, 1†), it was determined that the new isoindole derivative had been formed.
3.1. Method development
In order to attain the highest sensitivity of the presented reaction for CP determination, variables that may influence the proceeding of the reaction or that could affect the stability of the formed product were examined.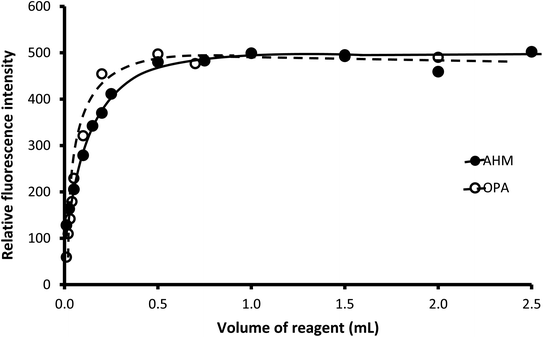 | ||
| Fig. 4 Effect of the volume of 0.01% OPA and 0.02% AMH on the relative fluorescence of the reaction product of 250 ng mL−1 CP. | ||
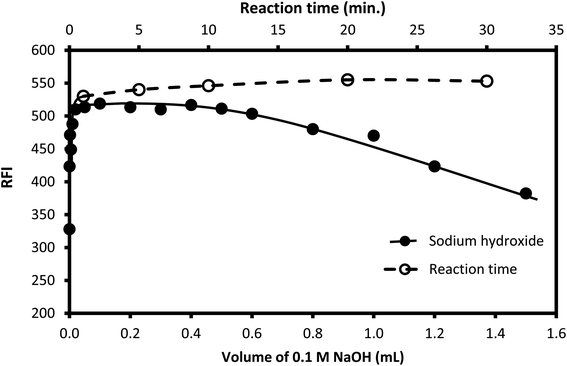
Sodium hydroxide (0.05 M) solution was utilized to attain the required alkalinity of the reaction medium. Different volumes of the reagent were tested, as shown in Fig. 5. The suitable volume was in the range of 0.1–0.5 mL. Lower volumes were not enough to attain the appropriate pH, while high volume results in the destruction of the formed isoindole derivative.59 Accordingly, 0.4 mL of 0.05 M sodium hydroxide was selected to adjust the pH of the reaction medium.
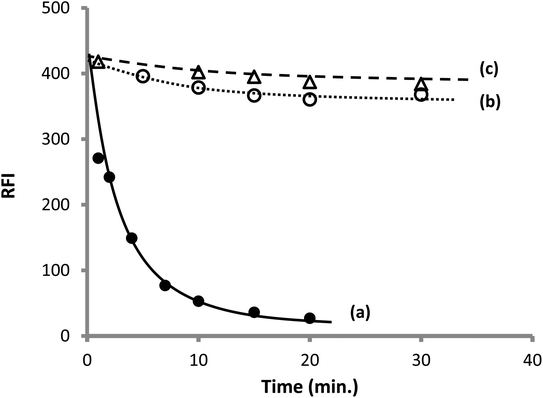
On the other hand, a very slight decrease in the fluorescence intensity was observed upon incubation of CP and OPA together at the different time periods before adding AMH. A similar result was noticed by incubating CP and AMH together before adding OPA. The later finding means that if both the amine and thiol compounds have coexisted in the reaction vessel, OPA will react with the thiol rather than the amine because S-nucleophilic substitution reaction is preferential over the N-nucleophilic substitution.
3.2. Spectral characterization of the formed product
The fluorescence quantum yield of the reaction product between OPA/CP/AMH was driven by applying a comparison technique.68 A very diluted solution of fluoresceine was utilized as a reference solution, and its fluorescence quantum yield is 0.79.61 To estimate the quantum yield of the formed product, the absorbance values of different solutions were plotted versus the values of fluorescence intensity for both the standard (fluorescein) solutions and the reaction product solutions. The absorbance values of the solutions in all cases must be less than 0.1 (ref. 62) to eliminate the inner filter effect. The slopes (Sf for fluoresceine and S for the reaction product) of the obtained straight lines in both cases were estimated and were used in the calculation of the quantum yield of the formed product by applying the next equation,62where; Q is the quantum yield, S is the slope of the straight line, RI is the refractive index of the solvent, and the subscript letters “f” denotes fluorescein. The solvent used in the preparation of the reference material and for the reaction medium for product formation was water; hence RI = RIf. The calculated quantum yield of the reaction product was 0.39. In addition, the molar absorptivity of the formed product at 337 nm (similar to excitation wavelength) was calculated and was found to be 3.3 × 10³ L mol−1 cm−1. However, OPA in pure water does not have any absorption or emission characters at 334 nm, but it has an absorption band at λmax 275 with molar absorptivity of 0.22 × 10³ L mol−1 cm−1. This confirms the formation of a new compound (isoindole derivative) upon the reaction of the three reactants.
Although OPA and the formed isoindole derivative have high structural similarities, the two compounds exhibited different fluorescence activity and have different quantum yields. The low fluorescence activity of the reagent blank (OPA) is most likely due to the presence of two carbonyl groups linked directly to the benzene ring, which have a high electron-withdrawing effect. While in the isoindole derivative, the two groups no longer exist. Additionally, the higher planarity of the isoindole molecule further enhanced its emission characteristics.
3.3. Reaction stoichiometry and the proposed reaction mechanism
To estimate the molar ratio between the three reactants (CP, OPA, and AMH), the limiting logarithmic method was applied.46 The results presented in Fig. 8 show three linear lines for the relationship between the logarithm of the relative fluorescence intensity and the logarithm of the molar concentration of each of the three reactants. The slopes of these linear lines are 0.9939, 0.831, and 0.9548 for CP, OPA, and AMH, respectively. These values confirm a 1![[thin space (1/6-em)]](https://www.rsc.org/images/entities/char_2009.gif) :
:![[thin space (1/6-em)]](https://www.rsc.org/images/entities/char_2009.gif) 1
1![[thin space (1/6-em)]](https://www.rsc.org/images/entities/char_2009.gif) :
:![[thin space (1/6-em)]](https://www.rsc.org/images/entities/char_2009.gif) 1 ratio for these reactants.
1 ratio for these reactants.
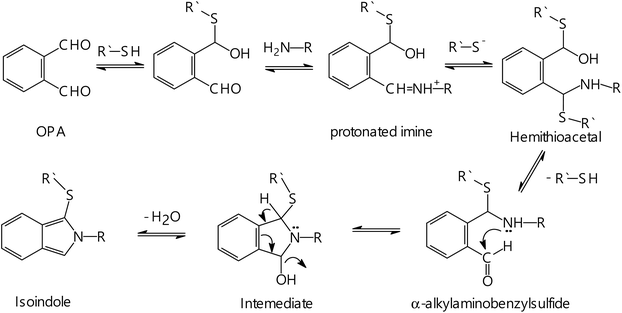
Based on the obtained stoichiometry of the reaction and the guidance of the previously published work,41 a proposal for the reaction pathway is given in Fig. 9. As mentioned before, high fluorescence intensity was noticed when the CP was mixed with OPA prior to adding AMH compared to the case when AMH was mixed with OPA first. This can give an indication that the thiol compound (CP) initially interacts with OPA to give hemithioacetal(I), which then interacts with the amino group of AMH to give a protonated imine. The reaction occurs at pH, where the thiol is partially present in the thiolate form. Thus, the thiol anion attacks the protonated imine to produce hemithioacetal(II), which then undergoes rapid decomposition in alkaline media, giving α-alkylaminobenzylsulfide. The later compound undergoes intramolecular nucleophilic attack of the carbonyl group by the secondary amine to give an intermediate, which is easily dehydrated to produce the target isoindole.
3.4. Method validation
After selecting the optimal parameters of the method, it was subjected for complete method validation on the basis of the International Council of Harmonization.63 The assessed parameters included; the linearity range, limit of detection, the limit of quantitative accuracy, precision, and robustness.| Parameters | Value |
|---|---|
| Linear range (ng mL−1) | 20–450 |
| Slope (b) | 1.98 |
| Standard deviation of the slope (Sb) | 0.015 |
| Intercept (a) | 16.27 |
| Standard deviation of the intercept (Sa) | 3.86 |
| Standard deviation of residuals Sx/y | 8.87 |
| Determination coefficient (r2) | 0.9993 |
| Correlation coefficient (r) | 0.9997 |
| Limit of detection (LOD) (ng mL−1) | 6.4 |
| Limit of quantitation (LOQ) (ng mL−1) | 19.5 |
| Taken (ng mL−1) | Founda ± SDb (ng mL−1) | % Recovery ± SDb | RSD |
|---|---|---|---|
| a The value is the average of three determinations.b SD is the standard deviation and % RSD is the relative standard deviation percentage. | |||
| 100 | 98.82 ± 1.24 | 98.82 ± 1.24 | 1.22 |
| 200 | 202.46 ± 0.75 | 101.23 ± 0.38 | 0.38 |
| 300 | 298.82 ± 3.12 | 99.61 ± 1.04 | 1.03 |
| Conc. (ng mL−1) | % Recovery | Mean ± SD | RSD | ||
|---|---|---|---|---|---|
| a SD: standard deviation, % RSD: relative standard deviation percentage. | |||||
| Intra-day precision | |||||
| 100 | 97.95 | 99.63 | 99.73 | 99.10 ± 1.00 | 1.01 |
| 200 | 101.39 | 101.20 | 101.70 | 101.43 ± 0.25 | 0.24 |
| 300 | 99.65 | 100.40 | 99.06 | 99.70 ± 0.67 | 0.68 |
![[thin space (1/6-em)]](https://www.rsc.org/images/entities/char_2009.gif) |
|||||
| Inter-day precision | |||||
| 100 | 99.33 | 99.1 | 97.14 | 98.53 ± 1.21 | 1.22 |
| 200 | 101.23 | 101.43 | 99.68 | 100.78 ± 0.96 | 0.95 |
| 300 | 99.61 | 99.7 | 100.1 | 99.80 ± 0.26 | 0.26 |
| Parameters | Volume | % Recovery a ± SD | % RSD |
|---|---|---|---|
| a SD: standard deviation, % RSD: Rrlative standard deviation percentage. | |||
| o-Phythaldehyde volume (0.01%) | 0.8 mL | 100.38 ± 1.31 | 1.31 |
| 1.0 mL | 99.24 ± 1.37 | 1.36 | |
| 1.2 mL | 100.15 ± 0.43 | 0.43 | |
| AMH volume | 0.45 mL | 101.86 ± 1.03 | 1.05 |
| 0.50 mL | 101.68 ± 0.71 | 0.72 | |
| 0.55 mL | 100.13 ± 1.63 | 1.63 | |
| Sodium hydroxide volume (0.05 M) | 0.35 mL | 98.23 ± 0.59 | 0.58 |
| 0.40 mL | 98.02 ± 0.62 | 0.61 | |
| 0.45 mL | 97.93 ± 0.75 | 0.73 | |
3.5. Analysis of commercial pharmaceutical tablets
The content of commercial tablets (Captopril® 25 mg) containing CP was estimated by performing the general procedure, and the same tablets were also undergone analysis by previously published method.2 The accuracy and precision of the proposed methods were further evaluated by performing t-student and F-tests. The obtained values were compared with the tabulated one at 95% level of confidence. Data provided in Table 5 shows that the calculated values are not higher than the tabulated ones for both parameters. As a result, the proposed method is considered both accurate and precise. Additionally, the analysis proved that the existence of tablet excipients did not influence the method's performance. Thus, the suggested method could be used in the analysis of real samples in a quality control laboratory.3.6. The approach's greenness rating
Analysts have extensive responsibility to safeguard the environment and people from harmful chemicals and organic waste generated by chemical and pharmaceutical industries.64,65 Green chemistry development and improvement must be ongoing. Modern concerns like the analytical eco scale score66 have been used to measure an analytical method's “ecological worth”. “Ultimate green analysis” results were obtained by deducting the penalty points imposed from 100. These points represent the study method's risks. The greener the analysis, the higher the score (high number).67 The designed approach scored 92 on the eco-scale because it required no extraction, no heating, and the energy generated less than 0.1 kW h per sample (Table 6). So, our method was eco-friendly.| Item | Parameter | *PP score |
|---|---|---|
| a PP: penalty point; TPPs: total penalty points. | ||
| Technique | Fluorimetry | 1 |
| Reagent | OPA | 2 |
| Amount of reagent | >10 mL | 1 |
| Solvent(s) | Water | 0 |
| Heating | No heating | 0 |
| Temperature | 25 °C | 0 |
| Medium | Very diluted alkaline | 1 |
| Cooling | No cooling | 0 |
| Energy | 1.0 > kW h per sample | 0 |
| Waste | 1–10 mL (g) | 3 |
| Occupational hazards | 0 | |
| *TPPs | 8 | |
| Eco-scale total score | = 100 − TPP | 92 |
4. Conclusion
A new spectrofluorimetric approach was designed for the sensitive analysis of captopril as thiol-containing compound. Because of the essential role of the thiol compound (CP) in the isoindole formation through condensation of the primary amine (AMH) and OPA, the reaction could be applied for the analysis of CP. The mechanism of the formation of the isoindole derivative was discussed, and its quantum yield was calculated. The involved procedure is rapid, involves one-pot reaction, and could be performed simply as no extraction step was needed. In addition, the method is highly sensitive, performed at ambient temperature, and safe for the environment. The procedure was effectively utilized in the assay of commercial tablets that contain the target analyte without any interfering effect from the common excipients.Author contributions
Sayed M. Derayea: design of the work, coordination, conceptualization and manuscript writing. Dalia M. Nagy: participation in the design of the work and manuscript drafting. Khalid M. Badr El-Din: conceiving the work and manuscript drafting. Tamer Z. Attia: carried out statistical treatment of the results, Abubaker A. Mohamed participated in data analysis. Ebtihal Samir interpretation of the results, Ahmed A. Hamad: performing the experimental work, validation, applications, manuscript editing, submission, and revisions. All authors approved the final manuscript for publication.Conflicts of interest
There is no conflict of interest to declare.References
- S. C. Sweetman, Martindale: The Complete Drug Reference, Pharmaceutical Press, London, UK, 2007 Search PubMed.
- I. Panderi and M. Parissi-Poulou, Int. J. Pharm., 1992, 86, 99–106 CrossRef CAS.
- Y. El-Shabrawy, N. El-Enany and K. Salem, Il Farmaco, 2004, 59, 803–808 CrossRef CAS PubMed.
- A. M. El-Didamony and E. A. Erfan, Spectrochim. Acta, Part A, 2010, 75, 1138–1145 CrossRef PubMed.
- H. F. Askal, Talanta, 1991, 38, 1155–1158 CrossRef CAS.
- E. Ivashkiv, J. Pharm. Sci., 1984, 73, 1427–1430 CrossRef CAS PubMed.
- N. Aykin, R. Neal, M. Yusof and N. Ercal, Biomed. Chromatogr., 2001, 15, 427–432 CrossRef CAS PubMed.
- T. Huang, Z. He, B. Yang, L. Shao, X. Zheng and G. Duan, J. Pharm. Biomed. Anal., 2006, 41, 644–648 CrossRef CAS PubMed.
- M. Amini, A. Zarghi and H. Vatanpour, Pharm. Acta Helv., 1999, 73, 303–306 CrossRef CAS PubMed.
- K. Kuśmierek and E. Bald, Chromatographia, 2007, 66, 71–74 CrossRef.
- N. Rastkari, M. Khoobi, A. Shafiee, M. R. Khoshayand and R. Ahmadkhaniha, J. Chromatogr. B: Anal. Technol. Biomed. Life Sci., 2013, 932, 144–151 CrossRef CAS PubMed.
- N. Sultana, M. S. Arayne and S. Naveed, J. Chin. Chem. Soc., 2010, 57, 378–383 CrossRef CAS.
- N. Sultana, M. S. Arayne and S. Naveed, J. Chin. Chem. Soc., 2010, 57, 62–67 CrossRef CAS.
- A. El-Gindy, M. W. Nassar, K. A.-S. Attia, H. H. Abu-Seada and M. El-Ghandour, J. Liq. Chromatogr. Relat. Technol., 2014, 37, 696–712 CrossRef CAS.
- S. Vancea, S. Imre, G. Donáth-Nagy, T. Béla, M. Nyulas, T. Muntean and R. Borka-Balás, Talanta, 2009, 79, 436–441 CrossRef CAS PubMed.
- M. E. Palomeque and B. S. F. Band, J. Pharm. Biomed. Anal., 2002, 30, 547–552 CrossRef CAS.
- R. S. Guerrero, S. S. Vives and J. M. Calatayud, Microchem. J., 1991, 43, 176–180 CrossRef.
- E. Schmidt Jr, W. R. Melchert and F. R. Rocha, J. Braz. Chem. Soc., 2009, 20, 236–242 CrossRef.
- W. T. Suarez, A. A. Madi, L. Figueiredo-Filho and O. Fatibello-Filho, J. Braz. Chem. Soc., 2007, 18, 1215–1219 CrossRef CAS.
- P. D. Tzanavaras, D. G. Themelis, A. Economou and G. Theodoridis, Talanta, 2002, 57, 575–581 CrossRef CAS PubMed.
- R.-I. Stefan, J. K. F. van Staden and H. Y. Aboul-Enein, Biosens. Bioelectron., 2000, 15, 1–5 CrossRef CAS PubMed.
- P. d. S. Ribeiro, A. Santini, H. R. Pezza and L. Pezza, Ecletica Quim., 2003, 28, 39–44 CrossRef CAS.
- A. Zarezadeh, H. R. Rajabi, O. Sheydaei and H. Khajehsharifi, Mater. Sci. Eng., C, 2019, 94, 879–885 CrossRef CAS PubMed.
- H. Karimi-Maleh, M. R. Ganjali, P. Norouzi and A. Bananezhad, Mater. Sci. Eng., C, 2017, 73, 472–477 CrossRef CAS PubMed.
- A. Ensafi, H. Karimi-Maleh, S. Mallakpour and B. Rezaei, Colloids Surf., B, 2011, 87, 480–488 CrossRef CAS PubMed.
- N. P. Shetti, S. J. Malode and S. T. Nandibewoor, Anal. Methods, 2015, 7, 8673–8682 RSC.
- H. Beitollahi, M. A. Taher, M. Ahmadipour and R. Hosseinzadeh, Measurement, 2014, 47, 770–776 CrossRef.
- B. Rezaei and S. Damiri, Sens. Actuators, B, 2008, 134, 324–331 CrossRef CAS.
- H. Karimi-Maleh, A. Ensafi and A. Allafchian, J. Solid State Electrochem., 2010, 14, 9 CrossRef CAS.
- W. Siangproh, P. Ngamukot and O. Chailapakul, Sens. Actuators, B, 2003, 91, 60–66 CrossRef CAS.
- M. A. Khalilzadeh, H. Karimi-Maleh, A. Amiri and F. Gholami, Chin. Chem. Lett., 2010, 21, 1467–1470 CrossRef CAS.
- G. Ziyatdinova, G. Budnikov and V. Pogorel’tsev, J. Anal. Chem., 2006, 61, 798–800 CrossRef CAS.
- A. B. F. Vitoreti, O. Abrahão, R. Gomes, G. R. Salazar-Banda and R. T. Oliveira, Int. J. Electrochem. Sci., 2014, 9, 1044–1054 Search PubMed.
- H. Parham and B. Zargar, Talanta, 2005, 65, 776–780 CrossRef CAS PubMed.
- M. El Reis, F. Abou Attia and I. Kenawy, J. Pharm. Biomed. Anal., 2000, 23, 249–254 CrossRef CAS PubMed.
- S. Mazurek and R. Szostak, J. Pharm. Biomed. Anal., 2006, 40, 1225–1230 CrossRef CAS PubMed.
- X. Zhang, W. Baeyens, G. Van der Weken, A. Calokerinos and K. Nakashima, Anal. Chim. Acta, 1995, 303, 121–125 CrossRef CAS.
- S. S. M. Rodrigues and J. L. Santos, Talanta, 2012, 96, 210–215 CrossRef CAS PubMed.
- S. Hillaert and W. Van den Bossche, J. Pharm. Biomed. Anal., 1999, 21, 65–73 CrossRef CAS.
- M. Roth, Anal. Chem., 1971, 43, 880 CrossRef CAS PubMed.
- S. S. Simons Jr and D. F. Johnson, J. Org. Chem., 1978, 43, 2886–2891 CrossRef.
- R. C. Simpson, J. E. Spriggle and H. Veening, J. Chromatogr., 1983, 261, 407–414 CrossRef CAS.
- V. Concha-Herrera, J. Torres-Lapasió and M. García-Alvarez-Coque, J. Liq. Chromatogr. Relat. Technol., 2004, 27, 1593–1609 CrossRef CAS.
- T. D. Karakosta and P. D. Tzanavaras, Anal. Lett., 2011, 44, 2530–2542 CrossRef CAS.
- M. Douša, J. Pharm. Biomed. Anal., 2018, 156, 1–7 CrossRef PubMed.
- J. Rose, Advanced Physicochemical Experiments, Pitman, London 1964 Search PubMed.
- M. A. Omar, A.-M. I. Mohamed, S. M. Derayea, M. A. Hammad and A. A. Mohamed, Spectrochim. Acta, Part A, 2018, 195, 215–222 CrossRef CAS PubMed.
- T. Z. Attia, M. Elnady and S. M. Derayea, RSC Adv., 2019, 9, 29942–29948 RSC.
- S. M. Derayea, T. Z. Attia, M. Elnady and D. M. Nagy, Microchem. J., 2019, 150, 104143 CrossRef CAS.
- A. A. Abu-hassan, R. Ali and S. M. Derayea, RSC Adv., 2020, 10, 38884–38889 RSC.
- S. M. Derayea, P. Y. Khashaba, M. Abdelgaleel and D. M. Nagi, Luminescence, 2022, 37(2), 230–237 CrossRef CAS PubMed.
- A. El-Gindy, A. Ashour, L. Abdel-Fattah and M. M. Shabana, J. Pharm. Biomed. Anal., 2001, 25, 913–922 CrossRef CAS.
- M. I. Walash, F. Belal, N. El-Enany and M. H. El-Maghrabey, Luminescence, 2012, 27, 511–518 CrossRef CAS PubMed.
- H. Nakamura, A. Matsumoto and Z. Tamura, Anal. Lett., 1982, 15, 1393–1410 CrossRef CAS.
- J. Stobaugh, A. Repta, L. Sternson and K. Garren, Anal. Biochem., 1983, 135, 495–504 CrossRef CAS.
- W. Jacobs, M. Leburg and E. Madaj, Anal. Biochem., 1986, 156, 334–340 CrossRef CAS.
- T. Do Minh, A. Johnson, J. Jones and P. Senise Jr, J. Org. Chem., 1977, 42, 4217–4221 CrossRef CAS.
- E. Trepman and R. F. Chen, Arch. Biochem. Biophys., 1980, 204, 524–532 CrossRef CAS PubMed.
- J. F. Stobaugh, A. J. Repta and L. A. Sternson, J. Org. Chem., 1984, 49, 4306 CrossRef CAS.
- N. M. El-Enany, D. T. El-Sherbiny, A. A. Abdelal and F. F. Belal, J. Fluoresc., 2010, 20, 463–472 CrossRef CAS PubMed.
- J. Q. Umberger and V. K. LaMer, J. Am. Chem. Soc., 1945, 67, 1099–1109 CrossRef CAS.
- A. T. R. Williams, S. A. Winfield and J. N. Miller, Analyst, 1983, 108, 1067–1071 RSC.
- ICH, Harmonized Tripartite Guideline, Validation of analytical procedures: text and methodology Q2 (R1), Geneva, 2005 Search PubMed.
- S. M. Derayea, R. Ali and A. A. Hamad, Arabian J. Chem., 2020, 13, 8026–8038 CrossRef CAS.
- A. A. Hamad, R. Ali and S. M. Derayea, RSC Adv., 2022, 12, 7413–7421 RSC.
- A. Gałuszka, Z. M. Migaszewski, P. Konieczka and J. Namieśnik, TrAC, Trends Anal. Chem., 2012, 37, 61–72 CrossRef.
- S. M. Derayea, H. Madian, E. Samir, A. Hamad and K. M. Badr-eldin, Spectrochim. Acta, Part A, 2022, 121024 CrossRef CAS PubMed.
- A. A. Hamad, R. Ali and S. M. Derayea, Luminescence, 2021, 36, 443–453 CrossRef CAS PubMed.
Footnote |
| † Electronic supplementary information (ESI) available. See https://doi.org/10.1039/d2ra02408j |
| This journal is © The Royal Society of Chemistry 2022 |


