 Open Access Article
Preparation and photodynamic antibacterial/anticancer effects of ultralong-lifetime room-temperature phosphorescent N-doped carbon dots†
Yanming Miao *,
Xinhao Zhang,
Jinyao Li,
Wenli Yang,
Xiaomin Huang and
Jinzhi Lv*
School of Life Science, Shanxi Normal University, Taiyuan 030006, PR China. E-mail: mym8207@126.com; lvjinzhi208@126.com; Tel: +86-0351-2051196
First published on 15th July 2022
Abstract
Room-temperature phosphorescent (RTP) N-doped carbon-dots (CNDs) featuring eco-friendliness, low cost and high biocompatibility, are ideal photodynamic antibacterial and anticancer nanomaterials. However, the existing CNDs are limited by low singlet oxygen (1O2) quantum yield, which has become a bottleneck in the development of CNDs. One basic reason is the short T1-state exciton lifetime of CNDs. Herein, triethylenetetramine hexaacetic acid was used to synthesize CNDs via a one-step hydrothermal method. CNDs are characterized with low toxicity, high biocompatibility and ultralong-lifetime RTP (URTP). In addition to the URTP (average lifetime 414 ms) under solid conditions, CNDs even had URTP (average lifetime 320 ms) in a water environment. The ultralong T1 exciton lifetime largely extends the collision time between T1 state excitons and O2 and prolongs the energy transfer time, not only improving the quantum yield (0.63) of singlet oxygen (1O2) in solution, but also facilitating the photodynamic antibacterial and anticancer effects.
Introduction
Photodynamic antibacterial and anticancer effects based on photosensitizers are considered as effective antibacterial and anticancer replacement therapies with few side effects, which can be rapidly and repeatedly used.1,2 Given the easy production and high oxidation activity, 1O2 is the core molecule of the photodynamic effect, and oxygen (O2) is the most abundant, cheapest and green oxidizer and the main source of 1O2 generation. However, since O2 has a triplet state (3O2, spin prohibition) and dynamic stability, a photosensitizer is usually needed to overcome spin prohibition before the triplet state oxygen (3O2) can be converted to the singlet state (1O2). Nevertheless, the commonly-used photosensitizers including various organic dyes3,4 and nanomaterials (e.g. graphene quantum dots,5 black phosphorus,6 graphite carbon nitride,7 metal organic frameworks8) are limited by low photosensitivity, which results in low 1O2 quantum yield, or low water solubility and biocompatibility, or complex synthetic conditions. This limitation restricts their photodynamic antibacterial and anticancer applications. Hence, novel photosensitizers should be developed to improve 1O2 quantum yields. Room-temperature phosphorescent (RTP) photosensitizers create a new route to solve the above problem.Room-temperature phosphorescence (RTP) is caused by a triplet excited state (T1) transition,9–11 so RTP photosensitizers have very large T1 exciton quantum yields. Since the ground state of O2 molecules is a triplet state, RTP photosensitizers, through the energy transfer between T1 excitons and O2 molecules, generate more highly-oxidizing 1O2.9,12 Moreover, since energy transfer is achieved through intermolecular collision, for a photosensitizer with longer RTP lifetime (longer T1 exciton lifetime), the probability of collision and energy transfer between O2 molecules is higher, the photosensitizer is more sensitive to O2, and the 1O2 quantum yield is larger. Hence, ultralong-lifetime RTP (URTP) photosensitizers have higher 1O2 yields.13,14 Thus, one key factor in improving 1O2 quantum yields is to prepare RTP photosensitizers with long-lifetime T1-state excitons.
As novel photoluminescent nanomaterials, carbon dots (CDs) feature simple preparation, low cost, low toxicity and high biocompatibility, and are extensively applied in photoelectric devices,15,16 sensors,17,18 catalysis,19,20 bacterial therapy,21,22 and forgery prevention.23,24 Specifically, N-doped carbon dot (CND) RTP nanomaterials have higher T1 quantum yield, and more easily convert the ground state triplet O2 to 1O2, and CNDs have the characteristics of low cost and high biocompatibility. Therefore, CNDs are ideal materials for photodynamic bacteria and cancer applications. However, the 1O2 quantum yield of CNDs is still relatively low, which is mainly due to the short RTP lifetime of the commonly synthesized CND materials and the short collision time between T1 state excitons and O2, resulting in a short energy transfer time, which has become the bottleneck of their development.
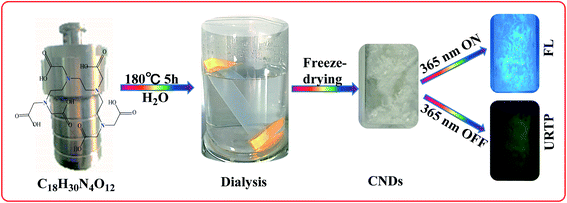
In this study, CNDs were synthesized from triethylenetetramine hexaacetic acid (TTHA) via a one-step hydrothermal method. Although some researchers have synthesized fluorescent CDs with triethylenetetramine hexaacetic acid in alkaline aqueous solution and at 250 °C,25 in this study, CNDs were synthesized with triethylenetetramine hexaacetic acid in pure water and at a lower temperature (180 °C), and the synthesized CNDs have URTP properties. The CNDs not only have low toxicity and good biocompatibility, but also have URTP properties. The ultralong T1 exciton lifetime of these CNDs largely extends the collision time between T1 state excitons and O2 and prolongs the energy transfer time, which not only ensures a higher quantum yield of singlet oxygen (1O2), but also facilitates the photodynamic antibacterial and anticancer effects of CNDs (Fig. 1).
Experimental
Instruments and methods
A JEM-2100 TEM (JEOL, Japan) was applied to characterize the morphological structure of CNDs. XPS was conducted on a Vario EL cube XRP spectrometer (Bruker, Germany). A Cary Eclipse fluorescence spectrophotometer (Agilent Technologies, US) was applied to record the phosphorescence and phosphorescence lifetime. For the detection of ultraviolet-visible (UV-vis) spectra, a UV-1800PC spectrophotometer (Shanghai Meipuda Instrument Co., Ltd, China) was used. 1H NMR and 13C NMR were performed on an AVANCE III HD600 MHz NMR analyzer (Bruker, Germany). Infra-red spectra were recorded using a Varian 660 FT-IR spectrometer (Varian Co. Ltd, USA). The cell experiments were conducted using an MCO-15AC CO2 thermostatic incubator (SANYO), an ECLIPSE Ts2 inverted microscope (Nikon), a CytoFLEX flow cytometer (BECKMAN), and a Flexstation® 3 enzyme labelling meter (Molecular Devices (MD)).Materials
Triethylenetetramine hexaacetic acid (TTHA) was provided by Aladdin (USA, 98%). 3-(4,5-Dimethylthiazol-2-y1)-2,5-diphenyltetrazolium bromide (MTT) was produced by BioFrox. Dulbecco's modified Eagle's medium (DMEM) was bought from GIBCO. Cell ROS testing kits were bought from Shanghai Beyotime Biotech Co., Ltd (China). Beef extracts and peptone were provided by Tianjin Guangfu Fine Chemicals Institute (China). Agar powder was purchased from Beijing Abxing Biotech Co., Ltd (China). Balb/c nude mice were bought from SPF Beijing Biotechnology Co., Ltd (China), and the quality testing unit was Suzhou Xishan Biotechnology Co., Ltd (China). All animal procedures were performed in accordance with the Chinese national standard (GB/T 35892-2018), which is the laboratory animal-guideline for ethical review of animal welfare, and the administrative measures for experimental animals of Shanxi Normal University. The experiments were approved by the Ethics Committee of Linfen Central Hospital, China. Other reagents (analytically pure) and kits were provided by Shanghai Sangon Biotech (China). Ultrapure water (with a resistivity equal to or more than 18.25 MΩ cm) for the experiments was produced by a Labconco ultrapure water machine (USA).Preparation method of CNDs
Triethylenetetramine hexaacetic acid (TTHA, 0.8 g) and 30 mL of ultrapure water were added to a reaction kettle, and stirred well to dissolve. Then the kettle was transferred to a 50 mL autoclave, heated to 180 °C and maintained for 5 h. After that, the autoclave was removed and cooled to room temperature, forming a light yellow water solution. The solution was filtered through membranes (0.22 μm) and dialyzed using dialysis membranes (molecular weight cutoff was MWCO: 1000) for 48 h. Ultrapure water was changed every 4 h to remove the unreacted raw materials. Finally, the CND water solution in the dialysis membrane was collected and freeze-dried to form white solid products.CNDs and Cy3.5 biological conjugation
Firstly, Cy3.5 (10 mg) was dissolved into 1 mL of water to form a 10 mg mL−1 Cy3.5 water solution, and stored at 4 °C. Then, 2 mg of EDC, 5 mg of CNDs and 1 mg of NHS were dissolved into 0.5 mL of PBS (10 mM, pH 7.4), which was mixed at room temperature for 30 min to ensure the complete activation of the surface carboxyl groups of the QDs. In order to ensure the complete dissolution of unreacted EDC, 0.5 mL of MC Cy3.5 solution was added to the resulting solution, mixed at room temperature for 2 h, and protected from light overnight at 4 °C. The resulting CNDs-Cy3.5 nanocomposites were centrifuged via ultrafiltration membranes to remove the unreacted Cy3.5, and then dissolved in 1 mL of 10 mM PBS (10 mM, pH 7.4).Detection of cell 1O2
![[thin space (1/6-em)]](https://www.rsc.org/images/entities/char_2009.gif) :
:![[thin space (1/6-em)]](https://www.rsc.org/images/entities/char_2009.gif) 3, and the expanded culture was conducted at 37 °C and 5% CO2 saturated humidity.
3, and the expanded culture was conducted at 37 °C and 5% CO2 saturated humidity.![[thin space (1/6-em)]](https://www.rsc.org/images/entities/char_2009.gif) :
:![[thin space (1/6-em)]](https://www.rsc.org/images/entities/char_2009.gif) 1000. Then the cell culture medium was taken out, and the working solution was added for the incubation in an incubator at 37 °C for 20 min. After that, the cells were cleaned with a medium free of serum three times, and then the medium free of serum was added for detection and photographing under microscopy.
1000. Then the cell culture medium was taken out, and the working solution was added for the incubation in an incubator at 37 °C for 20 min. After that, the cells were cleaned with a medium free of serum three times, and then the medium free of serum was added for detection and photographing under microscopy.Cytotoxicity experiments
![[thin space (1/6-em)]](https://www.rsc.org/images/entities/char_2009.gif) :
:![[thin space (1/6-em)]](https://www.rsc.org/images/entities/char_2009.gif) 3. The expanded culture was conducted at 37 °C and 5% CO2 saturated humidity.
3. The expanded culture was conducted at 37 °C and 5% CO2 saturated humidity.![[thin space (1/6-em)]](https://www.rsc.org/images/entities/char_2009.gif) 000 μg mL−1) groups, action time: 0, 1, 5, 10, 30, 60 min.
000 μg mL−1) groups, action time: 0, 1, 5, 10, 30, 60 min.Procedures for animal experiments
Results and discussion
Characterization of CNDs
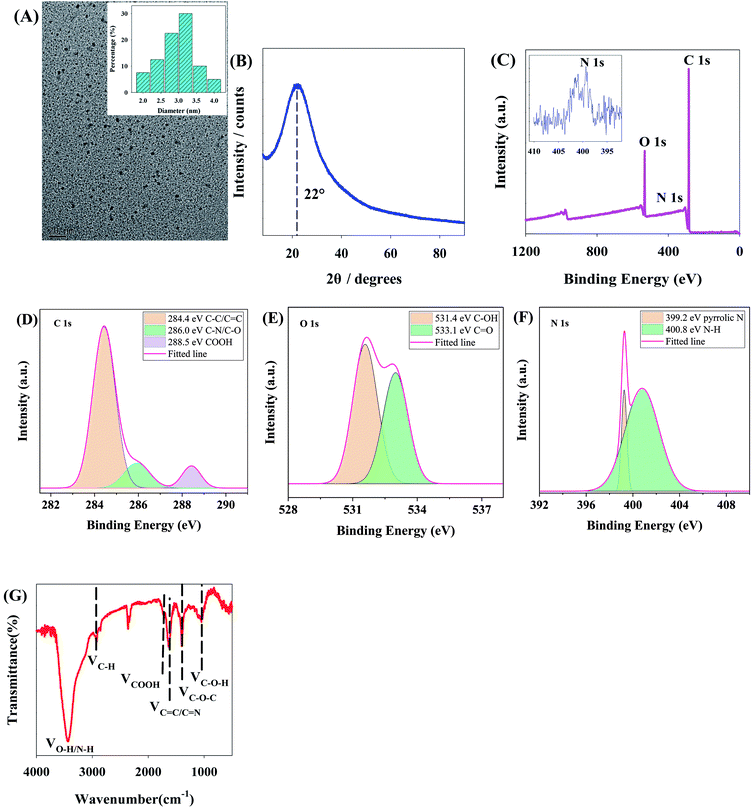
Transmission electron microscopy (TEM) shows the average grain size of CNDs, 3.1 nm or so, without evident lattice fringes (Fig. 2A), indicating that these CNDs may be polymer carbon dots. X-ray diffraction (XRD) demonstrates the peak for CNDs at 22° (Fig. 2B), which is considered to indicate partial ordering inside the carbon-dots from the covalent crosslinking skeleton formed from polymerization.25 This result further verifies that the CNDs are polymer carbon dots and confirms the results of TEM.Fourier transform infrared spectroscopy (FT-IR) and X-ray photoelectron spectroscopy (XPS) were adopted to observe the surface chemical structures of CNDs. XPS shows that the CNDs are mainly composed of carbon, nitrogen and oxygen, corresponding to three characteristic peaks at 285.1 eV (C 1s), 399.1 eV (N 1s) and 532.1 eV (O 1s) respectively (Fig. 2C). Particularly, the C 1s high-resolution spectrum (Fig. 2D) is split into three characteristic peaks at 284.4, 286.0 and 288.5 eV, which are respectively ascribed to C–C/C![[double bond, length as m-dash]](https://www.rsc.org/images/entities/char_e001.gif) C, C–N/C–O and COOH. Corresponding to C–OH and C
C, C–N/C–O and COOH. Corresponding to C–OH and C![[double bond, length as m-dash]](https://www.rsc.org/images/entities/char_e001.gif) O, the high-resolution O 1s spectrum (Fig. 2E) is divided into peaks at 531.4 and 533.1 eV. The high-resolution N 1s spectrum (Fig. 2F) is divided into peaks at 399.2 and 400.8 eV, which are attributed to pyrrolic N and N–H respectively. Besides, the surface functional groups of CNDs were further analyzed by FT-IR (Fig. 2G). The absorption peaks at 3441.2, 2945.39, 1729, 1634.3, 1410 and 1058 cm−1 respectively reflect the existence of O–H/N–H, and stretching vibrations of C–H, C
O, the high-resolution O 1s spectrum (Fig. 2E) is divided into peaks at 531.4 and 533.1 eV. The high-resolution N 1s spectrum (Fig. 2F) is divided into peaks at 399.2 and 400.8 eV, which are attributed to pyrrolic N and N–H respectively. Besides, the surface functional groups of CNDs were further analyzed by FT-IR (Fig. 2G). The absorption peaks at 3441.2, 2945.39, 1729, 1634.3, 1410 and 1058 cm−1 respectively reflect the existence of O–H/N–H, and stretching vibrations of C–H, C![[double bond, length as m-dash]](https://www.rsc.org/images/entities/char_e001.gif) O, C
O, C![[double bond, length as m-dash]](https://www.rsc.org/images/entities/char_e001.gif) C/C
C/C![[double bond, length as m-dash]](https://www.rsc.org/images/entities/char_e001.gif) N, C–O–C and C–OH. It can be seen from the above XPS and FT-IR images that CNDs are rich in groups containing oxygen and nitrogen on the surface, which promote the protonation and deprotonation of CNDs.9
N, C–O–C and C–OH. It can be seen from the above XPS and FT-IR images that CNDs are rich in groups containing oxygen and nitrogen on the surface, which promote the protonation and deprotonation of CNDs.9
The results above indicate that a type of polymer CND, rich in groups containing oxygen and nitrogen on the surface, has been synthesized here. Moreover, the crosslinking polymerization among groups of CNDs can effectively restrict the vibration of functional groups and inhibit the nonradiative transition of CNDs, which contributes to improving the photon yields of CNDs.
URTP properties of CNDs
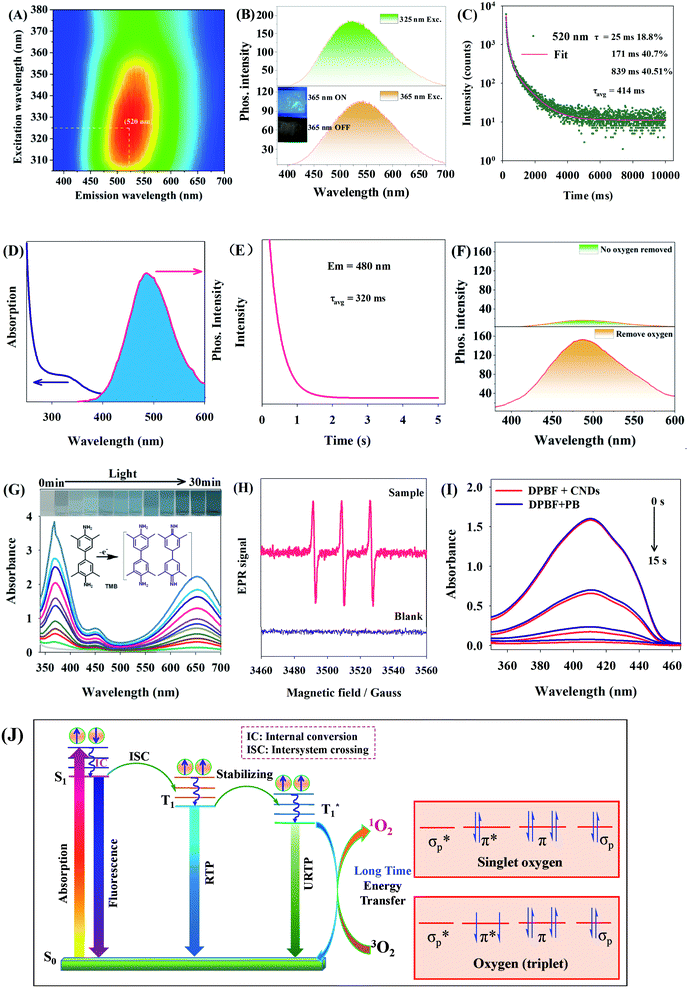
In the 3D URTP spectrum of CNDs (Fig. 3A), the powder CNDs show excitation-dependent URTP, and the optimal excitation and emission wavelengths are 325 and 520 nm respectively (Fig. 3B). The powder CNDs under an LED (365 nm) emit blue fluorescence suggesting that, after the closure of the LED, green URTP can be observed by the naked eye (Fig. 3B), and the URTP average lifetime is up to 414 ms (Fig. 3C).Fig. 3D–F show the URTP properties of CNDs in water. It can be seen from Fig. 3D that the best absorption peak of CNDs in aqueous solution is at 330 nm, the best emission peak of URTP is at 480 nm, and the average lifetime of URTP is 320 ms (Fig. 3E). When nitrogen is not supplied, the URTP of CNDs in oxygenated aqueous solution is very weak (Fig. 3F, top). However, when most O2 is removed by nitrogen, the URTP of CNDs in aqueous solution is significantly enhanced (Fig. 3F, bottom), indicating that O2 has a great influence on URTP.
Further observation shows that, under irradiation by a 365 nm LED light source, CNDs can gradually oxidize 3,3′,5,5′-tetramethylbenzidine (TMB) (0–30 min) to give a blue colour (Fig. 3G). Under solar radiation, the unobvious change of absorption peak and color of TMB (Fig. S2†) suggests that the CND solution system efficiently generates oxides under irradiation at a specific wavelength (365 nm). With the application of 2,2,6,6-tetramethylpiperidine (TEMP) as a singlet oxygen (1O2) trapping agent, the EPR spectrum of CNDs was measured (Fig. 3H). Results show that there are very obvious EPR signals, validating that the CND solution system under excitation at 365 nm generated 1O2, which further oxidized TMB and changed its color. To further study the 1O2 generating ability of CND solutions, with the application of 1,3-diphenylisobenzofuran (DPBF) as a 1O2 trapping agent and photosensitizer phloxine B (PB) as a control (quantum yield = 0.65),26 we calculated the 1O2 quantum yield of CNDs to be 0.63 (within 15 s), suggesting that CNDs have efficient 1O2 quantum yield (Fig. 3I).
Since photocatalytic energy transfer of RTP photosensitizers is achieved through intermolecular collision, the probability of collision with O2 molecules and energy transfer is improved for CNDs with longer T1 exciton lifetime (longer RTP lifetime), and the 1O2 quantum yield is larger. Hence, the URTP of CNDs contributes to improving 1O2 yields (Fig. 3J).13,14 In all, the cause of the high 1O2 yields of CNDs is attributed to the URTP of CNDs (lifetime of long-lifetime T1* excitons).
Doping with nitrogen atoms can fundamentally affect the electronic structure of carbon atoms,27–31 so appropriate doping with nitrogen can effectively promote the spin–orbit coupling (SOC) and intersystem crossing (ISC) between the excited singlet and triplet states of CNDs, and increase the quantum yields of T1-state excitons of CNDs. More importantly, the CNDs in this study are a type of polymer CND; due to the covalent crosslinking frame structure of polymers, CNDs can form a relatively stable rigid environment, which inhibits the non-radiative attenuation of triplet excitons in CNDs, stabilizing the triplet state excitons, but also prolonging the RTP lifetime. It is this covalent crosslinking frame structure that endows CNDs with URTP in water solutions. The obvious long-lifetime observed in the solid state is caused by the fact that the abundant surface functional groups (–OH, –COOH) provide many sites for the formation of hydrogen bonds between surface CNDs and inner CNDs. Moreover, the dense hydrogen bond skeletons between surface sites and inner sites can isolate O2 (Fig. S2†), thereby preventing URTP from being quenched. To validate the presence of hydrogen bond skeletons, we analyzed the differential scanning calorimetry (DSC) of solid CNDs (Fig. S3†). The results show that severe endothermic changes occurred within 50–90 °C, proving the existence of hydrogen bond skeletons in CNDs.
Inhibitory effect of CNDs on bacteria
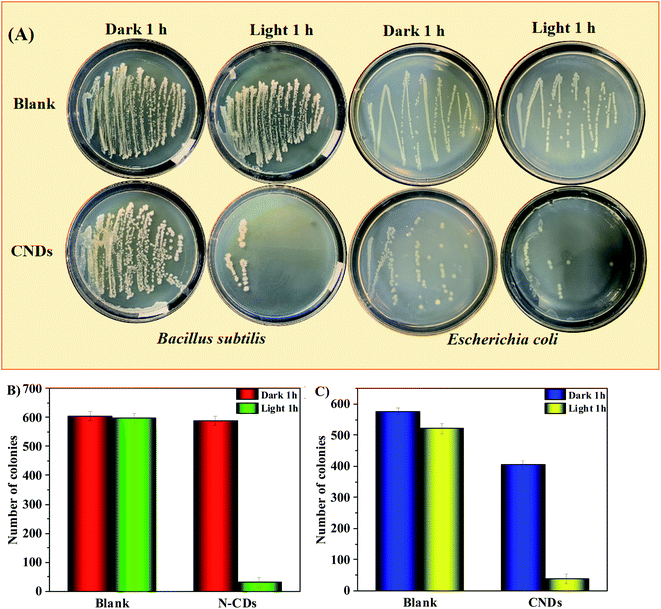
Fig. 4 shows the action of CNDs (0 and 5 μg mL−1) against a Gram-positive bacterium (Bacillus subtilis) and a Gram-negative bacterium (Escherichia coli) with or without a 365 nm LED. Clearly, under the condition of CNDs + 365 nm LED, the counts of bacterial plaques in both species are far smaller than that of the system without CNDs or without illumination (Fig. 4A), and the antibacterial rates against B. subtilis and E. coli are up to 94% and 93% respectively (Fig. 4B and C). Hence, under an excitation source at 365 nm, CNDs can convert O2 to 1O2 via URTP photocatalytic oxidation, and thereby promote the killing effects on both B. subtilis and E. coli.Inhibition effect of CNDs on HeLa cells in vitro
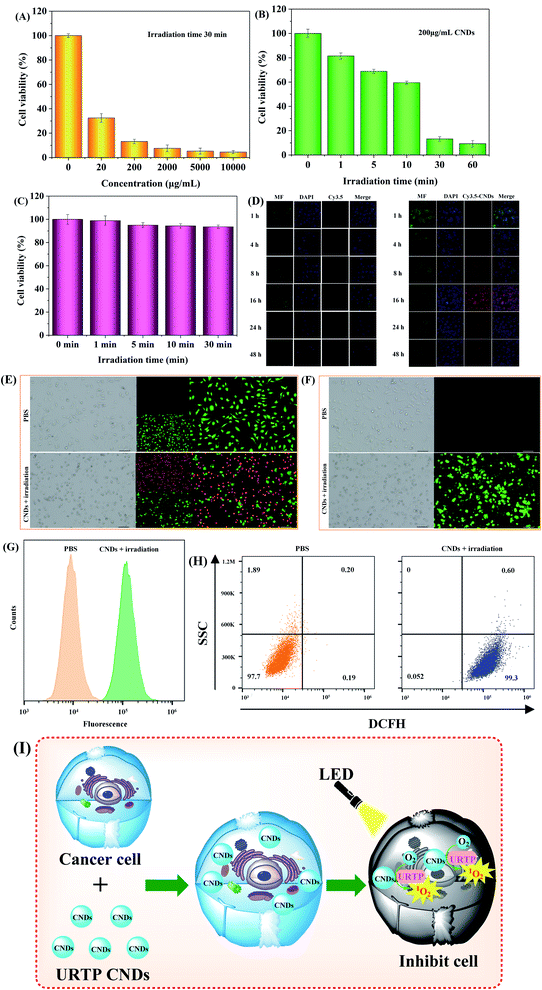
Regarding the 1O2 generating ability of CNDs, we studied the photodynamic therapy (PDT) ability of CNDs on HeLa cells in vitro. The cytotoxicity at different concentrations of CNDs (0, 20, 200, 2000, 5000, 10![[thin space (1/6-em)]](https://www.rsc.org/images/entities/char_2009.gif) 000 μg mL−1) and varying irradiation time (0, 1, 5, 10, 30, 60 min) was measured by a standard MTT method (Fig. S4A–S4F†). With the absence of irradiation, CND concentrations ≤ 200 μg mL−1 nearly did not affect the cell survival rate (Fig. S4A†), indicating that CNDs under a certain concentration show high biocompatibility. However, when CND concentration ≥ 200 μg mL−1 (Fig. 5A) and irradiation time ≥ 30 min (Fig. 5B), the cell survival rates were smaller than 15%. With the absence of CNDs, irradiation times ≤ 30 min almost did not affect cell survival rate (Fig. 5C). In all, 200 μg mL−1 CNDs and irradiation time of 30 min were selected as the optimal PDT conditions for HeLa cells.
000 μg mL−1) and varying irradiation time (0, 1, 5, 10, 30, 60 min) was measured by a standard MTT method (Fig. S4A–S4F†). With the absence of irradiation, CND concentrations ≤ 200 μg mL−1 nearly did not affect the cell survival rate (Fig. S4A†), indicating that CNDs under a certain concentration show high biocompatibility. However, when CND concentration ≥ 200 μg mL−1 (Fig. 5A) and irradiation time ≥ 30 min (Fig. 5B), the cell survival rates were smaller than 15%. With the absence of CNDs, irradiation times ≤ 30 min almost did not affect cell survival rate (Fig. 5C). In all, 200 μg mL−1 CNDs and irradiation time of 30 min were selected as the optimal PDT conditions for HeLa cells.
To investigate the behaviors of CNDs in HeLa cells in vitro, amido Cy3.5 (Ex576/Em604)-marked CNDs were selected, so that CNDs were more easily observed under laser confocal microscopy. The HeLa cells incubated with free Cy3.5 only displayed slight red fluorescence from 1 to 16 hours (left in Fig. 5D), but the red fluorescence of the Cy3.5/CNDs group (right in Fig. 5D) was significantly stronger. These results indicate that the HeLa cells can well ingest Cy3.5/CNDs, and the fluorescence intensity of cells incubated with Cy3.5/CNDs weakens after 16 hours, which may be caused by Cy3.5/CNDs being discharged out of the cells by cell metabolism.
Under irradiation by a 365 nm LED, HeLa cells were processed with PBS or 200 μg mL−1 CNDs, and then stained with propidium iodide (calcein-AM/PI) and calcein-AM, which respectively visualized dead cells (red) and living cells (green) (Fig. 5E). The results showed that CNDs + LED lead to massive death of HeLa cells. Moreover, the generation of intracellular 1O2 was detected by means of a fluorescent dye (2′,7′-dichlorodihydrofluorescein diacetate (DCFH-DA)) that could infiltrate cells and react with 1O2 to emit green fluorescence. The results show that abundant 1O2 is formed in HeLa cells (Fig. 5F), which is the direct cause of massive death of HeLa cells. Besides, apoptosis analysis (Fig. 5G and H) demonstrated that HeLa cells under CNDs + LED irradiation produced abundant 1O2, which subjected 99.9% of HeLa cells to apoptosis. The above results suggest that the toxicity of CNDs to HeLa cells can be caused by the intracellular 1O2 produced by CNDs under 365 nm LED irradiation; CNDS as URTP photosensitizers will convert O2 to 1O2, produce intracellular 1O2, and then inhibit HeLa cell proliferation (Fig. 5I).
PDT of intraneous cancers by CNDs
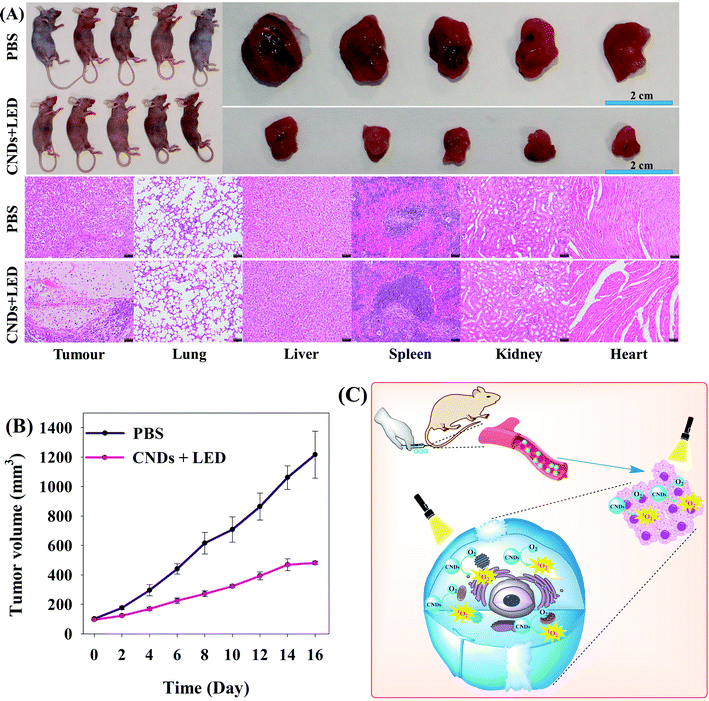
To determine the time dependence of CND distribution in mice in vivo, we recorded the time-dependent fluorescence imaging of mice. The results showed that between 24 and 48 h after the injection of CNDs/Cy3.5, CNDs/Cy3.5 was obviously accumulated in the tumor parts (Fig. S5†).To further investigate the PDT effect of CNDs on tumors in vivo, we studied the anti-tumor effect in vivo on Balb/c nude mice carrying HeLa tumors. When the HeLa tumor volume reached about 70 mm3, 10 mice were divided into a PBS group and a CNDs + LED group (since CNDs alone or LED irradiation alone nearly did not affect HeLa cells under our experimental conditions, we did not set a CND group or an LED group, for the sake of maximally protecting animals). The treated mice were intravenously injected with 200 μL of 200 μg mL−1 PBS or CNDs, and 24 h later, the CND treated mice were irradiated by a 365 nm LED (15 W) for 30 min. During the following 16 days, tumor volumes were monitored (Fig. 6A and B). The results showed that tumors in the CNDs + LED group and PBS group were significantly inhibited. Hematoxylin & eosin (H&E) staining suggested (lower part in Fig. 6A) that the tumor tissues in the CNDs + LED group were significantly necrotic, but the tumor tissues were normally shaped in the PBS group; other tissues (heart, liver, spleen, lung, kidney) were not obviously injured, indicating that the CNDs + LED treatment did not cause any severe side effects. Moreover, we also studied the toxicity in vivo of intravenous PBS and CNDs (200 μL, 200 μg mL−1) on Balb/c nude mice. The results indicated that liver and kidney function indices (AST, ALT, BUN, CRE) or blood biochemical indices (WBC, RBC, HGB, PLT) of the PBS group and CND group were all within normal ranges after 1 day or 7 days (Fig. S6 and S7†), showing no significant differences (P > 0.05). Thus it can be seen from the above results that CNDs have both favorable therapeutic effects on cancers and safety.
In all, the rationale for cancer treatment with CND PDT is that: CNDs injected into Balb/c nude mice are transported by the blood system to tumor sites. Under 365 nm LED irradiation, the CNDs generate ultralong-lifetime triplet state (T1*) excitons, and the energy transfer between the T1* excitons and O2 (the ground state is the triplet state) produces more highly-oxidizing 1O2, leading to non-specific oxidative damage to biomolecules (lipids, proteins, nucleic acids) on cell membranes or in cells and finally inhibiting tumor growth (Fig. 6C).
Conclusions
A one-step hydrothermal method was applied to synthesize URTP CNDs, which showed URTP under solid conditions and more importantly, in a water environment. The URTP of CNDs in water solutions largely prolongs the collision time between T1 excitons and O2, as well as the energy transfer time, improving the quantum yield of 1O2, and thus realizing the photodynamic antibacterial and anticancer applications of CNDs. Featuring eco-friendliness, low cost and high biocompatibility, CNDs are ideal photodynamic antibacterial and anticancer nanomaterials.Author contributions
Conceptualization: Yanming Miao, Xinhao Zhang, Jinyao Li and Jinzhi Lv; formal analysis: Yanming Miao, Xinhao Zhang, Jinyao Li, Wenli Yang, Xiaomin Huang and Jinzhi Lv; funding acquisition: Yanming Miao and Jinzhi Lv; methodology: Yanming Miao, Jinyao Li, Wenli Yang, Xiaomin Huang and Jinzhi Lv; writing – original draft: Yanming Miao, Xinhao Zhang, Jinyao Li and Wenli Yang; writing – review & editing: Xiaomin Huang and Jinzhi Lv.Conflicts of interest
There are no conflicts to declare.Acknowledgements
The work was completed with the support of the National Natural Science Foundation of China (NSFC) (Grant 32171393, 31700862 and 32001202).References
- F. Cieplik, D. Deng, W. Crielaard, W. Buchalla and E. Hellwig, Crit. Rev. Microbiol., 2018, 44, 571–589 CrossRef CAS PubMed
.
- X. Dong, W. Liang, M. J. Meziani, Y. P. Sun and L. Yang, Theranostics, 2020, 10, 671–686 CrossRef CAS PubMed
.
- D. Wang, L. Niu, Z. Y. Qiao, D. B. Cheng, J. Wang, Y. Zhong, F. Bai, H. Wang and H. Fan, ACS Nano, 2018, 12, 3796–3803 CrossRef CAS PubMed
.
- J. Wang, Y. Zhong, X. Wang, W. Yang, F. Bai, B. Zhang, L. Alarid, K. Bian and H. Fan, Nano Lett., 2017, 17, 6916–6921 CrossRef CAS PubMed
.
- J. Ge, M. Lan, B. Zhou, W. Liu, L. Guo, H. Wang, Q. Jia, G. Niu, X. Huang, H. Zhou, X. Meng, P. Wang, C. S. Lee, W. Zhang and X. Han, Nat. Commun., 2014, 5, 4596 CrossRef CAS PubMed
.
- H. Wang, X. Yang, W. Shao, S. Chen, J. Xie, X. Zhang, J. Wang and Y. J. Xie, J. Am. Chem. Soc., 2015, 137, 11376–11382 CrossRef CAS PubMed
.
- Z. Zhou, Y. Zhang, Y. Shen, S. Liu and Y. Zhang, Chem. Soc. Rev., 2018, 47, 2298–2321 RSC
.
- X. Zheng, L. Wang, Q. Pei, S. He, S. Liu and Z. Xie, Chem. Mater., 2017, 29, 2374–2381 CrossRef CAS
.
- J. Zhang, X. Lu, D. Tang, S. Wu, X. Hou, J. Liu and P. Wu, ACS Appl. Mater. Interfaces, 2018, 10, 40808–40814 CrossRef CAS PubMed
.
- Y. Miao, S. Liu, L. Ma, W. Yang, J. Li and J. Lv, Anal. Chem., 2021, 93, 4075–4083 CrossRef CAS PubMed
.
- S. Han, G. Lian, X. Zeng, Z. Cao, Q. Wang, D. Cui and C. P. Wong, Nano Res., 2020, 13, 3261–3267 CrossRef CAS
.
- R. Knoblauch, A. Harvey, E. Ra, K. M. Greenberg, J. Lau, E. Hawkins and C. D. Geddes, Nanoscale, 2021, 13, 85–99 RSC
.
- R. Gao, X. Mei, D. Yan, R. Liang and M. Wei, Nat. Commun., 2018, 9, 2798 CrossRef PubMed
.
- L. Xu, K. Zhou, H. Ma, A. Lv, D. Pei, G. Li, Y. Zhang, Z. An, A. Li and G. He, ACS Appl. Mater. Interfaces, 2020, 12, 18385–18394 CrossRef CAS PubMed
.
- F. Wang, Y. H. Chen, C. Y. Liu and D. G. Ma, Chem. Commun., 2011, 47, 3502–3504 RSC
.
- H. Jia, Z. Wang, T. Yuan, F. Yuan, X. Li, Y. Li, Z. Tan, L. Fan and S. Yang, Adv. Sci., 2019, 6, 1900397 CrossRef PubMed
.
- V. D. Dang, A. B. Ganganboina and R. A. Doong, ACS Appl. Mater.Interfaces, 2020, 12, 32247–32258 CrossRef CAS PubMed
.
- H. Lu, C. Li, H. Wang, X. Wang and S. Xu, ACS Omega, 2019, 4, 21500–21508 CrossRef CAS PubMed
.
- L. Zhang, Y. Yang, M. A. Ziaee, K. Lu and R. Wang, ACS Appl. Mater. Interfaces, 2018, 10, 9460–9467 CrossRef CAS PubMed
.
- K. M. Tripathi, H. T. Ahn, M. Chung, X. A. Le, D. Saini, A. Bhati, S. K. Sonkar, M. I. Kim and T. Kim, ACS Biomater. Sci. Eng., 2020, 6, 5527–5537 CrossRef CAS PubMed
.
- Z. Ye, G. Li, J. Lei, M. Liu, Y. Jin and B. Li, ACS Appl. Bio Mater., 2020, 3, 7095–7102 CrossRef CAS PubMed
.
- H. Yan, B. Zhang, Y. Zhang, R. Su, P. Li and W. Su, ACS Appl. Bio Mater., 2021, 4, 6703–6718 CrossRef CAS PubMed
.
- P. Long, Y. Feng, C. Cao, Y. Li, J. Han, S. Li, C. Peng, Z. Li and W. Feng, Adv. Funct. Mater., 2018, 28, 1800791 CrossRef
.
- Y. Gao, H. Zhang, S. Shuang and C. Dong, Adv. Opt. Mater., 2020, 8, 1901557 CrossRef CAS
.
- J. H. Zhu, M. M. Li, S. P. Liu, Z. F. Liu, Y. F. Li and X. Li. Hu, Sens. Actuators, B, 2015, 219, 261–267 CrossRef CAS
.
- B. Zhao and Z. A. Tan, Adv. Sci., 2021, 8, 2001977 CrossRef CAS PubMed
.
- Y. Sun, S. Liu, L. Sun, S. Wu, G. Hu, X. Pang, A. T. Smith, C. Hu, S. Zeng, W. Wang, Y. Liu and M. Zheng, Nat. Commun., 2020, 11, 5591 CrossRef CAS PubMed
.
- S. A. Shaik, S. Sengupta, R. S. Varma, M. B. Gawande and A. Goswami, ACS Sustainable Chem. Eng., 2021, 9, 3–49 CrossRef CAS
.
- K. Holá, M. Sudolská, S. Kalytchuk, D. Nachtigallová, A. L. Rogach, M. Otyepka and R. Zbořil, ACS Nano, 2017, 11, 12402–12410 CrossRef PubMed
.
- S. Wu, R. Zhou, H. Chen, J. Zhang and P. Wu, Nanoscale, 2020, 12, 5543–5553 RSC
.
- M. Sudolská and M. Otyepka, Appl. Mater. Today, 2017, 7, 190–200 CrossRef
.
Footnote |
| † Electronic supplementary information (ESI) available. See https://doi.org/10.1039/d2ra02251f |
| This journal is © The Royal Society of Chemistry 2022 |

