 Open Access Article
Enhanced photocatalytic H2 evolution over covalent organic frameworks through an assembled NiS cocatalyst†
Hualei Zhang *,
Zheng Lin and
Jia Guo
 *
*
State Key Laboratory of Molecular Engineering of Polymers, Department of Macromolecular Science, Fudan University, Shanghai 200433, China. E-mail: 18110440049@fudan.edu.cn; guojia@fudan.edu.cn
First published on 18th May 2022
Abstract
Covalent organic frameworks (COFs) have been investigated in the field of photocatalysts for H2 evolution because of their crystalline structure and diversity. However, most of them need the help of noble metals as co-catalysts to realize a high hydrogen evolution. Herein, we chose typical COFs as a platform and constructed NiSX-BD (X: weight fraction of NiS) composites by assembling NiS at room temperature. The NiS nanoparticles are shown to tightly adhere to the COFs surface. Under visible light irradiation (wavelength > 420 nm), the optimized sample with 3 wt% NiS loading exhibits a photocatalytic H2 evolution rate of 38.4 μmol h−1 (3840 μmol h−1 g−1), which is about 120 folds higher than that of the pure TpBD-COF and better than TpBD-COF/Pt with the same Pt loading (3 wt%). NiS3-BD shows stable hydrogen evolution in at least six consecutive cycle tests totaling 18 h. Further investigation reveals that the loaded NiS can facilitate the transfer of photogenerated electrons from TpBD-COF to the co-catalyst, leading to efficient and high photocatalytic activity. Combining the significant feature of COFs, this study opens up a feasible avenue to boost the photocatalytic H2 performance by constructing the synergetic effects between COFs and cost-effective material.
Introduction
Hydrogen production and storage via photocatalytic water splitting is an attractive means of exploiting sustainable and renewable energy to meet the growing global environmental and socio-economic challenges.1–3 Since the report on photocatalytic hydrogen evolution by TiO2,4 numerous researchers have focused on inorganic semiconductor photocatalysts.5–7 Although most inorganic semiconductors were reported to be active for photocatalytic water splitting, it is still challenging to suppress exciton recombination and narrow the bandgaps of inorganic materials.8Organic polymers have attracted significant attention due to their structural designability and functional diversity. Some representatives, including g-C3N4,9–13 conjugated microporous polymers (CMPs)14 and linear conjugated polymers,15 are promising for photocatalytic H2 evolution from water splitting. However, the majority of organic polymers lack a long-range order and their amorphous or semi-crystalline structure limits their exciton transfer and charge transport to the surface.16,17 Two-dimensional covalent organic frameworks (2D COFs) as an emerging class of crystalline porous polymers can be constructed skillfully from suitable organic building blocks via covalent bonds,18 which enables them to be structurally pre-designable, synthetically controllable, and functionally manageable, showing great promise for water splitting.19–21 The intrinsic advantages of crystalline COFs combined with the photoactivity of functional modules would promise exceptional catalytic performances.22,23 To date, considerable attention has been paid to adjusting the building units or electronic structures of COFs to enhance the hydrogen evolution rate. For example, the hydrophilic sulfone-containing COF exhibits an excellent H2 evolution rate in the presence of Pt and ascorbic acid.24 The stable sp2 C COFs due to the extended π conjugation system have been explored as superior photocatalysts through the functionalized terminals,25 modified linkages,26 or by molecular engineering method27 to improve the light absorbance and promote the exciton migration. Long et al. modified the tunneling effect to improve the COF photoactivity.28,29 Also, our group reported a series of different strategies, e.g., incorporating electron transfer mediators,30 modulating building-block heterogeneity,31 and stabilizing coaxial stacking of COF layers.32 However, most COF-based photocatalysts are challenging to realize high catalytic activity without noble metal co-catalysts, which is conducive to reducing the exciton recombination. An expensive noble co-catalyst is not the best choice for sustainable and economical photocatalysis.33 Therefore, it is of significance to seek alternative metal co-catalysts and maintain photocatalytic performances.
Few photocatalytic systems have incorporated earth-abundant materials, proposed as potential substitutes for noble metals, as the co-catalysts of COFs for hydrogen evolution. The metal complexes evolve as potential alternates for noble metals such as chloro(pyridine)cobaloxime34 and NiME cluster.35 Zhang et al. applied the exfoliated MoS2 nanosheets,36 α-Fe2O3 (ref. 37) and Ni(OH)2 (ref. 38) as cocatalysts of COFs, exhibiting enhanced hydrogen evolution. Along this line, Shi et al. adopted a one-step hydrothermal route to prepare a SnS2/COF heterojunction and facilitate the H2 production kinetics.39 Confining inorganic nanomaterials through the surface area of COFs is an efficient strategy to tune the energy levels and suppress the recombination of the photogenerated carriers. However, harsh reaction conditions such as high temperatures and organic solvents are inevitable for the synthesis and may induce side reactions with organic moieties and produce toxic gas.40
Herein, we prepared a β-ketoenamine-linked COF by the aldimine reaction of 1,3,5-triformylphloroglucinol (Tp) and benzidine (BD) and subsequent enol-to-keto irreversible transformation, resulting in the typical 2D TpBD-COF. Then, a simple and reproducible reaction was conducted at room temperature to locally prepare NiS nanocrystals within TpBD-COF (NiSX-BD, X: wt%). The resulting NiSX-BD composites preserved the high crystallinity and porosity without producing defective or disordered structures in TpBD-COF. Upon exposure to visible irradiation (>420 nm), the photocatalytic activity of NiSX-BD can be significantly enhanced. As the loaded quantity of NiS was optimized, the H2 evolution rate of the composite was higher than those of the parent TpBD-COF and the composite with Pt as the co-catalyst under identical conditions. The photophysical analysis revealed that the improved activity of the hybrid was attributed to the NiS-accelerated separation of photoinduced charge carriers.
Experimental
Synthesis of the TpBD-COF
A Pyrex tube (10 mL) was charged with Tp (21.0 mg, 0.1 mmol), BD (27.6 mg, 0.15 mmol), o-dichlorobenzene (0.9 mL), n-butanol (0.1 mL) and acetic acid aqueous solution (6 M, 0.1 mL). The mixture was sonicated for 10 min, and then, the tube was degassed for three freeze–pump–thaw cycles before sealing. The sealed tube was kept in an oven at 120 °C for 3 days. After the reaction, the mixture was cooled to room temperature. The precipitate was collected by filtration and thoroughly washed with tetrahydrofuran (THF) and acetone several times. The product was extracted by Soxhlet with THF for 1 day and dried under vacuum at 40 °C for 24 h, affording the solid with a yield of 84%.Synthesis of the NiSX-BD
NiAc2 (0.05 M) was dispersed in an aqueous solution containing Na2S (20 mL, 0.1 M) under stirring, and TpBD-COF (0.03 g) was added. After 2 h stirring at room temperature, the precipitate was collected by filtration, washed with distilled water and ethanol three times, and dried at 40 °C for 8 h. The weight ratio of NiS to (TpBD-COF) was 0.5, 1.0, 3.0 and 5.0 (wt%), and the resulting samples were named NiSX-BD, where X represents 0.5, 1, 3, and 5, respectively.Photocatalytic hydrogen evolution
The H2 evolution test under visible light was performed in a Pyrex top-irradiation reaction vessel linked to a glass-closed gas system. H2 production was carried out by dispersing 10 mg of the photocatalyst powder in an aqueous solution (100 mL) containing sacrificial agents (0.1 M Na2S and 0.1 M Na2SO3). The mixture was evacuated several times to remove air completely before irradiation under a 300 W Xe-lamp. The wavelength of the incident light was controlled using an appropriate long-pass cut-off filter (λ ≥ 420 nm). The reaction solution was kept at room temperature by a flow of cooling water filter (10 ± 0.5 °C). The generated gases were injected from labsolar 6A (Beijing Perfectlight Technology Co., Ltd) and analyzed by gas chromatography (Techcomp GC7900) equipped with Argon as the carrier gas. In addition, in the contrast experiment, the photo deposition of Pt (3 wt%) cocatalyst was performed by adding the precursor H2PtCl6·6H2O directly, while other experimental conditions remained unchanged.AQE determination
The apparent quantum efficiency (AQE) for the photocatalytic H2 evolution was measured under the illumination of a 300 W Xe lamp with different bandpass filters (including 400, 420, 500, 550 and 600 nm, λ0 ± 20 nm). Light intensities were tested by an optical power meter (GEL-NP2000, Aulight, China). The AQE values shown in the article are the maximum available results after changing the amounts of photocatalysts. The AQE was calculated according to the below equation:where M is the amount of H2 molecules (mol), NA is the Avogadro constant (6.022 × 10²³ mol−1), ℏ is the Planck constant (6.626 × 10⁻³⁴ J s), c is the speed of light (3 × 10⁸ m s−1), S is the irradiation area (cm2), P is the intensity of irradiation light (W cm−2), t is the photoreaction time (s), and λ is the wavelength of the monochromatic light (m).
Results and discussion
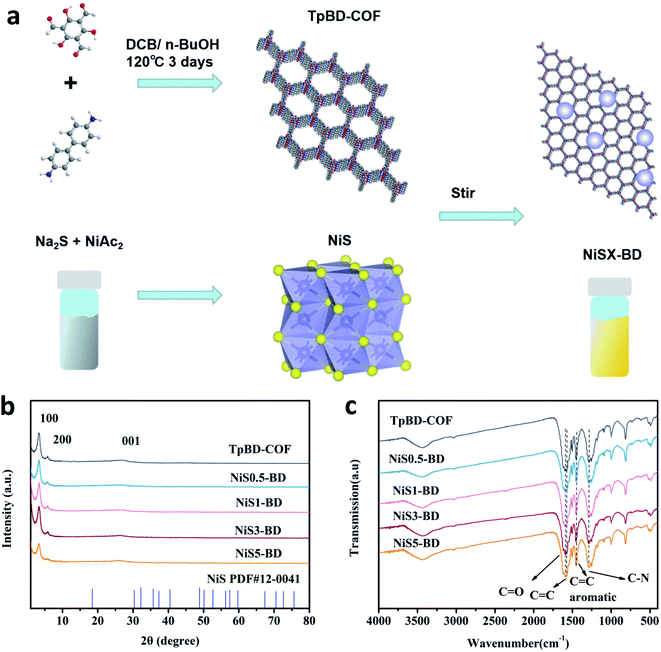
The synthesis of a series of NiSX-BD composites is illustrated in Fig. 1 a. The TpBD-COF was solvothermally prepared according to the previous method.41 Then, the obtained solid was mixed with the solution containing different concentrations of NiAc2 and Na2S. After stirring at room temperature, NiS could be formed on the surface of TpBD-COF. The synthetic process of the samples is shown in Fig. S1.† A variety of characterizations, including powder X-ray diffraction (PXRD), solid-state 13C CP/MAS NMR, and FT-IR spectroscopy, were performed to determine the composition and structure of the resultant NiSX-BD composites. As shown in Fig. 1b, the PXRD patterns of TpBD-COF, NiS, and NiSX-BD display the prominent X-ray diffraction peaks at 3.30°, 5.85°, and 26.30°, all of which are well assigned to the (100), (200), and (001) planes derived from the typical 2D TpBD-COF.41 In addition, the X-ray diffraction signals of NiS could not be found due to the relatively low weight percentages in the composite. In the solid-state 13C CP/MAS NMR spectra (Fig. S2 in ESI†), the primary chemical shifts appeared around 180 and 144 ppm, corresponding to the keto and enamine carbons of TpBD-COF, respectively. In the FT-IR spectra (Fig. 1c), the characteristic bands could be attributed to the stretching vibration of the C![[double bond, length as m-dash]](https://www.rsc.org/images/entities/char_e001.gif) C and C
C and C![[double bond, length as m-dash]](https://www.rsc.org/images/entities/char_e001.gif) O (1594 cm−1), aromatic C
O (1594 cm−1), aromatic C![[double bond, length as m-dash]](https://www.rsc.org/images/entities/char_e001.gif) C (1445 cm−1), and C–N (1255 cm−1) bonds from TpBD-COF. All the findings sufficiently manifest the formation of the β-ketoenamine-linked framework. In addition, the NiSX-BD composites had a similar FT-IR spectra with TpBD-COF, indicative of the stable structure remaining after the deposition of NiS. The material porosity was measured by N2 isotherm sorption at 77 K (Fig. S3 in ESI†). TpBD-COF and NiS3-BD both gave a typical type I isotherm, signifying the micropore character. The Brunauer–Emmett–Teller (BET) surface area of TpBD-COF was as high as 1245 m2 g−1, while it decreased to 1082 m2 g−1 after 3 wt% NiS was loaded in TpBD-COF. The pore-size distributions of TpBD-COF and NiS3-BD were similar to the reported value (Fig. S4 in ESI†).41
C (1445 cm−1), and C–N (1255 cm−1) bonds from TpBD-COF. All the findings sufficiently manifest the formation of the β-ketoenamine-linked framework. In addition, the NiSX-BD composites had a similar FT-IR spectra with TpBD-COF, indicative of the stable structure remaining after the deposition of NiS. The material porosity was measured by N2 isotherm sorption at 77 K (Fig. S3 in ESI†). TpBD-COF and NiS3-BD both gave a typical type I isotherm, signifying the micropore character. The Brunauer–Emmett–Teller (BET) surface area of TpBD-COF was as high as 1245 m2 g−1, while it decreased to 1082 m2 g−1 after 3 wt% NiS was loaded in TpBD-COF. The pore-size distributions of TpBD-COF and NiS3-BD were similar to the reported value (Fig. S4 in ESI†).41
To identify the presence of NiS, the composite was examined by TEM to obtain the details of morphology and lattice structure. As shown in Fig. 2a, TpBD-COF displays a layered stacked structure stemming from the 2D COF character. After the loading of NiS, the morphology of TpBD-COF had no evident change (Fig. 2c). The HR TEM image revealed that inorganic nanoparticles were deposited on TpBD-COF tightly (Fig. 2d). The predominant particle size was determined to be around 2–4 nm. The fringe spacing in the crystalline domain was 0.196 nm, matching the (102) lattice plane of hexagonal NiS.42 An energy-dispersive X-ray spectroscopy (EDX) in the selected area presented that S and Ni elements were uniformly distributed in the COF matrix, validating again that NiS was loaded on TpBD-COF (Fig. 2b).
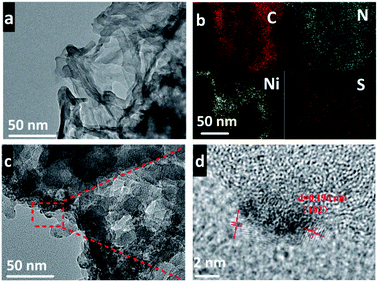 | ||
| Fig. 2 (a) TEM image of TpBD-COF; (b–d) EDX elemental mapping (b), TEM image (c) and HR TEM image (d) of NiS3-BD. | ||
The structure and chemical states of NiS on the surface of TpBD-COF were analyzed by X-ray photoelectron spectroscopy (XPS). In the full survey spectrum, the main elements in the composites were C, N, and O as expected (Fig. S5 in ESI†) and Ni elements could be determined in the NiS3-BD samples. For the TpBD-COF composite sample, the C 1s spectrum exhibit three characteristic peaks at 284.58, 285.9, and 287.5 eV (Fig. 3a), belonging to C–C, C–N, and C![[double bond, length as m-dash]](https://www.rsc.org/images/entities/char_e001.gif) O bonds, respectively. In the N 1s spectra (Fig. 3b), the peak at 399.6 eV is usually attributed to the sp3 hybrid nitrogen C–NH–C, which confirmed the formation of TpBD-COF. Moreover, compared with TpBD-COF, the binding energies of C 1s (C–C) and N 1s of the NiS3-BD sample clearly shifted to a higher region, which may be caused by the change in the chemical state43 or coordination environment44 of Ni 3d. The deconvoluted XPS spectra of S 2p and Ni 2p for NiS3-BD are shown in Fig. 3c and d. The binding-energy peaks at 856.1 and 873.3 eV are attributed to the Ni2+ 2p3/2 and Ni2+ 2p1/2 of NiS, respectively, together with their satellite peaks at 861.6 and 879.4 eV.45 In Fig. 3d, the sulfur signal gives the two single peaks at 168.9 and 164.2 eV, corresponding to the S2− 2p1/2 and 2p3/2 of the NiS3-BD composite.46 From these above-mentioned results, we can infer that NiS is loaded on the TpBD-COF successfully.
O bonds, respectively. In the N 1s spectra (Fig. 3b), the peak at 399.6 eV is usually attributed to the sp3 hybrid nitrogen C–NH–C, which confirmed the formation of TpBD-COF. Moreover, compared with TpBD-COF, the binding energies of C 1s (C–C) and N 1s of the NiS3-BD sample clearly shifted to a higher region, which may be caused by the change in the chemical state43 or coordination environment44 of Ni 3d. The deconvoluted XPS spectra of S 2p and Ni 2p for NiS3-BD are shown in Fig. 3c and d. The binding-energy peaks at 856.1 and 873.3 eV are attributed to the Ni2+ 2p3/2 and Ni2+ 2p1/2 of NiS, respectively, together with their satellite peaks at 861.6 and 879.4 eV.45 In Fig. 3d, the sulfur signal gives the two single peaks at 168.9 and 164.2 eV, corresponding to the S2− 2p1/2 and 2p3/2 of the NiS3-BD composite.46 From these above-mentioned results, we can infer that NiS is loaded on the TpBD-COF successfully.
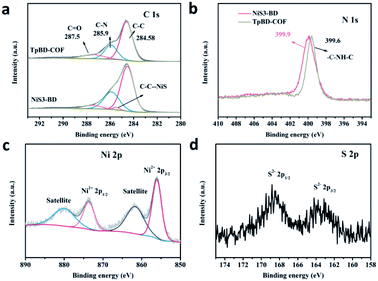 | ||
| Fig. 3 High-resolution XPS spectra of the (a) C 1s region, (b) N 1s region of TpBD-COF and NiS3-BD; (c) Ni 2p region and (d) S 2p region of the NiS3-BD. | ||
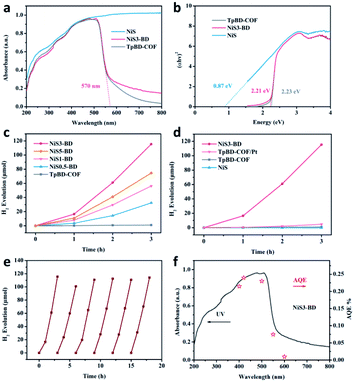
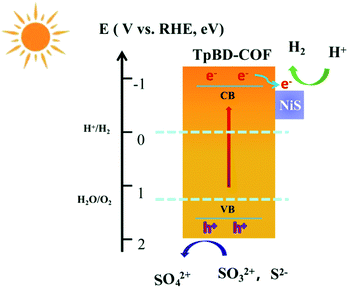
The absorption of TpBD-COF, NiS, and NiSX-BD composites was measured by UV-Vis diffuse reflectance spectroscopy (Fig. 4a and S6 in ESI†). NiS showed complete absorption in the visible window. The TpBD-COF and NiSX-BD had similar absorbance at λ < 550 nm, and their absorption edges were both near 570 nm. The absorbance intensity of NiSX-BD was gradually enhanced after the wavelength of 550 nm. This indicates that the NiS material is only deposited on the surface of TpBD-COF. According to the Tauc equation, the bandgaps for TpBD-COF and NiS3-BD were calculated to be 2.23 and 2.21 eV, respectively (Fig. 4b). Their Mott–Schottky plots were linear with positive slopes, implying that both TpBD-COF and NiS3-BD were n-type semiconductors (Fig. S7 and S8 in ESI†). However, for the NiS composite, a negative one is observed in the M–S plot, indicating a p-type semiconductor behavior (Fig. S9, in ESI†).47 It is thus most likely that p–n junction is not generated between the NiS and TpBD-COF.47 It is known that the Fermi levels are close to their respective CB and VB.45,48 The CB of TpBD-COF, NiS and NiS3-BD were −0.77, −0.52 and −0.71 eV (vs. RHE), respectively. The photogenerated electrons in the conduction band of TpBD-COF would transfer to NiS owing to the potential difference and its intrinsic conductivity.45 With the corresponding optical band gaps, the valence band (VB) positions of TpBD-COF and NiS3-BD were calculated to be 1.46 and 1.50 eV, respectively. Undoubtedly, the CB and VB of TpBD-COF and NiS3-BD satisfy the thermodynamic requirement of photocatalytic water splitting over the photocatalysts.
Photocatalytic hydrogen evolution was evaluated under simulated sunlight (Xenon lamp, λ > 420 nm) with Na2S/Na2SO3 as the optimized sacrificial agents. As shown in Fig. 4c and S10 (ESI†), the average H2 evolution rate (HER) of TpBD-COF was only 0.32 μmol h−1. For the NiSX-BD composite, HER dramatically increased, suggesting that NiS served as an efficient co-catalyst to facilitate the photogenerated exciton dissociation of TpBD-COF. Among the composites, NiS3-BD displayed an optimal HER of 38.4 μmol h−1, approximately 120 folds higher than that of the TpBD-COF. When the loading content of NiS was higher than 3 wt%, a decrease in the HER was observed. This could be explained as the excessive NiS nanoparticles shielding the active sites and reducing light absorption.39 The exact quantity of NiS in the NiSX-BD determined by ICP-AES was consistent with the feeding number of precursors (Table S1 in ESI†). In comparison, we measured the photocatalytic performance of the control sample synthesized by depositing 3 wt% Pt onto TpBD-COF. The result showed that the HER of TpBD-COF/Pt was only 1.58 μmol h−1, far lower than that of NiS3-BD under identical conditions (Fig. 4d, S11 in ESI†). When NiS was used alone, it remained inactive in the H2 generation. According to the result, NiS would be a promising noble free co-catalyst for photocatalytic H2 evolution. As shown in Fig. 4c and d, the evolved H2 quantity is slightly low in the first one hour possibly due to the formed NiS⋯H intermediates consuming several photoexcited electrons without H2 production in the early stage of photocatalysis.49,50
In addition, numerous hole scavengers were tested for photocatalysis with the NiS3-BD composite, including methanol (MeOH), ethanol (EtOH), triethanolamine (TEOA), and ascorbic acid (AA). The corresponding HER values were followed by Na2S/Na2SO3 > AA > TEOA > MeOH = EtOH (Fig. S12 in ESI†), which may be due to the difference in the hole capture efficiency between different hole scavengers.51 To prove the stability and durability of NiS3-BD, the photocatalytic cycling test was examined six times in 18 h under the same conditions. As shown in Fig. 4e, the photocatalytic activity of the NiS3-BD is maintained, indicating the stability of the photocatalyst. FT-IR and UV-Vis analyses of the recycled samples revealed the preservation of the chemical integrity after the long-term irradiation (Fig. S13 and S14 in ESI†). The PXRD patterns of the recycled NiS3-BD displayed a slight decrease in the Bragg peak intensity. Based on the Scherrer equation, the dominant crystallite domain of the recycled NiS3-BD was calculated to be 7.3 nm, quite similar to that of the initial NiS3-BD (7.4 nm), implying that the COF crystallinity was maintained during the long-term photocatalytic experiment (Fig. S15 in ESI†).32 Moreover, the NiS nanoparticles tightly adhered to the recycled NiS3-BD support as observed by the HR TEM images (Fig. S16 in ESI†) and remained unchanged in composition, as evidenced by the XPS results (Fig. S17 in ESI†). The apparent quantum efficiency (AQE) of the NiS3-BD was examined using monochromatic light (λ = 400, 420, 500, 550, and 600 nm) irradiation, nicely coinciding with the light absorption curve (Fig. 4f). It indicates that the H2 evolution is indeed driven via light irradiation. The maximum AQE for NiS3-BD was 0.24% at 420 nm, comparable to that reported in COF-based photocatalysts (Table S2 in ESI†). We also measured the FT-IR spectroscopy for TpBD-COF after being immersed in different sacrificial agents with sacrificial agents for 2 days and all the samples exhibited negligible changes in the peak position and intensity indicating the high chemical stability of TpBD-COF under this situation (Fig. S18 in ESI†).
Photocatalytic mechanism studies of NiS3-BD
To investigate the possible mechanism of the enhanced photocatalytic activity of NiS3-BD, a series of measurements were conducted. First of all, the effects of NiS on the photogenerated charge separation was determined by photoluminescence (PL) emission spectroscopy.52 As shown in Fig. 5a, the PL intensity of NiS3-BD is much lower than that of the TpBD-COF, indicating rapid charge transfer between NiS and TpBD-COF components in the composite. The average radiative lifetimes (τavg) of the photoexcited charge carriers were measured by time-resolved PL spectra. It can be seen that the fluorescence lifetime of TpBD-COF (τ = 1.05 ns) was lower than that of NiS3-BD (τ = 1.99 ns), which proved again that the loaded NiS prolonged the lifetime of charge carriers (Fig. 5b). The internal resistances of the samples during the charge transfer process were estimated by electrochemical impedance spectroscopy (EIS). As shown in Fig. 5c, the Nyquist semicircle diameter of NiS3-BD is smaller than that of TpBD-COF. The result signifies the lower interfacial charge transport resistance after loading NiS within the TpBD-COF. Upon exposure to the on–off cycle irradiation of visible light, NiS3-BD had a higher photocurrent than TpBD-COF (Fig. 5d), manifesting that NiS enhanced the separation efficiency of electron–hole pairs and prolonged the photogenerated charge lifetimes. All the findings disclose that the well-dispersed NiS nanoparticles on TpBD-COF can facilitate electron transfer and reduce exciton recombination for H2 production.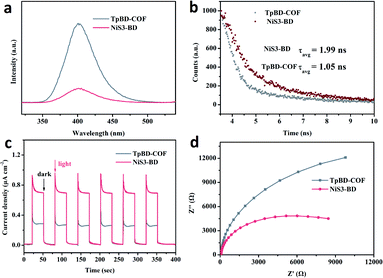 | ||
| Fig. 5 Steady-state PL emission spectra (λex = 400 nm) (a); time-resolved PL spectra (b); transient photocurrent responses (c); and Nyquist plots (d) of the TpBD-COF and NiS3-BD, respectively. | ||
Mechanism of photocatalytic H2 evolution
With all this in mind, we address a possible mechanism of the NiS-mediated photocatalysis over TpBD-COF, as displayed in Scheme 1. Upon visible light irradiation, the photoinduced electrons at the CB of TpBD-COF are generated to remain in the holes at the VB. Without the incorporation of NiS, the electron/hole pairs in TpBD-COF can undergo rapid recombination due to the strong electrostatic interaction compromising the photocatalytic performance. For the NiSX-BD composite, the photoexcited electrons of TpBD-COF could be easily transferred and accumulate on the NiS surface, wherein the adsorbed H+ ions are effectively reduced to H2.53 Moreover, the photogenerated holes at the VB of TpBD-COF are extracted by the sacrificial agent. Therefore, the NiS3-BD composite optimizes the transfer pathway of photogenerated electrons and diminishes the exciton recombination, significantly improving photocatalytic performance.Conclusions
In summary, we report an in situ mild and controllable method to fabricate the NiS-loaded TpBD-COF hybrid. The obtained composite exhibits excellent photocatalytic performance for hydrogen evolution. The confined NiS nanoparticles act as the co-catalyst to play an essential role in the exciton dissociation and electron transfer. When the loading content is optimized at 3 wt%, the corresponding hydrogen production rate reaches a maximum of 38.4 μmol h−1, roughly 120 and 24 times higher than those of the TpBD-COF and the composite with 3 wt% Pt as co-catalyst under the same conditions, respectively. Remarkably, the role of NiS can be actively executed based on TpBD-COF, which not only harvests solar light but also provides an extensive interface for the NiS-mediated separation and migration of the photogenerated carriers. Our work offers a feasible method to develop synergistic photocatalytic mechanisms between COFs and inorganic materials.Conflicts of interest
The authors declare no competing interests.Acknowledgements
This work is supported by the National Natural Science Foundation of China (Grants No. 51973039, 52173197).References
- G. F. Liao, C. X. Li, S. Y. Liu, B. Z. Fang and H. Yang, Trends Chem., 2021, 4, 111–127 CrossRef.
- X. Jiang, Y. X. Chen and C. Z. Lu, Chin. J. Struct. Chem., 2020, 39, 2123–2130 CAS.
- C. X. Li, G. F. Liao and B. Z. Fang, Chem. Catal., 2022, 2, 238–241 CrossRef.
- A. Fujishima and K. Honda, Nature, 1972, 238, 37–38 CrossRef CAS PubMed.
- G. F. Liao, X. Y. Tao and B. Z. Fang, Matter, 2022, 5, 377–379 CrossRef CAS.
- P. Shandilya, S. Sambyal, R. Sharma, P. Mandyal and B. Z. Fang, J. Hazard. Mater., 2022, 428, 128218 CrossRef CAS PubMed.
- J. Y. Zhang, H. G. Liao and S. G. Sun, Chin. J. Struct. Chem., 2020, 39, 1019–1028 CAS.
- J. Wen, J. Xie, X. Chen and X. Li, Appl. Surf. Sci., 2017, 391, 72–123 CrossRef CAS.
- X. C. Wang, K. Maeda, J. M. Carlsson, K. Domen and M. Antonietti, Nat. Mater., 2009, 8, 76–80 CrossRef CAS PubMed.
- G. F. Liao, C. X. Li, X. Z. Li and B. Z. Fang, Cell Rep. Phys. Sci., 2021, 2, 100355 CrossRef CAS.
- Y. P. Liu, G. Xu, D. D. Ma, Z. G. Li, Z. Z. Yan, A. Xu, W. Zhong and B. Z. Fang, J. Cleaner Prod., 2021, 328, 129745 CrossRef CAS.
- Y. P. Liu, S. J. Shen, Z. G. Li, D. D. Ma, G. Xu and B. Z. Fang, Mater. Charact., 2021, 174, 111031 CrossRef CAS.
- G. F. Liao, Y. Gong, L. Zhang, H. Y. Gao, G. J. Yang and B. Z. Fang, Energy Environ. Sci., 2019, 12, 2080–2147 RSC.
- R. S. Sprick, C. J. Jiang, B. Bonillo, S. J. Ren and T. Ratvijitvech, J. Am. Chem. Soc., 2015, 137, 3265–3270 CrossRef CAS PubMed.
- C. Yang, B. C. Ma, L. Zhang, S. Lin, S. Ghasimi, K. Landfester, K. Zhang and X. C. Wang, Angew. Chem., 2016, 55, 9202–9206 CrossRef CAS PubMed.
- G. Zhang, G. Li, Z. A. Lan, L. Lin, A. Savateev, T. Heil, S. Zafeiratos, X. C. Wang and M. Antonietti, Angew. Chem., 2017, 56, 13445–13449 CrossRef CAS PubMed.
- L. Li and Z. Cai, Polym. Chem., 2016, 7, 4937–4943 RSC.
- H. X. Lin, C. P. Chen, T. H. Zhou and J. Zhang, Sol. RRL, 2021, 5, 2000458 CrossRef CAS.
- K. Y. Geng, T. He, R. Y. Liu, S. Dalapati and K. T. Tan, Chem. Rev., 2020, 120, 8814–8933 CrossRef CAS PubMed.
- G. B. Wang, S. Li, C. X. Yan, F. C. Zhu and Q. Q. Lin, J. Mater. Chem., 2020, 8, 6957–6983 RSC.
- S. H. Wu, Y. Pan, H. Lin, L. Li, X. Z. Fu and J. L. Long, ChemSusChem, 2021, 14, 4958–4972 CrossRef CAS PubMed.
- H. Wang, Z. W. Wang, L. Tang and Z. G. Zeng, Chem. Soc. Rev., 2020, 49, 4135–4165 RSC.
- L. Stegbauer, K. Schwinghammer and B. V. Lotsch, Chem. Sci., 2014, 5, 2789–2793 RSC.
- X. Y. Wang, L. J. Chen, M. A. Zwijnenburg, R. S. Sprick and A. I. Cooper, Nat. Chem., 2018, 10, 1180–1189 CrossRef CAS PubMed.
- E. Q. Jin, Z. A. Lan, Q. H. Jiang, X. C. Wang and D. L. Jiang, Chem, 2019, 5, 1632–1647 CAS.
- S. Bi, C. Yang, W. Zhang, X. C. Wang and F. Zhang, Nat. Commun., 2019, 10, 2467 CrossRef PubMed.
- T. Huang, X. Lin, Y. Liu and J. L. long, ChemSusChem, 2020, 13, 672–676 CrossRef CAS PubMed.
- J. T. Ming, A. Liu, J. W. Zhao, P. Zhang, H. W. Huang, H. Lin, M. B. J. Roeffaers and J. L. Long, Angew. Chem., 2019, 58, 18290–18294 CrossRef CAS PubMed.
- H. Lin, Z. Y. Ma, J. Zhao, Y. Liu, X. X. Wang, X. Z. Fu and J. L. Long, Angew. Chem., 2021, 60, 1235–1243 CrossRef CAS PubMed.
- Z. Mi, T. Zhou, W. Weng, J. Unruangsri, K. Zhang and J. Guo, Angew. Chem., 2021, 60, 9642–9649 CrossRef CAS PubMed.
- T. Zhou, X. Huang, Z. Mi, Y. Zhu, C. C. Wang and J. Guo, Polym. Chem., 2021, 12, 3250–3256 RSC.
- T. Zhou, L. Wang, X. Y. Huang, H. X. Xu and J. Guo, Nat. Commun., 2021, 12, 3934 CrossRef CAS PubMed.
- N. Cheng, S. Stambula, D. Wang, M. N. Banis, J. Liu, A. Riese, B. Xiao, R. Li, T. K. Sham, L. M. Liu, G. A. Botton and X. Sun, Nat. Commun., 2016, 7, 13638 CrossRef CAS PubMed.
- K. Gottschling, G. Savasci, H. V. González, S. Schmidt, P. Mauker, T. Banerjee, P. Rovó, C. Ochsenfeld and B. V. Lotsch, J. Am. Chem. Soc., 2020, 142, 12146–12156 CrossRef CAS PubMed.
- B. P. Biswal, G. H. Gonzalez, T. Banerjee, L. Grunenberg and G. Savasci, J. Am. Chem. Soc., 2019, 141, 11082–11092 CrossRef CAS PubMed.
- M. Y. Gao, C. C. Li, H. L. Tang, F. M. Zhang, X. J. Sun and H. Dong, J. Mater. Chem., 2019, 7, 20193–20200 RSC.
- Y. P. Zhang, H. L. Tang, H. Dong, M. Y. Gao, C. C. Li, Z. J. Li and F. M. Zhang, J. Mater. Chem. A, 2020, 8, 4334–4340 RSC.
- H. Dong, X. B. Meng, X. Zhang, H. L. Tang, J. W. Liu, F. M. Zhang, L. L. Bai and X. J. Sun, Chem. Eng. J., 2020, 379, 122342 CrossRef CAS.
- D. Shang, D. Li, B. Chen, B. Luo, Y. Huang and W. Shi, ACS Sustainable Chem. Eng., 2021, 9, 14238–14248 CrossRef CAS.
- Z. Chen, P. Sun, B. Fan, Z. Zhang and X. Fang, J. Phys. Chem. C, 2014, 118, 7801–7807 CrossRef CAS.
- R. Wang, W. Kong, T. Zhou, C. C. Wang and J. Guo, Chem. Commun., 2021, 57, 331–334 RSC.
- X. Shi, S. Kim, M. Fujitsuka and T. Majima, Appl. Catal., B, 2019, 254, 594–600 CrossRef CAS.
- Y. Fang, R. Liu, S. Dou, Q. Shang, D. Wang, X. Kong and J. Liu, Int. J. Hydrogen Energy, 2022, 47, 7724–7737 CrossRef CAS.
- L. Li, D. Yin and X. D. Guo, New J. Chem., 2021, 45, 15789–15800 RSC.
- X. Liu, C. Bie, B. He, B. Zhu, L. Zhang and B. Cheng, Appl. Surf. Sci., 2021, 554, 149622 CrossRef CAS.
- S. T. Bai, X. Shi, M. Liu, H. Huang, J. Zhang and X. H. Bu, RSC Adv., 2021, 11, 38120–38125 RSC.
- S. D. Guan, X. L. Fu, Y. Zhang and Z. J. Peng, Chem. Sci., 2018, 9, 1574–1585 RSC.
- L. F. Schneemeyer and M. S. Wrighton, J. Am. Chem. Soc., 1979, 101, 6496–6500 CrossRef CAS.
- W. Zhang, Y. B. Wang, Z. Wang, Z. Y. Zhong and R. Xu, Chem. Commun., 2010, 46, 7631–7633 RSC.
- N. A. Assunção, M. J. de Giz, G. Tremiliosi-Filho and E. R. Gonzalez, J. Electrochem. Soc., 1997, 144, 2794–2800 CrossRef.
- Y. Wei, G. Cheng, J. Xiong, J. Zhu, Y. Gan, M. Zhang, Z. Li and S. Dou, J. Energy Chem., 2019, 32, 45–56 CrossRef.
- H. Zhang, Q. Lin, S. Ning, Y. Zhou, H. Lin, J. Long, Z. Zhang and X. Wang, RSC Adv., 2016, 6, 96809–96815 RSC.
- D. V. Markovskaya, E. A. Kozlova, S. V. Cherepanova, P. A. Kolinko, E. Y. Gerasimov and V. N. Parmon, ChemPhotoChem, 2017, 1, 575–581 CrossRef CAS.
Footnote |
| † Electronic supplementary information (ESI) available: Solid-state 13C NMR spectrum, N2 sorption isotherms, pore-size distributions, XPS survey spectrum, Mott–Schottky plots. See https://doi.org/10.1039/d2ra02236b |
| This journal is © The Royal Society of Chemistry 2022 |


