DOI:
10.1039/D2RA02223K
(Paper)
RSC Adv., 2022,
12, 17362-17378
Magnetic properties, magnetocaloric effect, and critical behaviors in Co1−xCrxFe2O4
Received
5th April 2022
, Accepted 31st May 2022
First published on 13th June 2022
Abstract
This research work focuses on the magnetic properties, nature of the magnetic phase transition, magnetocaloric effect, and critical scaling of magnetization of various Co1−xCrxFe2O4 (x = 0, 0.125, 0.25, 0.375, and 0.5). The tunability of the magnetic moment, exchange interactions, magnetocrystalline anisotropy constant, and microwave frequency using Cr3+ content has been found. The nature of the magnetic phase transitions for all the Cr3+ concentrations exhibits as second order which has been confirmed from the analysis of critical scaling, universal curve scaling, and scaling analysis of the magnetocaloric effect. The critical exponent analysis for all samples was performed from the modified Arrott-, and Kouvel–Fisher-plots. These critical analyses suggest that x = 0.125, 0.250, and 0.375 samples show reliable results in the magnetocaloric effect with relative cooling power (RCP) values in the range of 128–145 J kg−1. On the other hand, x = 0.00, and 0.500 samples exhibit inconsistent RCP values. The universal curve scaling also confirms the reliability of the magnetocaloric effect of the investigated samples.
1 Introduction
Over the past few decades, research on iron oxide compounds like spinel ferrite, hexaferrite, and garnet has become a topic of discussion among scientists, due to their attractive practical applications in magneto-sensing devices, and biotechnology.1–7 These key topics attracted scientists because these types of compounds exhibit unique magnetic and magnetocaloric effects (MCE).1–3,8–10 Among all the ferrites, CoFe2O4 (COF) has been focused on in recent years by academia, the medical sector, and industry due to its remarkable magnetic and MCE properties.11–19 The structural, magnetic, and MCE properties of COF can be tuned by doping/substituting divalent or trivalent cations.11,18–24 The tunability of structural parameters due to Cr3+ substitution in stoichiometric and non-stoichiometric COF is reported in our earlier literature.25 It was observed that there are structural defects due to Cr3+ substitution. In recent years, a large number of articles have been found on the study of magnetic field (H) and temperature (T) dependent magnetization (M) of various ferrites.1,4,26,27 Massoudi et al. have observed the non-collinear model on Ni–Zn–Al ferrite by comparing the theoretical and experimental magnetic moment calculated from the cation distribution and M–H hysteresis curve, respectively.1 The paramagnetic moment followed by the Curie–Weiss law and magnetic phase transition temperature has been studied from the field cooled (FC) and zero fields cooled (ZFC) magnetization.23,28 Spinel ferrites also attracted scientists across the world due to their interesting MCE properties.4,29–32 The MCE is an intrinsic thermodynamic property of magnetic materials that causes a change in the temperature of the substance under the action of a magnetic field.33 In various literature, the MCE of such materials has been studied from the isothermal M–H over a wide temperature range near the magnetic phase transition.4,34 The MCE values have been calculated from the change of magnetic entropy from the isothermal M–H curve based on Maxwell's thermodynamic relation.34,35 The nature of magnetic phase transition has also been reported in various literature extracted from the isothermal M–H curves using the Arrott plot,36 and the Arrott–Noakes model.37 Law et al. have studied the nature of magnetic phase transition by calculating a critical exponent n from the change of entropy as a function of temperature.38 Various reports have been conducted on the analysis of critical exponents to confirm the universal class of materials.32,34 Franco et al. have first reported the phenomenological universal scaling curve taking the normalized entropy change as a function of rescaled temperature.39
In this research, the effect of Cr3+ substitution on magnetic and MCE properties of various Co1−xCrxFe2O4 (x = 0, 0.125, 0.25, 0.375, and 0.5) have been studied. A detailed investigation of magnetic properties has been carried out by analyzing the M–H hysteresis and FC-ZFC magnetization behaviors. The MCE properties of Cr3+ substituted cobalt ferrite have been investigated by analyzing the M–H isotherms. The nature of magnetic phase transition has also been examined by analyzing the Arrott plot. The nature of the universal class of these materials has been analyzed by calculating the critical exponent followed by the modified Arrott plot (MAP), the Kouvel–Fisher method, and critical isotherm analysis. Finally, the reliability of the MCE properties and universal class have been studied in detail using as usual methods.
2 Experimental
The nominal chemical compositions Co1−xCrxFe2O4 (x = 0, 0.125, 0.25, 0.375, and 0.5) have been synthesized by the standard solid–state reaction technique. The stoichiometric amount of Co2O3 (98.0%), Cr2O3 (99.9%), and Fe2O3 (96.0%) have been mixed in a mortar with a pestle. After completing the mixing process for 2 hours for each composition, the mixtures were crushed using a planetary ball mill (MSK-SFM-1) for 12 h. To complete the solid–state reaction the milled powder has been calcined at 800 °C for 6 h. Then the calcined powder of each composition has been pressed in the form of a pellet using a uniaxial pressure of 16![[thin space (1/6-em)]](https://www.rsc.org/images/entities/char_2009.gif) 000 psi and then sintered at 1200 °C for 6 h. Then a part of sintered pellets was re-crushed into fine powder for performing X-ray diffraction (XRD) to confirm the formation of spinel-type ferrite. The results of phase formation have been reported elsewhere.25 After confirming the formation of spinel-type ferrites, these compositions are subjected to further investigation of their magnetic properties. The FC and ZFC magnetization were performed for the measurement of the phase transition temperature. The M–H hysteresis loop measurements were performed at room temperature for saturation magnetization and other relevant parameters, The M–H isotherms at a various temperatures above and below the magnetic phase transition for each composition have been conducted by using Quantum Design MPMS3 SQUID magnetometer. Then the MCE properties and critical scaling have been analyzed for each composition using standard method described in Section 3.4.
000 psi and then sintered at 1200 °C for 6 h. Then a part of sintered pellets was re-crushed into fine powder for performing X-ray diffraction (XRD) to confirm the formation of spinel-type ferrite. The results of phase formation have been reported elsewhere.25 After confirming the formation of spinel-type ferrites, these compositions are subjected to further investigation of their magnetic properties. The FC and ZFC magnetization were performed for the measurement of the phase transition temperature. The M–H hysteresis loop measurements were performed at room temperature for saturation magnetization and other relevant parameters, The M–H isotherms at a various temperatures above and below the magnetic phase transition for each composition have been conducted by using Quantum Design MPMS3 SQUID magnetometer. Then the MCE properties and critical scaling have been analyzed for each composition using standard method described in Section 3.4.
3 Results and discussion
3.1 Structural analysis
The all samples of Co1−xCrxFe2O4 exhibit single-phase cubic spinel structure with a space group of Fd![[3 with combining macron]](https://www.rsc.org/images/entities/char_0033_0304.gif) m. The details of crystal structure, with cation distribution, have been explored, and results are already published in ref. 25.
m. The details of crystal structure, with cation distribution, have been explored, and results are already published in ref. 25.
3.2 Magnetic properties
The saturation magnetization (Ms), remanent magnetization (Mr), and coercivity (Hc) are the most important parameters for a material to know its magnetic behavior. In general magnetization vs. applied magnetic field (M–) hysteresis loop provide a reliable information about Ms, Mr, and Hc. The M–H hysteresis loops for all samples have been illustrated in Fig. 1(a). From M–H hysteresis loops the values of Ms, Mr, and Hc are extracted and listed in Table 1. From the Table 1, it evident that there is a decreasing trend of Ms with increasing Cr3+ content. However, Hc and Mr show the increasing trend up to x = 0.375 then it decreases for further increase of x. The decreasing trend of Ms may be due to the abnormal grain growth and pore blockage. The increasing trend of Hc is perhaps due to the decrease in crystallite size (D) as calculated from the XRD data.25 For x = 0.500, the Hc value does not shows the corresponding behavior as crystallite size which may be due to the excess ion as explained in the literature. To know the inter-grain exchange mechanism, the calculation of remanence ratio R (= Mr/Ms) is most important. The calculated R values (Table 1) show less than 0.5 which indicates the existence of magnetic dipole interaction with random orientation.40 According to Stoner–Wohlfarth theory, the anisotropy constant (K) value is related to the coercivity has been calculated using the following expression:41| |
 | (1) |
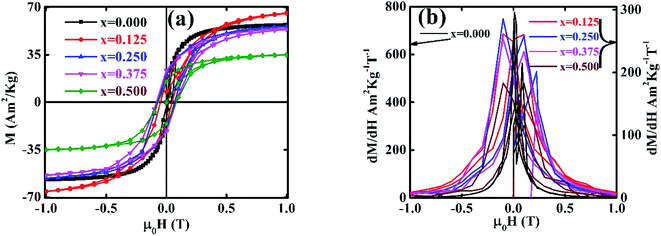 |
| | Fig. 1 (a) The room temperature M–H hysteresis loops for various Co1−xCrxFe2O4. (b) The dM/dH versus H plots for various Co1−xCrxFe2O4. | |
Table 1 Magnetic parameters obtained from M–H hysteresis loops, and M–T curve for various Co1−xCrxFe2O4
| Various parameters |
x |
| 0.000 |
0.125 |
0.250 |
0.375 |
0.500 |
| θcw (K) |
636 |
720 |
710 |
707 |
810 |
| C |
2.46 |
1.15 |
0.89 |
0.84 |
0.35 |
| TC (K) |
675 |
740 |
735 |
731 |
687 |
| TB (K) |
631 |
685 |
680 |
677 |
671 |
| Ms (A m2 kg−1) |
58 |
70 |
59 |
57 |
37 |
| Mr (A m2 kg−1) |
01 |
19 |
20 |
23 |
15 |
| Hc (T) |
0.02 |
0.05 |
0.07 |
0.08 |
0.07 |
| K (J m−3) |
1.44 |
3.6 |
4.2 |
4.6 |
2.2 |
| σw (J) |
6 × 10⁻⁶ |
9 × 10⁻⁶ |
10 × 10−6 |
11 × 10−6 |
8 × 10⁻⁶ |
| Dm (nm) |
78 |
33 |
32 |
31 |
26 |
| R |
0.02 |
0.268 |
0.273 |
0.277 |
0.306 |
| MA (μB) |
5.8 |
5.7 |
5.6 |
5.5 |
5.4 |
| MB (μB) |
10.01 |
10.07 |
10.17 |
10.25 |
10.34 |
| nB (μB) |
2.45 |
2.94 |
2.45 |
2.37 |
1.51 |
| nth (μB) |
4.23 |
4.37 |
4.56 |
4.74 |
4.95 |
| μexpeff (μB) |
4.43 |
3.03 |
2.66 |
2.59 |
1.71 |
| αYK (deg.) |
35 |
31 |
38 |
40 |
48 |
| J (J k−1) |
1.55 × 10⁻²¹ |
1.7 × 10⁻²¹ |
1.69 × 10⁻²¹ |
1.68 × 10⁻²¹ |
1.58 × 10⁻²¹ |
| ωm (GHz) |
12.9 |
15.6 |
13.0 |
12.6 |
8.1 |
The calculated K values for all the Cr concentrations are tabulated in Table 1. It is observed from the Table 1 that K values increase with increasing Cr content up to x = 0.375, indicating the increase of domain wall energy. Then it shows the decreasing value which may be due to the excess ions showing negative values of the vacancy parameter as explained in the literature.25 The domain wall energy (σw) can be calculated using the following expression:42
| |
 | (2) |
where
kB is Boltzmann constant,
TC is Curie temperature and
a is the lattice constant. The calculated domain wall energy for all samples has been tabulated in
Table 1. From
Table 1 the values for
σw are found to be increasing with the increase of Cr content up to
x = 0.375 then it shows a decreasing trend.
To know the domain type of materials, the illustration of the dM/dH versus H plot is most important.40 The dM/dH versus H for all samples have been depicted in Fig. 1(b). Multiple broad peaks near the zero magnetic field observed for all samples indicate multi magnetic domain. To know the agreeable domain nature, determination of critical size by using the following expression is most important:43
| |
 | (3) |
where,
MSP is spontaneous magnetization. For all samples
Dm (
Table 1) shows a lower value than the calculated
D values from XRD,
25 which follows the particle spherical model. The
Dm <
D for all samples reveals that the nanocrystallites have an incipient structure of magnetic domains.
43
The cation distribution results as presented in our previous article25 clearly indicate that both Co2+ and Co3+ occupy the tetrahedral (A) and octahedral (B) sites, respectively whereas Fe3+ occupied both the A- and B-sites for x = 0. However, for x = 0.125 to 0.500, the Cr3+ is found in both the A- and B-sites in place of Co2+ and Co3+, respectively. The calculated magnetic moment MA and MB for A- and B-sites are tabulated in Table 1. From Table 1 the values of MA are found to be decreasing with an increase of Cr3+ which is due to the less magnetic moment of Cr3+ (3.87 μB) than Co2+ (4.87 μB). But the values of MB are found to be increasing due to an increase of Fe3+ with a magnetic moment of 5.92 μB. The net theoretical magnetic moment calculated by using nth = MB − MA relation accordingly to Néel's co-linear model is tabulated in Table 1. From Table 1, it is observed that the net magnetic moment show an increasing trend which shows inconsistency with the experimental Ms. To know the reason behind the inconsistency the experimental number of Bohr magneton (nB) is calculated from the value of Ms using the following expression:1
| |
 | (4) |
where,
M is the molecular weight. The calculated values of
nB are also tabulated in
Table 1, where lower values of
nB compared to that of
nth are evident which suggests that Néel's collinear model is not agreeable for the synthesized samples. For this reason, Yafet–Kittel (YK) non-collinear model is considered to explain the deviation between
nth and
nB. According to the YK non-collinear model, the Yafet–Kittel angle (
αYK) can be calculated using the following equation:
1| |
 | (5) |
The αYK values for all the samples are found to be in the range of 30 to 50° (Table 1) which confirms the non-collinear spin structure that indicates triangular spin arrangement in the B-sites. The lower values of Cr3+ substitution indicate the decreasing trend of αYK but at higher values of Cr3+ enhance the αYK. Although decreasing and increasing trends are evident but they do not show zero αYK. Therefore, the nonzero YK angle suggest that synthesized samples show YK magnetic ordering. The variation of αYK with Cr concentration also support the change in Curie temperature (TC) as evident from Fig. 2.
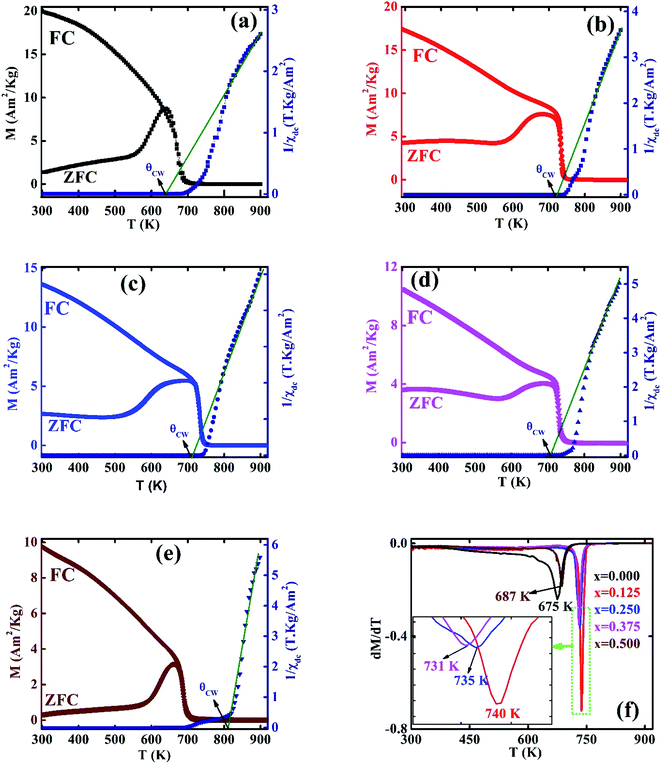 |
| | Fig. 2 The temperature dependence of FC and ZFC magnetization (left axis) and the inverse susceptibility (right axis) for various Co1−xCrxFe2O4 (a) x = 0.0, (b) x = 0.125, (c) 0.25, (d) 0.375, and (e) x = 0.500. (f) The dM/dT vs. T plots for various Co1−xCrxFe2O4. | |
The FC and ZFC magnetization plots for all samples were recorded in the presence of 10 mT field in the temperature range of 300–900 K as shown in Fig. 2 (a–e left Y axis). It is evident that the magnetization (M) value in case of ZFC increases up to maximum at a certain temperature for all samples called blocking temperature (TB) then it shows a decreasing trend with an increase of temperature while the FC magnetization decreases very slowly up to TC, then a sharp fall is observed for both cases. The values of TB of all samples are tabulated in Table 1 where maximum TB value is observed for x = 0.125. To know the exact TC values dM/dT vs. T graphs are illustrated in Fig. 2(f), where a single peak for all samples confirms the single transition at TC without showing any spin frustration. The TC values are presented in Table 1. It is observed that TC show a maximum for x = 0.125. With an increase in Cr content, there is a decrease in TC values. The variation of TC values and αYK angles of these comositions may be explained by the increasing and decreasing trend of calculated exchange interaction (J) using the following equation:
| |
 | (6) |
where
z is the coordination number (= 12) and
s = ½. The values of
J are presented in
Table 1.
The inverse magnetic susceptibility (χ−1) as a function of temperature (T) is depicted in Fig. 2 (a–e right Y axis) for all samples. From Fig. 2(a–e) it is found that the χ−1 rises sharply when the magnetic state changes from the ferromagnetic to paramagnetic. In the paramagnetic region, susceptibility data follow the Curie–Weiss (CW) expression34
| |
 | (7) |
where
C is the Curie constant which can be obtained from the slope of the linear fit of
χ−1 vs. T graph (
Fig. 2) and
ΘCW is the CW temperature that also can be obtained from
Fig. 2. The calculated values of
C, and the estimated values of
ΘCW from the graphs are listed in
Table 1. The estimated values
ΘCW are found to be lower than that of
TC for the compositions up to
x = 0.375 which corresponds to the presence of long-range order. However, for
x = 0.500 the value of
ΘCW is found to be a larger than that of
TC which corresponds to the short-range order which may originate from the excess ion. The experimental effective magnetic moment has been calculated by using
C values according to the following expression:
1| |
 | (8) |
The calculated values of μexpeff are tabulated in Table 1 where the decreasing trend of μexpeff with an increase of Cr content has been observed. The decrease in μexpeff with the increase of Cr3+ content may refer to the decrease in ferromagnetic clusters present in the paramagnetic phase.2
The microwave frequency (ωm) is an important parameter for any materials for high-frequency microwave applications. The ωm can be evaluated by using the following expression:1,2
where
γ1 is the gyromagnetic ratio (
γ1 = 2.8 MHz Oe
−1). The calculated
ωm values are tabulated in
Table 1, where maximum value is observed for
x = 0.125. The calculated
ωm values are in the range of 8.1–15.6 GHz which is higher than that of previously reported values.
1,2 Thus, it is affirmed that synthesized compositions may be a good candidate for high-frequency microwave applications such as satellite communications and biomedical applications.
44
3.3 Critical scaling
3.3.1 Modified Arrott plot. The critical analysis is most important for any inorganic material close to the phase transition. The critical behavior has been conducted by measuring the magnetization isotherms (M–H) close to the respective TC following the procedure described in ref. 4 and 34. The M–H isotherms for all samples are illustrated in Fig. 3. The non-linear M–H behavior below TC confirms the compositions are ferromagnetic (FM), and the linear M–H behavior above TC confirms paramagnetic (PM) nature. Based on the Landau theory, the Gibbs free energy can be written as.45| |
 | (10) |
where, A1, A2, and A3 are Landau co-efficient. Neglecting the higher-order terms the above equation can be written as | |
 | (11) |
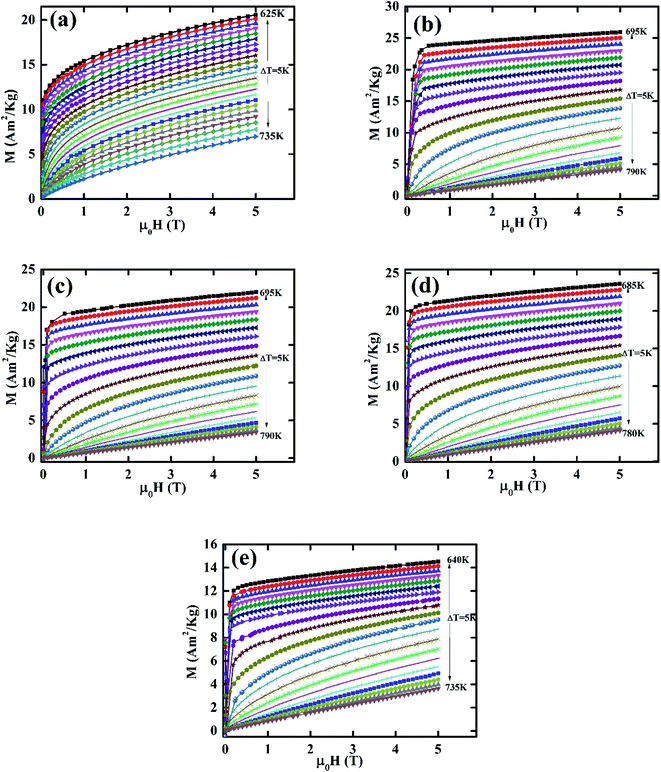 |
| | Fig. 3 M–H isotherm for various Co1−xCrxFe2O4. (a) x = 0.0, (b) x = 0.125, (c) 0.25, (d) 0.375, and (e) x = 0.500. | |
At the equilibrium condition,  ; then the magnetic equation of state can be written as
| |
 | (12) |
The nature of FM–PM phase transition may be determine from the M2 vs. μ0H/M, known as Arrott plot.36 The Arrott plots for all samples are depicted in Fig. 4. No negative slope has been found in Fig. 4, which confirms the second-order phase transition. It is worth noting that M2 versus μ0H/M plot should follow the equation of straight line passes through the origin. However, the above-mentioned behavior is not observed for all samples. Therefore, further analysis is performed for assumed second-order FM-PM phase transition using modified Arrott plots (MAP) according to Arrott–Noakes37 as mentioned by the following expression:
| |
 | (13) |
where
β, and
γ are the critical exponents.
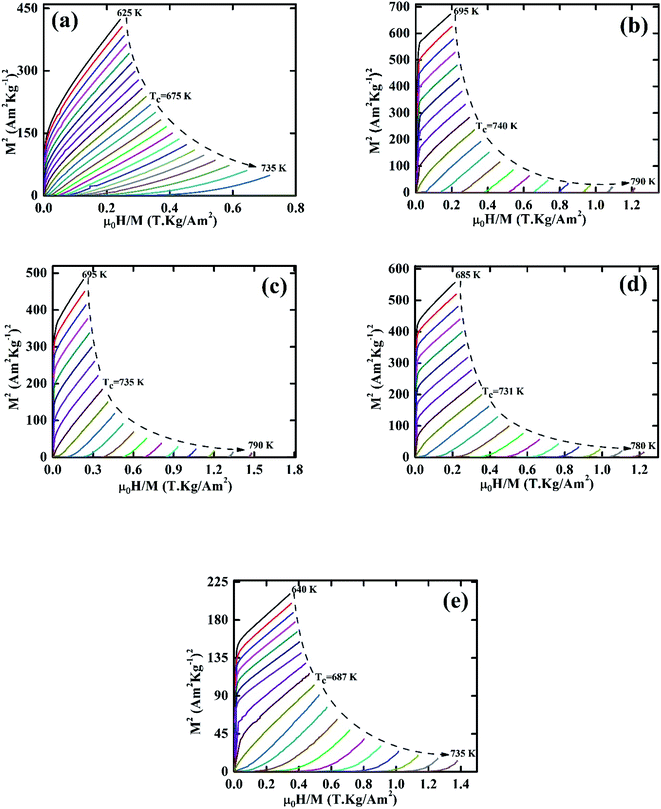 |
| | Fig. 4 Arrott plots for various Co1−xCrxFe2O4. (a) x = 0.0, (b) x = 0.125, (c) 0.25, (d) 0.375, and (e) x = 0.500. | |
The set of critical exponents (β, γ, and δ) are calculated by analyzing spontaneous magnetization (MSP), zero-field susceptibility (χ0), and magnetization isotherm at the TC using the following power-laws:4,34
| | |
MSP(T) = M0(−ε)β, for ε < 0, T < TC,
| (14) |
| | |
χ0(T) = Γ(ε)γ, for ε > 0, T > TC
| (15) |
| | |
M = D1(μ0H)1/δ, for ε = 0, T = TC
| (16) |
| | |
M(μ0H,ε)|ε|−β = f±μ0H|ε|−(β+γ)
| (17) |
where,

is the reduced temperature,
M0,
Γ, and
D1 are the critical coefficients, and
f+ and
f− are the scaling functions above and below
TC, respectively.
To calculate the values of β and γ (using eqn (14) and (15)) the MSP vs. T, and 1/χ0 vs. T are presented in Fig. 5. From Fig. 5 the β and γ values are estimated from the fitting curve for all the samples that have been tabulated in Table 2. From Table 2 it is found that the values of β and γ are close to the values of the mean-field model for the samples x = 0.125, 0.250, 0.375, however, for x = 0 and x = 0.5, there is a large difference that affects the MCE values as explained in the Section 3.4. The TC values are also calculated from the fitting curve of Fig. 5 which also has been tabulated in Table 2 and the values are close to that obtained from M–T measurements described in Section 3.2. The  vs.
vs.  graphs (MAP) for all samples are presented in Fig. 6 using the β, and γ values extracted from Fig. 5. These MAP plots show the straight line that passes through the origin at TC for x = 0.125, 0.25, 0.375, and 0.500 which satisfy the required condition discussed earlier, however, x = 0 shows dissimilar behavior.
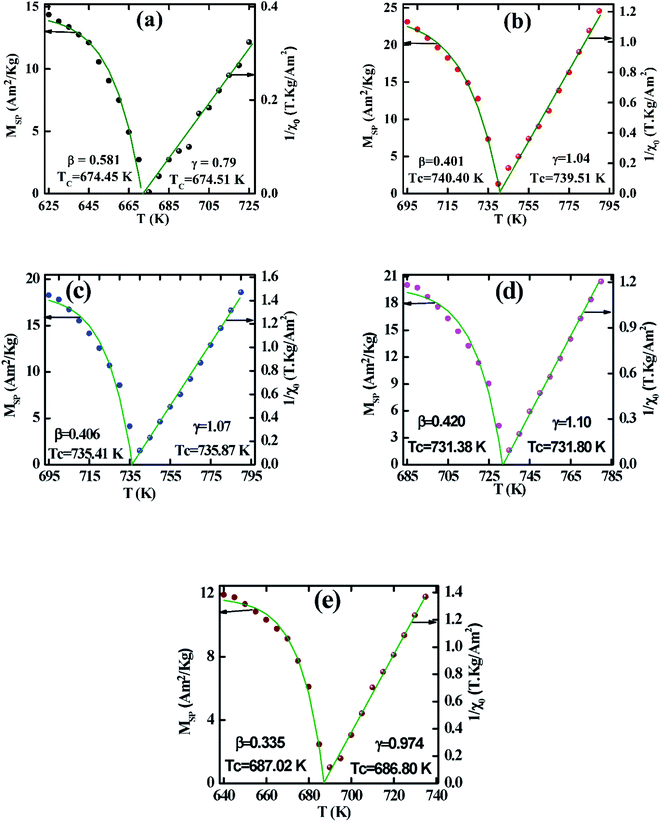 |
| | Fig. 5 Spontaneous magnetization MSP and zero field inverse susceptibility χ0−1 as a function of temperature for various Co1−xCrxFe2O4. (a) x = 0.0, (b) x = 0.125, (c) 0.25, (d) 0.375, and (e) x = 0.500. | |
Table 2 The obtained values of critical exponents (β, γ, and δ) and TCs from the modified Arrott plot (MAP), Kouvel–Fisher (KF) plot, critical isotherm, Widom scaling, magnetocaloric effect, and relative cooling power (RCP) analysis across the PM–FM transition region for various Co1−xCrxFe2O4
| x |
β |
γ |
δ |
n |
TC (K) |
Methods |
| 0.000 |
0.581 |
0.79 |
— |
— |
674.45 |
MAP |
| 674.51 |
| 0.325 |
1.17 |
— |
0.231 |
673.37 |
KF |
| 673.42 |
| — |
— |
3.23 |
— |
— |
Critical isotherm |
| — |
— |
2.34 |
— |
— |
MCE/RCP |
| — |
— |
— |
0.910 |
675 |
|ΔSmaxm| |
| — |
— |
2.36 |
— |
— |
Widom scaling |
| 0.125 |
0.401 |
1.04 |
— |
— |
740.4 |
MAP |
| 739.5 |
| 0.461 |
0.998 |
— |
0.676 |
740.12 |
KF |
| 740.09 |
| — |
— |
3.61 |
— |
— |
Critical isotherm |
| — |
— |
3.64 |
— |
— |
MCE/RCP |
| — |
— |
— |
0.677 |
740 |
|ΔSmaxm| |
| — |
— |
3.59 |
— |
— |
Widom scaling |
| 0.250 |
0.406 |
1.07 |
— |
— |
735.41 |
MAP |
| 735.87 |
| 0.464 |
1.03 |
— |
0.685 |
734.92 |
KF |
| 735.09 |
| — |
— |
3.62 |
— |
— |
Critical isotherm |
| — |
— |
3.65 |
— |
— |
MCE/RCP |
| — |
— |
— |
0.690 |
735 |
|ΔSmaxm| |
| — |
— |
3.63 |
— |
— |
Widom scaling |
| 0.375 |
0.42 |
1.1 |
— |
— |
731.38 |
MAP |
| 731.80 |
| 0.466 |
1.01 |
— |
0.682 |
731.32 |
KF |
| 730.89 |
| — |
— |
3.60 |
— |
— |
Critical isotherm |
| — |
— |
3.61 |
— |
— |
MCE/RCP |
| — |
— |
— |
0.679 |
731 |
|ΔSmaxm| |
| — |
— |
3.62 |
|
— |
Widom scaling |
| 0.500 |
0.335 |
0.974 |
— |
— |
687.02 |
MAP |
| 686.80 |
| 0.331 |
1.08 |
— |
0.422 |
686.85 |
KF |
| 686.89 |
| — |
— |
3.50 |
— |
— |
Critical isotherm |
| — |
— |
4.43 |
— |
— |
MCE/RCP |
| — |
— |
— |
0.501 |
687 |
|ΔSmaxm| |
| — |
— |
3.91 |
— |
— |
Widom scaling |
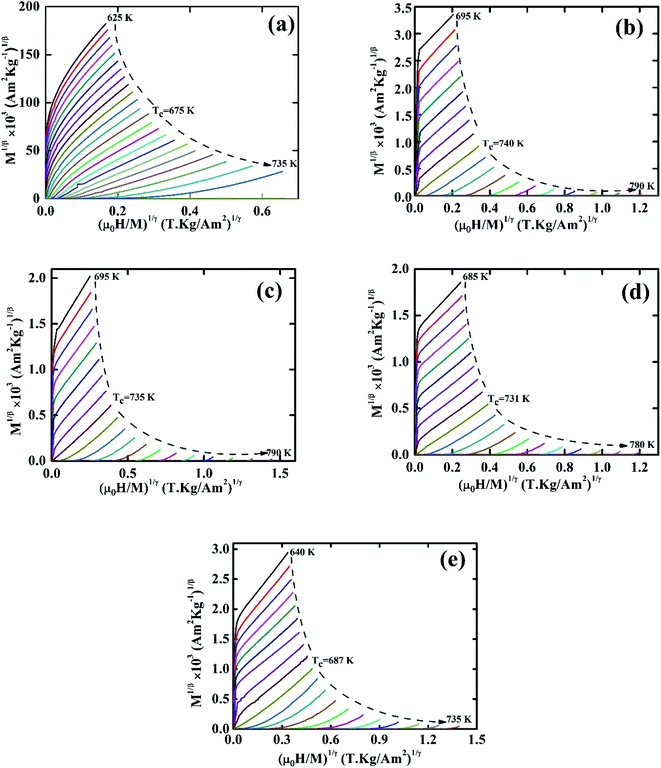 |
| | Fig. 6 Modified Arrott plot for various Co1−xCrxFe2O4. (a) x = 0.0, (b) x = 0.125, (c) 0.25, (d) 0.375, and (e) x = 0.500. | |
The variation in the critical isotherm M(TC,H) can be described by a power-law (eqn (16)) characterized by the critical exponent δ. The critical exponent δ has been obtained from the inverse of slopes of M(TC) vs. H curve in the log–log scale as shown in Fig. 7. The δ values are also determined from the previously calculated β, and γ values according to statistical theory using Widom relation:46
| |
 | (18) |
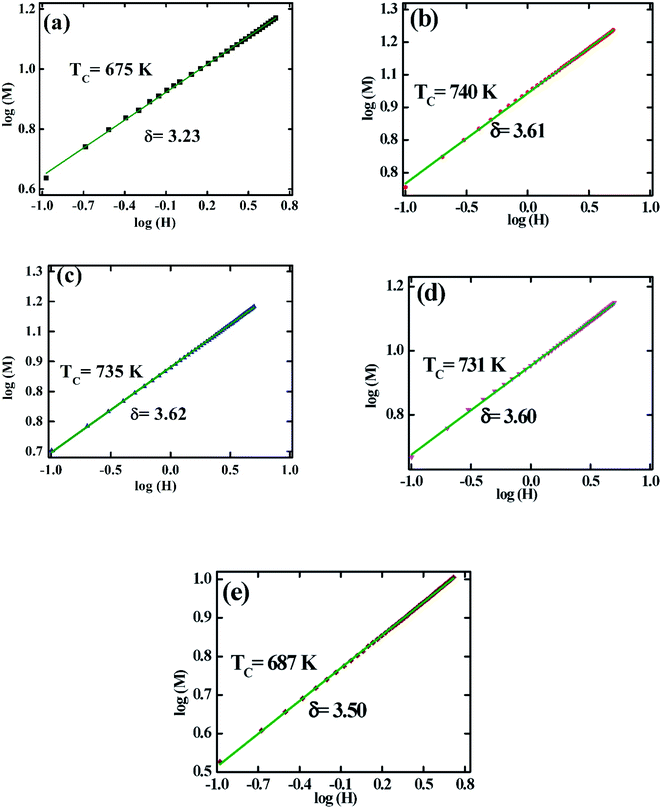 |
| | Fig. 7 The log–log plot of isothermal magnetization (M) vs. applied field (H) for various Co1−xCrxFe2O4. (a) x = 0.0, (b) x = 0.125, (c) 0.25, (d) 0.375, and (e) x = 0.500. | |
The estimated δ values according to the above two cases for all samples are tabulated in Table 2. The δ values for both cases are close to each other for the sample for x = 0.125, 0.25, and 0.375 universal class. But for x = 0.00, and 0.500 the δ values do not match each other.
3.3.2 Kouvel–Fisher plot. The β, γ, and TC have been calculated from the Kouvel–Fisher plots (KFPs) that provide more reliable values.47 In KFPs β, γ, and TC has been extracted from  and
and  vs. T graph (Fig. 8) according to the following expressions:34
| |
 | (19) |
| |
 | (20) |
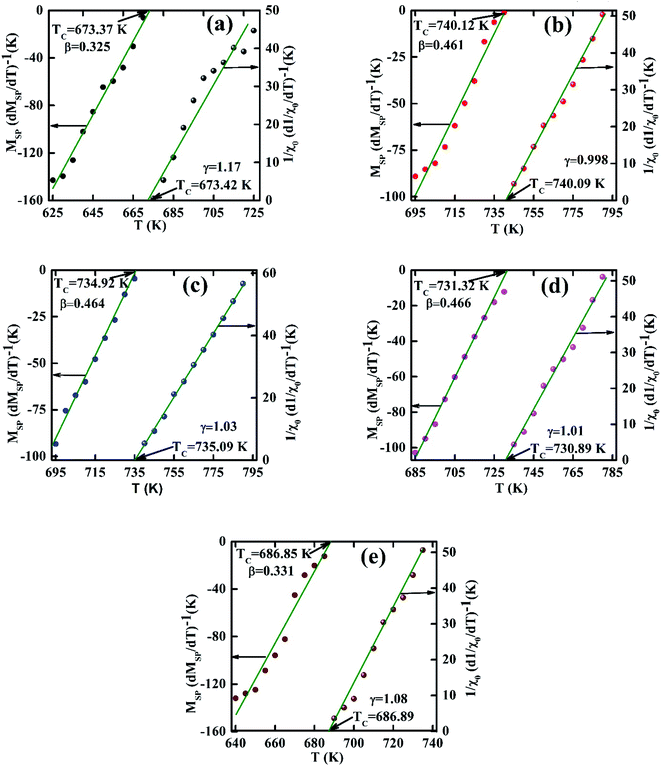 |
| | Fig. 8 Kouvel–Fisher plots MSP and χ0−1 as a function of temperature for various Co1−xCrxFe2O4. (a) x = 0.0, (b) x = 0.125, (c) 0.25, (d) 0.375, and (e) x = 0.500. | |
TC values are extracted from the X-intercepts, and critical β and γ values are obtained from the inverse of slopes of the fitted straight line of Fig. 8. The estimated β, γ, and TC values for all the samples according to KFPs are tabulated in Table 2, where β, γ, and TC values are well-matched with the values as the mean-field theory for x = 0.125, 0.250, and 0.375. However, for x = 0.00, and 0.500 the β, and γ values calculated from KFPs show a remarkable difference compared to that of mean-field theory.
To ensure the reliability of β, γ, and TC values another robust method have been elucidated by plotting M|ε|−β vs. μ0H|ε|−(β+γ)) just above and below TC according to eqn (17). The M|ε|−β vs. μ0H|ε|−(β+γ)) have been plotted for all samples in Fig. 9. The inset in Fig. 9, each case displays the same data plotted on a log–log scale. From Fig. 9, it is evident that two separate groups of isotherms superimpose (one group greater than TC, and the other group less than TC) for the samples x = 0.125, 0.250, and 0.375. These results suggest the accuracy of β, γ, and TC values from which it can be decided that these three compositions (x = 0.125, 0.250, and 0.375) are a universal class of material. From the inset of Fig. 9, two branches (one below TC and other above TC) show the linear behavior in the high field region while in the low field region show some deviation from linearity. These behaviors confirm that the scale theory gives more important data in higher fields. The isotherms for x = 0.00, and 0.500 show different behavior that imply the non-universal class of the materials.
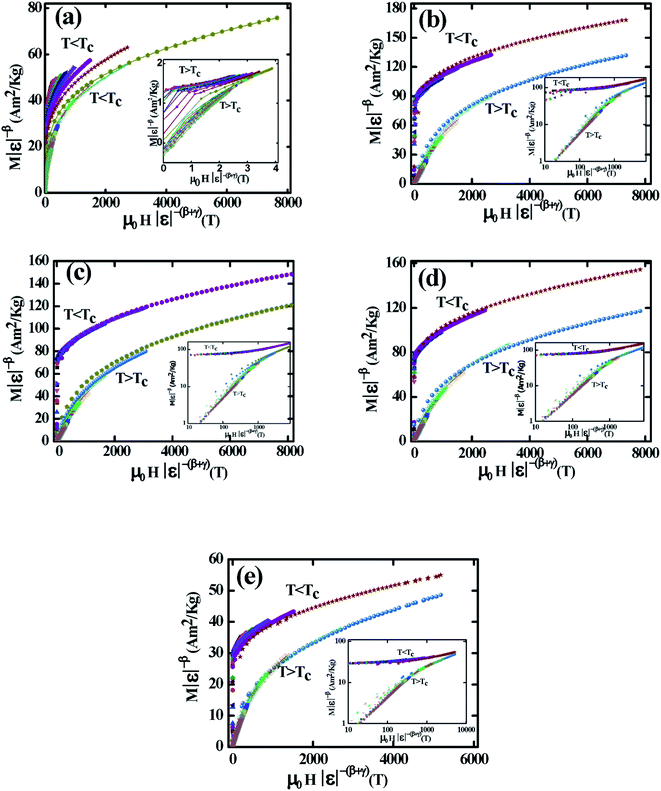 |
| | Fig. 9 Scaling plots below and above TC values using β and γ estimated using the Kouvel–Fisher method. Insets show plots in the log–log scale for various Co1−xCrxFe2O4. (a) x = 0.0, (b) x = 0.125, (c) 0.25, (d) 0.375, and (e) x = 0.500. | |
3.4 Magnetocaloric effect
The MCE properties is an intrinsic properties of magnetic materials that can be calculated by calculating the magnetic entropy change (ΔSm) around TC. The ΔSm values are calculated from the isothermal M–H data based on Maxwell's thermodynamic relation:34| |
 | (21) |
The calculated ΔSm for all samples show negative values for all temperature and applied magnetic field. The calculated −ΔSm values as a function of temperature are illustrated in Fig. 10 for all samples at different magnetic fields up to 5 T. From Fig. 10, the peak values of −ΔSm are defined as maximum entropy change |ΔSmaxm| are evident at TC or close to TC. From Fig. 10 it is observed that |ΔSmaxm| increases with an increase of magnetic field are due to the spin ordering for all the samples. The |ΔSmaxm| values are tabulated in Table 3 for 5 T for all samples. Table 3 shows that for x = 0.125, maximum entropy change is observed, however, a decreasing trend is found for further increasing of Cr content. The similar behavior is observed for Ms.
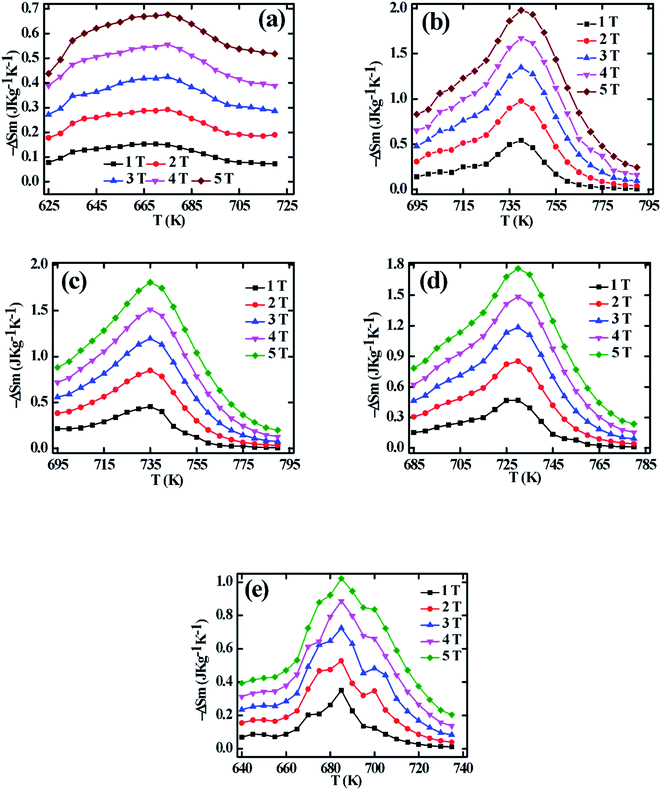 |
| | Fig. 10 Magnetic entropy change as a function of temperature for various Co1−xCrxFe2O4. (a) x = 0.0, (b) x = 0.125, (c) 0.25, (d) 0.375, and (e) x = 0.500. | |
Table 3 Comparison of the Curie temperature, |ΔSmaxm| and RCP for various Co1−xCrxFe2O4 and some other reported samples
| Samples |
TC (K) |
μ0H (T) |
|ΔSmaxm| J kg−1 K−1 |
RCP (J kg−1) |
Reference |
| CoFe2O4 |
675 |
5 |
0.66 |
35.7 |
This work |
| Co0.875Cr0.125Fe2O4 |
740 |
5 |
1.98 |
128 |
| Co0.75Cr0.25Fe2O4 |
735 |
5 |
1.8 |
137 |
| Co0.625Cr0.375Fe2O4 |
731 |
5 |
1.76 |
145 |
| Co0.5Cr0.5Fe2O4 |
687 |
5 |
1.02 |
52 |
| Ni0.6Cd0.2Cu0.2Fe2O4 |
680 |
5 |
2.12 |
125 |
Ref. 4 |
| Zn0.4Ni0.2Cu0.4Fe2O4 |
565 |
5 |
1.41 |
141 |
Ref. 29 |
| Ni0.4Mg0.3Cu0.3Fe2O4 |
690 |
5 |
1.56 |
136 |
Ref. 30 |
| Zn0.25Ni0.25Mg0.5Fe2O4 |
590 |
5 |
1.16 |
90 |
Ref. 31 |
| Mg0.6Cu0.2Ni0.2Fe2O4 |
670 |
5 |
1.38 |
137 |
Ref. 32 |
| Mg0.6Cu0.4Fe2O4 |
630 |
5 |
1.09 |
136 |
Ref. 32 |
Relative Cooling Power (RCP) is another important criterion that helps to characterize the MCE of such magnetic materials. The RCP for all samples has been calculated using the following relation:4
| | |
RCP = |ΔSmaxm| × δTFWHM
| (22) |
where
δTFWHM is the full width of the 0.5|Δ
Smaxm|. The calculated RCP values are tabulated in
Table 3, where very lower values of RCP with lower |Δ
Smaxm| for
x = 0.00 are evident which may be due to the non-universal nature as explained in Section 3.3. For
x = 0.125, 0.250, and 0.375 it show the comparable values of RCP reported earlier for various ferrite materials.
4,29–32 From
Table 3, RCP values are found to increase with the increasing Cr content and found a maximum of 145 J kg
−1 for
x = 0.375 which is higher than the previously reported RCP values.
4,29–32 For
x = 0.500 the RCP values are found to be very low which may be due to showing negative values of the vacancy parameter as explained in the previously reported article.
25 Another reason behind showing the lower values of RCP is non-universal behavior for
x = 0.500.
To analyze the critical exponent, the magnetic field dependent |ΔSmaxm| and RCP are fitted according to the following power law:38
| |
 | (24) |
where,
n is the exponent that depends on the magnetic state of the samples. The |Δ
Smaxm|
vs. μ0H are plotted in the log–log scale and illustrated in
Fig. 11(a) for all samples, and the values of
n are obtained from the slope of the linear fitting. The obtained
n values have been tabulated in
Table 2. To explain the reliability of this exponent, calculated the value of
n at/near
TC by using the following relation:
34| |
 | (25) |
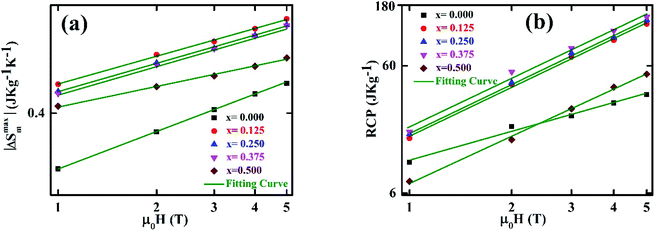 |
| | Fig. 11 Magnetic field dependence (a) |ΔSmaxm|at TC fitted to the power law |ΔSmaxm| ∝ (μ0H)n, (b) RCP at TC fitted to the power law RCP ∝ (μ0H)1+1/δ. | |
By applying the Widom relation eqn (18) and (25) can be rewritten as
| |
 | (26) |
The calculated n exponents (using eqn (26)) have been tabulated in Table 2 for all compositions. In this case β and γ values are considered from KFPs, and values of δ are considered from the critical isotherms. The exponent calculated from eqn (26) are in good agreement with those obtained from the fitted curve of Fig. 11(a) for x = 0.125, 0.250, and 0.375. For x = 0.00, and 0.500, there is a large difference in the value of n.
The δ values have been obtained from the slope of the linear fit of the RCP vs. μ0H plot in the log–log scale (Fig. 11(b)) according to eqn (24). The obtained δ values by this method are tabulated in Table 2, from where δ values show a good agreement with those of δ values obtained from Widom scaling and critical isotherms for the samples x = 0.125, 0.25, and 0.375 (Sec. 3.3). However, for x = 0.00, 0.500 a large difference of δ values has been obtained. Comparing the values of n and δ according to Fig. 11, and critical scaling it is decided that the MCE properties of present compositions are reliable.
Verification of critical phenomena and the nature of the magnetic phase transition of these materials are also important. In 2006, Franco et al. have utilized the phenomenological universal scaling curve.39 According to this method normalized magnetic entropy as a function of re-scaled temperature θ (eqn (27)) has been plotted at several magnetic fields which are depicted in Fig. 12.
| |
 | (27) |
where,
Tr1 and
Tr2 are two-temperatures corresponding to 0.5|Δ
Smaxm|.
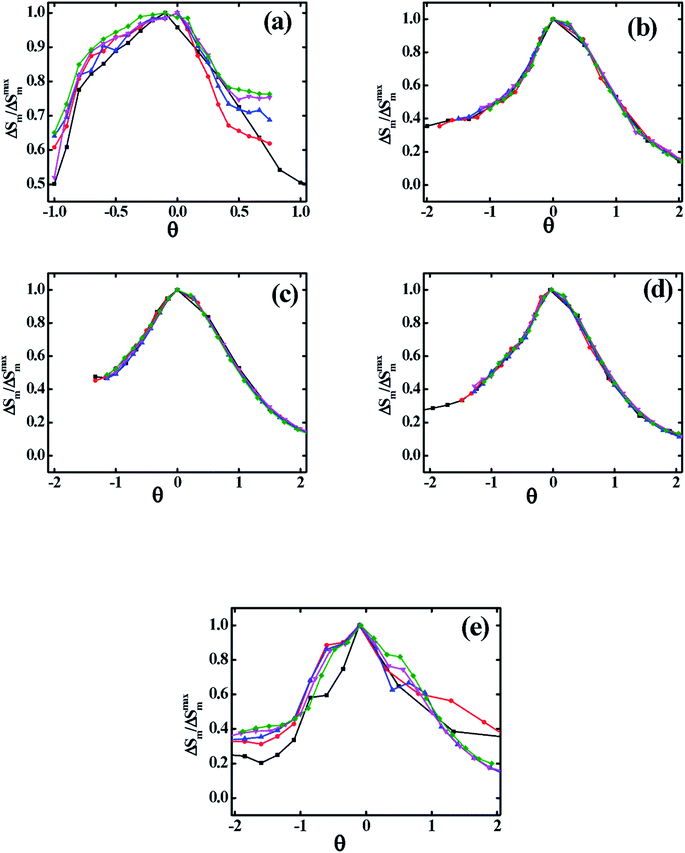 |
| | Fig. 12 Normalized magnetic entropy change as function of rescaled temperature for various Co1−xCrxFe2O4. (a) x = 0.0, (b) x = 0.125, (c) 0.25, (d) 0.375, and (e) x = 0.500. | |
In Fig. 12(b–d) it is observed that the results of various magnetic field collapsed into a single master curve, which implies that synthesized samples of x = 0.125, 0.250, and 0.375 are in universal class and show exact second-order phase transition.34 However, from Fig. 12(a and e) it is evident that for x = 0.00, and 0.500, samples are non-universal class.
To analyze the accuracy of MCE properties and order of phase transition, the value of n is calculated using the following expression:38
| |
 | (28) |
The calculated n values as a function of T are illustrated in Fig. 13 for all samples where the inset depicted the |ΔSm| vs. μ0H. From the Fig. 13(b–d), it is found that the n values for x = 0.125, 0.250, 0.375 are close to 1 below TC which suggests that the dM/dT term in eqn (21) is weakly field-dependent.34 With an increase in temperature it is observed the decreasing trend and arrive the minimum n values of 0.684, 0.695, and 0.693 at TC for x = 0.125, 0.25, and 0.375, respectively. These n values are consistent with the n values obtained from Fig. 11(a) and also from eqn (26) as tabulated in Table 2. Above TC, the n values are found to be the increasing trend but do not cross the critical value of 2 for x = 0.125, 0.250, and 0.375. The minimum n values at TC and n < 2 above TC confirm the second-order phase transition which is explained by Law et al.38 For x = 0.00, and 0.500 as evident from Fig. 13(a and e) it is found the anomalous behavior of n-T curves shows the minimum n values at TC which is very different compared with that of the n values described in Sec. 3.3. This behavior for x = 0.00, and 0.500 is non-universal class of materials showing the non-realistic MCE values. Although n-T shows anomalous behavior, however, n values less than 2 for all the temperature suggest that the samples (x = 0.00, and 0.500) exhibit the second-order phase transition.
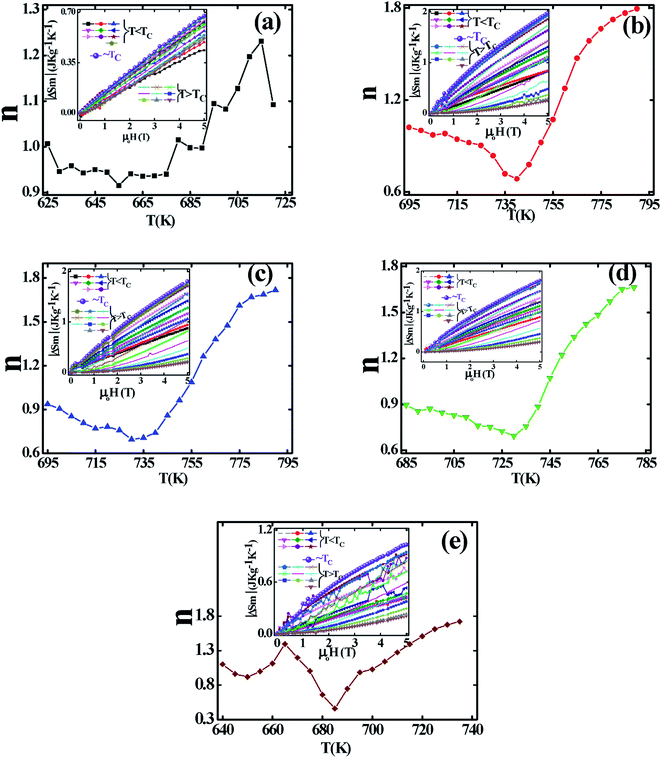 |
| | Fig. 13 The exponent n as function of temperature obtained from the fitting of field dependent isothermal magnetic entropy change at various temperature for various Co1−xCrxFe2O4. (a) x = 0.0, (b) x = 0.125, (c) 0.25, (d) 0.375, and (e) x = 0.500. | |
4 Conclusions
The effect of Cr3+ substitution on the magnetic and MCE properties of various Co1−xCrxFe2O4 prepared by the solid–state reaction technique have been evident in this report. The Arrott plot from the analysis of M–H isotherms exhibits the second-order phase transition that has been perfectly confirmed from the critical analysis and scaling analysis of the MCE effect. The x = 0.125, 0.250, and 0.375 samples demonstrate high RCP values in the range of 127–145 J kg−1 compared to that of other ferrites. The universal curve scaling and scaling analysis of the MCE effect confirms the universal class and the MCE values for x = 0.125, 0.250, and 0.375 are reliable. The higher MCE values up to 145 J kg−1 are observed for x = 0.375, which might be considered as potential candidates for the cooling technology. On the other hand, the higher microwave frequency for all compositions makes them a strong candidate for high-frequency microwave applications, especially in satellite communications and biomedical applications.
Conflicts of interest
There are no conflicts to declare.
Acknowledgements
The authors are thankful to the Committee for Advanced Studies & Research (CASR), Grant No. 343(15), Bangladesh University of Engineering and Technology for the financial support. The authors are also thankful to the International Science Program (ISP), Uppsala University, Sweden for supporting the magnetization measurements of MRL, the University of Illinois at Urbana-Champaign, USA. The authors are also thankful to MRL Laboratories, the University of Illinois at Urbana-Champaign, USA for considering the reduced rate of measurement cost. Assistance of Prof. F. A. Khan (a former colleague) for arrangement of this measurement is also gratefully acknowledged.
References
- J. Massoudi, M. Smari, K. Nouri, E. Dhahri, K. Khirouni, S. Bertaina, L. Bessais and El K. Hlil, RSC Adv., 2020, 10(57), 34556–34580 RSC.
- N. Amri, J. Massoudi, K. Nouri, M. Triki, E. Dhahri and E. L. Bessais, RSC Adv., 2021, 11(22), 13256–13268 RSC.
- H. Q. Alijani, S. Iravani, S. Pourseyedi, M. Torkzadeh-Mahani, M. Barani and M. Khatami, Sci. Rep., 2021, 11(1), 17431 CrossRef CAS PubMed.
- N. Kouki, S. Hcini, M. Boudard, R. Aldawas and A. Dhahri, RSC Adv., 2019, 9(4), 1990–2001 RSC.
- S. Dudziak, Z. Ryzynska, Z. Bielan, J. Ryl, T. Klimczuk and A. Zielińska-Jurek, RSC Adv., 2020, 10(32), 18784–18796 RSC.
- A. A. Azab, A. M. Mansour and G. M. Turky, Sci. Rep., 2020, 10(1), 4955 CrossRef CAS PubMed.
- J. Saini, M. Sharma and B. K. Kuanr, Nanoscale Adv., 2021, 3, 6074–6087 RSC.
- A. Spivakov, C. Lin, E. Lin, Y. Chen and Y. Tseng, Nanoscale Res. Lett., 2021, 16, 162 CrossRef CAS PubMed.
- S. G. Greculeasa, P. Palade, G. Schinteie, A. Leca, F. Dumitrache, I. Lungu, G. Prodan, A. Kuncser and V. Kuncser, Sci. Rep., 2020, 10, 17174 CrossRef CAS PubMed.
- R. Ramzan, M. Tariq, M. N. Ashiq, H. Albalawi, I. Ahmad, M. H. Alhossainy, S. R. Ejaz, R. Y. Khosa, H. M. T. Farid, H. M. Khan, T. I. Al-Muhimeedh and A. A. AlObaid, J. Mater. Res. Technol., 2021, 12, 1104–1112 CrossRef CAS.
- S. K. Gore, S. S. Jadhav, V. V. Jadhav, S. M. Patange, M. Naushad, R. S. Mane and K. H. Kim, Sci. Rep., 2017, 7, 2524 CrossRef PubMed.
- S. Jauhar, J. Kaur, A. Goyal and S. Singhal, RSC Adv., 2016, 6(100), 97694–97719 RSC.
- S. Y. Srinivasan, K. M. Paknikar, D. Bodas and V. Gajbhiye, Nanomedicine, 2018, 13(10), 1221–1238 CrossRef CAS PubMed.
- S. R. Mokhosi, W. Mdlalose, A. Nhlapo and M. Singh, Pharmaceutics, 2022, 14, 937 CrossRef PubMed.
- D. Karthickraja, S. Karthi, G. A. Kumar, D. K. Sardar, G. C. Dannangoda, K. S. Martirosyan and E. K. Girija, New J. Chem., 2019, 43, 13584–13593 RSC.
- C. Vázquez-Vázquez, M. Lovelle, C. Mateo, M. A. López-Quintela, M. C. Buján-Núñez, D. Serantes, D. Baldomir and J. Rivas, Phys. Status Solidi, 2008, 205(6), 1358–1362 CrossRef.
- E. V. Gopalan, I. A. Al-Omari, D. S. Kumar, Y. Yoshida, P. A. Joy and M. R. Anantharaman, Appl. Phys. A, 2010, 99(2), 497–503 CrossRef CAS.
- A. Hai, B. Alqassem, G. Bharath, K. Rambabu, I. Othman, M.
A. Haija and F. Banat, Electrochim. Acta, 2020, 137083 CrossRef CAS.
- S. Rehman, M. A. Ansari, M. A. Alzohairy, M. N. Alomary, B. R. Jermy, R. Shahzad, N. Tashkandi and Z. H. Alsalem, Biomed. App., 2019, 7(10), 714 CAS.
- S. Xavier, S. Thankachan, B. P. Jacob and E. M. Mohammed, J. Nanotechnol., 2013, 2013, 1–7 Search PubMed.
- Y. Slimani, M. A. Almessiere, S. Guner, B. Aktas, S. E. Shirsath, M. V. Silibin, A. V. Trukhanov and A. Baykal, ACS Omega, 2022, 7, 6292–6301 CrossRef CAS PubMed.
- D. Thomas, I. G. Deac, C. Oana, E. A. Levei, L. Diamandescu and G. Borodi, J. Alloys Compd., 2019, 792, 432–443 CrossRef.
- M. A. Almessiere, Y. Slimani, H. Güngüneş, S. Ali, A. Manikandan, I. Ercan, A. Baykal and A. V. Trukhanov, Nanomater., 2019, 9(6), 820 CrossRef CAS PubMed.
- G. A. Lone and M. Ikram, J. Alloys Compd., 2022, 908, 164589 CrossRef CAS.
- M. A. Islam, A. K. M. Akther Hossain, M. Z. Ahsan, M. A. A. Bally, M. Samir Ullah, S. M. Hoque and F. A. Khan, RSC Adv., 2022, 12, 8502–8519 RSC.
- B. Branka, J. Vukoman, M. Dušan, J. Zvonko, M. Darko, J. Nataša and M. Marinović-Cincović, J. Nanomater., 2013, 2013, 1–9 Search PubMed.
- R. B. Kamble, V. Varade, K. P. Ramesh and V. Prasad, AIP Adv., 2015, 5(1), 017119 CrossRef.
- M. A. Abdullah Dar, J. Shah, W. A. Siddiqui and R. K. Kotnala, Appl. Nanosci., 2014, 4(6), 675–682 CrossRef CAS.
- E. Oumezzine, S. Hcini, M. Baazaoui, E. K. Hlil and M. Oumezzine, Powder Technol., 2015, 278, 189–195 CrossRef CAS.
- S. Hcini, N. Kouki, R. Aldawas, M. Boudard, A. Dhahri and M. L. Bouazizi, J. Supercond. Novel Magn., 2018, 32, 1085–1094 CrossRef.
- N. Fortas, A. Belkahla, S. Ouyahia, J. Dhahri, E. K. Hlil and K. Taibi, Solid State Sci., 2020, 101, 106137 CrossRef CAS.
- S. Hcini, A. Dhahri, S. Zemni and M. L. Bouazizi, J. Mater. Sci.: Mater. Electron., 2019, 30, 6127–6138 CrossRef CAS.
- A. M. Tishin and Y. I. Spichkin, The magnetocaloric effect and its applications, IOP Publishing, ISBN, 0750309229, 2003 Search PubMed.
- V. Singh, P. Bag, R. Rawat and R. Nath, Sci. Rep., 2020, 10(1), 6981 CrossRef CAS PubMed.
- A. Boutahar, R. Moubah, E. K. Hlil, H. Lassri and E. Lorenzo, Sci. Rep., 2017, 7(1), 13904 CrossRef CAS PubMed.
- A. Arrott, Phys. Rev., 1957, 108(6), 1394–1396 CrossRef CAS.
- A. Arrott and A. J. E. Noakes, Phys. Rev. Lett., 1967, 19, 786 CrossRef CAS.
- J. Y. Law, V. Franco, L. M. Moreno-Ramírez, A. Conde, D. Y. Karpenkov, I. Radulov, K. P. Skokov and O. Gutfleisch, Nat. Commun., 2018, 9(1), 2680 CrossRef PubMed.
- V. Franco, J. S. Blazquez and A. Conde, Appl. Phys. Lett., 2006, 89(22), 222512 CrossRef.
- S. Chakrabarty, A. Dutta and M. Pal, J. Magn. Magn. Mater., 2018, 461, 69–75 CrossRef CAS.
- S. E. Shirsath, S. S. Jadhav, B. G. Toksha, S. M. Patange and K. M. Jadhav, J. Appl. Phys., 2011, 110(1), 013914 CrossRef.
- M. Zhang, Z. Zi, Q. Liu, P. Zhang, X. Tang, J. Yang, X. Zhu, Y. Sun and J. Dai, Adv. Mater. Sci. Eng., 2013, 2013, 1–10 Search PubMed.
- C. Caizer, Mater. Sci. Eng., B, 2003, 100(1), 63–68 CrossRef.
- P. Mehrotra, B. Chatterjee and S. Sen, Sens, 2019, 19(5), 1013 CrossRef CAS PubMed.
- L. D. Landau and E. M. Lifshitz, Statistical Physics, “Theoretical Physics”, Pergamon, Oxford, 1996, vol. 5 Search PubMed.
- B. Widom, J. Chem. Phys., 1964, 41(6), 1633 CrossRef.
- J. S. Kouvel and M. E. Fisher, Phys. Rev., 1964, 136(6), A1626–A1632 CrossRef.
|
| This journal is © The Royal Society of Chemistry 2022 |
Click here to see how this site uses Cookies. View our privacy policy here.  Open Access Article
 and
A. K. M. Akther Hossain
 *
*
![[thin space (1/6-em)]](https://www.rsc.org/images/entities/char_2009.gif) 000 psi and then sintered at 1200 °C for 6 h. Then a part of sintered pellets was re-crushed into fine powder for performing X-ray diffraction (XRD) to confirm the formation of spinel-type ferrite. The results of phase formation have been reported elsewhere.25 After confirming the formation of spinel-type ferrites, these compositions are subjected to further investigation of their magnetic properties. The FC and ZFC magnetization were performed for the measurement of the phase transition temperature. The M–H hysteresis loop measurements were performed at room temperature for saturation magnetization and other relevant parameters, The M–H isotherms at a various temperatures above and below the magnetic phase transition for each composition have been conducted by using Quantum Design MPMS3 SQUID magnetometer. Then the MCE properties and critical scaling have been analyzed for each composition using standard method described in Section 3.4.
000 psi and then sintered at 1200 °C for 6 h. Then a part of sintered pellets was re-crushed into fine powder for performing X-ray diffraction (XRD) to confirm the formation of spinel-type ferrite. The results of phase formation have been reported elsewhere.25 After confirming the formation of spinel-type ferrites, these compositions are subjected to further investigation of their magnetic properties. The FC and ZFC magnetization were performed for the measurement of the phase transition temperature. The M–H hysteresis loop measurements were performed at room temperature for saturation magnetization and other relevant parameters, The M–H isotherms at a various temperatures above and below the magnetic phase transition for each composition have been conducted by using Quantum Design MPMS3 SQUID magnetometer. Then the MCE properties and critical scaling have been analyzed for each composition using standard method described in Section 3.4.
![[3 with combining macron]](https://www.rsc.org/images/entities/char_0033_0304.gif) m. The details of crystal structure, with cation distribution, have been explored, and results are already published in ref. 25.
m. The details of crystal structure, with cation distribution, have been explored, and results are already published in ref. 25.


 ; then the magnetic equation of state can be written as


 is the reduced temperature, M0, Γ, and D1 are the critical coefficients, and f+ and f− are the scaling functions above and below TC, respectively.
 vs.
vs.  graphs (MAP) for all samples are presented in Fig. 6 using the β, and γ values extracted from Fig. 5. These MAP plots show the straight line that passes through the origin at TC for x = 0.125, 0.25, 0.375, and 0.500 which satisfy the required condition discussed earlier, however, x = 0 shows dissimilar behavior.


 and
and  vs. T graph (Fig. 8) according to the following expressions:34


